

Measurements
Electron Spin Resonance and Transient Photocurrent ... - JuSER
Electron Spin Resonance and Transient Photocurrent ... - JuSER
- No tags were found...

You also want an ePaper? Increase the reach of your titles
YUMPU automatically turns print PDFs into web optimized ePapers that Google loves.
5.5 Conduction Band-Tail States<br />
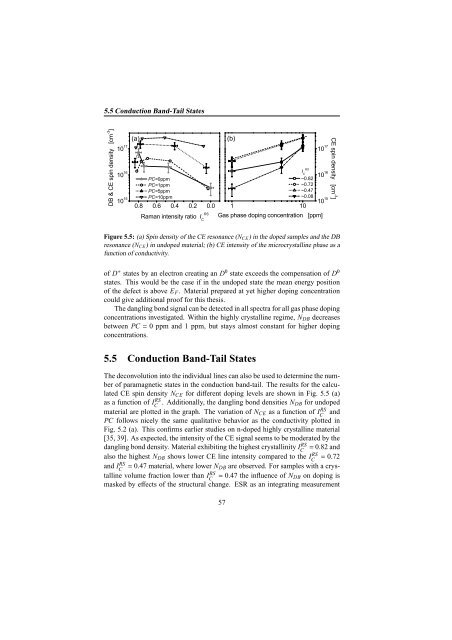
Figure 5.5: (a) Spin density of the CE resonance (N CE ) in the doped samples and the DB<br />
resonance (N CE ) in undoped material; (b) CE intensity of the microcrystalline phase as a<br />
function of conductivity.<br />
of D + states by an electron creating an D 0 state exceeds the compensation of D 0<br />
states. This would be the case if in the undoped state the mean energy position<br />
of the defect is above E F . Material prepared at yet higher doping concentration<br />
could give additional proof for this thesis.<br />
The dangling bond signal can be detected in all spectra for all gas phase doping<br />
concentrations investigated. Within the highly crystalline regime, N DB decreases<br />
between PC = 0 ppm and 1 ppm, but stays almost constant for higher doping<br />
concentrations.<br />
5.5 Conduction Band-Tail States<br />
The deconvolution into the individual lines can also be used to determine the number<br />
of paramagnetic states in the conduction band-tail. The results for the calculated<br />
CE spin density N CE for different doping levels are shown in Fig. 5.5 (a)<br />
as a function of IC<br />
RS . Additionally, the dangling bond densities N DB for undoped<br />
material are plotted in the graph. The variation of N CE as a function of IC<br />
RS and<br />
PC follows nicely the same qualitative behavior as the conductivity plotted in<br />
Fig. 5.2 (a). This confirms earlier studies on n-doped highly crystalline material<br />
[35, 39]. As expected, the intensity of the CE signal seems to be moderated by the<br />
dangling bond density. Material exhibiting the highest crystallinity IC<br />
RS = 0.82 and<br />
also the highest N DB shows lower CE line intensity compared to the IC RS = 0.72<br />
and IC<br />
RS = 0.47 material, where lower N DB are observed. For samples with a crystalline<br />
volume fraction lower than IC<br />
RS = 0.47 the influence of N DB on doping is<br />
masked by effects of the structural change. ESR as an integrating measurement<br />
57


