HbA Standardisation For Laboratory Professionals
HbA1c Standardisation - Diabetes in Scotland
HbA1c Standardisation - Diabetes in Scotland
- No tags were found...

You also want an ePaper? Increase the reach of your titles
YUMPU automatically turns print PDFs into web optimized ePapers that Google loves.
<strong>HbA</strong> 1c <strong>Standardisation</strong><br />
Scottish Diabetes Group<br />
response to alterations in management. <strong>HbA</strong> 1c should be<br />
measured 2-6 monthly. Target <strong>HbA</strong> 1c levels can be set for<br />
individual patients and therapy adjusted accordingly.<br />
How is <strong>HbA</strong> 1c reported currently?<br />
Current <strong>HbA</strong> 1c assays in the UK and other parts of the world<br />
are aligned to the assay used in the DCCT, so that an<br />
individual’s risk of complications can be inferred from the<br />
result.<br />
<strong>For</strong> <strong>Laboratory</strong> <strong>Professionals</strong><br />
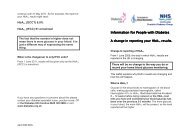
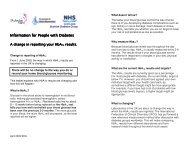
Change to reporting of <strong>HbA</strong> 1c<br />
From 1 June 2009, the way in which <strong>HbA</strong> 1c results are<br />
reported in the UK is changing. This leaflet explains why and<br />
how this will happen.<br />
What is <strong>HbA</strong> 1c ?<br />
Glucose in the blood binds non-enzymatically to the N-<br />
terminal valine residue of the β-chain of haemoglobin A in red<br />
blood cells. After spontaneous chemical modification, the<br />
Amadori rearrangement, the irreversible product <strong>HbA</strong> 1c is<br />
formed; so the higher the glucose, the higher the <strong>HbA</strong> 1c . <strong>HbA</strong> 1c<br />
circulates for the lifespan of the red blood cell. It therefore<br />
reflects the prevailing blood glucose concentration over the<br />
preceding 2-3 months.<br />
What does it tell us?<br />
The Diabetes Control and Complications Trial (DCCT) in Type<br />
1 diabetes and the UK Prospective Study (UKPDS) in Type 2<br />
diabetes both demonstrated the association between the<br />
increasing risk of microvascular and macrovascular<br />
complications of diabetes and increasing <strong>HbA</strong> 1c . <strong>HbA</strong> 1c thus<br />
gives a measure of an individual’s risk of the long-term<br />
complications of diabetes.<br />
Why measure it?<br />
Serial measurements of <strong>HbA</strong> 1c show how an individual’s<br />
glucose control, and thus risk of complications, changes in<br />
What are the current targets?<br />
General targets for <strong>HbA</strong> 1c of 6.5 - 7.5 % should be set for an<br />
individual, taking into consideration their risk of severe<br />
hypoglycaemia, cardiovascular status and co-morbidities.<br />
Why change?<br />
After the DCCT, a new standard specific for <strong>HbA</strong> 1c was<br />
prepared by the International Federation of Clinical Chemistry<br />
and <strong>Laboratory</strong> Medicine (IFCC). In future, manufacturers will<br />
supply IFCC standardised values for their calibrators as well<br />
as DCCT-aligned values. The units for reporting <strong>HbA</strong> 1c will<br />
also be changed so that <strong>HbA</strong> 1c reported by laboratories is<br />
traceable to the IFCC reference method. Global comparison<br />
of <strong>HbA</strong> 1c results will therefore be possible.<br />
What are the new units?<br />
<strong>HbA</strong>1c results traceable to the IFCC reference method will be<br />
expressed as mmol per mol.<br />
How do DCCT and IFCC results relate?<br />
The relationship between the IFCC reference method and the<br />
“DCCT aligned” assays has been stable over several years.<br />
When <strong>HbA</strong> 1c results are expressed as % haemoglobin, the<br />
equation describing the relationship is:<br />
IFCC-<strong>HbA</strong> 1c (mmol/mol) = [DCCT-<strong>HbA</strong> 1c (%) - 2.15] x 10.929<br />
A guide to the IFCC values expressed as mmol/mol is:<br />
May 2009 SDG
<strong>HbA</strong>1c (DCCT) <strong>HbA</strong>1c (IFCC)<br />
(%) (mmol/mol)<br />
4.0 20<br />
5.0 31<br />
6.0 42<br />
6.5 48<br />
7.0 53<br />
7.5 59<br />
8.0 64<br />
9.0 75<br />
10.0 86<br />
11 97<br />
12 108<br />
What are the targets?<br />
The equivalent of the <strong>HbA</strong> 1c (DCCT) targets of 6.5 % and<br />
7.5 % are 48 mmol/mol and 59 mmol/mol in IFCC units, with<br />
the non-diabetic reference range of 4.0 % to 6.0 % being 20<br />
mmol/mol to 42 mmol/mol.<br />
When is the changeover to new units?<br />
<strong>HbA</strong> 1c results expressed in IFCC units are obviously very<br />
different from those currently in use.<br />
From 1 June, 2009, results will be provided in the UK as both<br />
IFCC-standardised units (mmol/mol) and DCCT-aligned units<br />
(%). This will give everyone time to become familiar with the<br />
IFCC units and how they relate to DCCT numbers, and thus to<br />
the risk of complications.<br />
From 1 June 2011, results will be reported only in the IFCC<br />
units.<br />
What are the limitations of <strong>HbA</strong> 1c measurement?<br />
As with the current DCCT-aligned system, <strong>HbA</strong> 1c results will<br />
be misleading in certain situations eg a variety of<br />
haematological conditions where there is abnormal red cell<br />
turnover, where there is an abnormal haemoglobin, and in<br />
some patients with renal or liver disease.<br />
Various chromatographic and immunochemical techniques<br />
are used to measure <strong>HbA</strong> 1c but only ion exchange high<br />
performance liquid chromatography (IE HPLC) detects<br />
abnormal haemoglobins. In some laboratories in the UK,<br />
<strong>HbA</strong> 1c is reported in the presence of abnormal haemoglobin<br />
with a rider saying the results may not be comparable to the<br />
DCCT but in others the results are not reported. It is not<br />
known whether the glycation rate is affected by<br />
conformational changes in abnormal haemoglobin.<br />
Affinity chromatography measures glycation of both normal<br />
and abnormal haemoglobin and immunochemical methods<br />
measure glycation of some abnormal haemoglobins<br />
depending on antibody recognition.<br />
If any condition leads to a change in red cell survival, then<br />
<strong>HbA</strong> 1c measurement can, at best, be used to track changes in<br />
glycaemia when the effects on turnover are not too severe.<br />
Other measures of glycaemia may then be required, such as<br />
more reliance on self monitored blood glucose values or the<br />
use of a serum fructosamine assay, if available.<br />
Why not report eAG?<br />
Conceptually, converting an <strong>HbA</strong> 1c result to the equivalent<br />
“average glucose” concentration might help our understanding<br />
and interpretation of <strong>HbA</strong> 1c . A large international study<br />
recently produced estimated average glucose values (eAG)<br />
for <strong>HbA</strong> 1c from continuous glucose monitoring and capillary<br />
self-blood glucose measurements and <strong>HbA</strong> 1c . However, the<br />
study was carried out in a restricted population and issues<br />
have been raised about the study design. In addition, eAG will<br />
have limited applicability to the majority of patients who do not<br />
measure their own blood glucose levels and in some patients,<br />
the estimates may be inaccurate enough to be misleading. It<br />
has been agreed in the UK that eAG results will not be<br />
reported at the moment. Research into the applicability and<br />
utility of eAG to a wider range of people with diabetes is ongoing<br />
and welcomed.<br />
May 2009 SDG