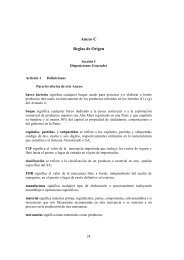
Matriz de Insumo Producto de la EconomÃa Chilena 1996
Matriz de Insumo Producto de la EconomÃa Chilena 1996
Matriz de Insumo Producto de la EconomÃa Chilena 1996

Create successful ePaper yourself
Turn your PDF publications into a flip-book with our unique Google optimized e-Paper software.
Nueva Base <strong>de</strong> Medición <strong>de</strong> <strong>la</strong> Economía <strong>Chilena</strong> <strong>1996</strong><br />
OTROS SERVICIOS SOCIALES,<br />
COMUNALES Y PERSONALES<br />
Principales resultados<br />
MERCADO DE LOS PRODUCTOS<br />
OFERTA<br />
DEMANDA<br />
Millones <strong>de</strong> pesos <strong>de</strong> <strong>1996</strong> Millones <strong>de</strong> pesos <strong>de</strong> <strong>1996</strong><br />
OFERTA NACIONAL DEMANDA INTERMEDIA<br />
Otras activida<strong>de</strong>s <strong>de</strong> servicios 5.689.462 Comercio 847.209<br />
Salud 1.762.236 Otras activida<strong>de</strong>s <strong>de</strong> servicios 787.163<br />
Educación 1.544.640 Fabricación <strong>de</strong> alimentos, bebidas y tabaco 333.133<br />
Comercio 144.952 Intermediación financiera y seguros 328.663<br />
Electricidad, gas y agua 114.711 Transporte 320.116<br />
Resto <strong>de</strong> <strong>la</strong>s activida<strong>de</strong>s 287.112 Administración pública 292.173<br />
Extracción <strong>de</strong> cobre 275.306<br />
Total Oferta Nacional. Precios Básicos 9.543.113 Construcción 200.978<br />
Fabric. <strong>de</strong> productos químicos, petróleo, caucho y plástico 188.194<br />
Impuesto al Valor Agregado 307.747 Comunicaciones 135.612<br />
Resto <strong>de</strong> <strong>la</strong>s activida<strong>de</strong>s 1.060.613<br />
Margen <strong>de</strong> Comercio<br />
Total Oferta Nacional. Precios <strong>de</strong> Usuario 9.850.861 Total Demanda Intermedia. Precios <strong>de</strong> Usuario 4.769.158<br />
OFERTA IMPORTADA DEMANDA FINAL<br />
Valor CIF 100.176 Consumo 5.109.143<br />
Derechos <strong>de</strong> Importación Hogares 3.349.951<br />
Gobierno 1.571.233<br />
Total Oferta Importada. Precios Básicos 100.176 IPSFL 187.959<br />
Formación Bruta <strong>de</strong> Capital Fijo<br />
Impuesto al Valor Agregado Variación <strong>de</strong> Existencias<br />
Exportaciones <strong>de</strong> bienes y servicios 72.735<br />
Margen <strong>de</strong> Comercio<br />
Total Oferta Importada. Precios <strong>de</strong> Usuario 100.176 Total Demanda Final. Precios <strong>de</strong> Usuario 5.181.878<br />
TOTAL OFERTA. Precios <strong>de</strong> Usuario 9.951.036 TOTAL DEMANDA. Precios <strong>de</strong> Usuario 9.951.036<br />
COSTOS DE LAS ACTIVIDADES<br />
COSTOS POR ORIGEN DEL INSUMO VALOR AGREGADO<br />
<strong>Insumo</strong>s principales. Precios <strong>de</strong> Usuario Millones <strong>de</strong> pesos <strong>de</strong> <strong>1996</strong><br />
Consumo Intermedio Nacional Importado Total Componentes<br />
Otros servicios 950.400 2.015 952.416 Remuneración <strong>de</strong> asa<strong>la</strong>riados 3.368.093<br />
Alimentos, bebidas y tabaco 359.804 46.602 406.406 Otros impuestos sobre <strong>la</strong> producción 86.179<br />
Papel e imprentas 250.368 25.230 275.598 Subvenciones -2.631<br />
Químicos, petróleo, caucho y plástico 154.537 98.035 252.572 Consumo <strong>de</strong> capital fijo 685.532<br />
Servicios <strong>de</strong> comunicaciones 116.666 116.666 Exce<strong>de</strong>nte <strong>de</strong> explotación / Ingreso mixto 2.089.176<br />
<strong>Producto</strong>s metálicos, maquinaria y equipos 46.375 68.798 115.174<br />
Electricidad, gas y agua 100.222 100.222 Total Valor Agregado 6.226.349<br />
<strong>Producto</strong>s <strong>de</strong> <strong>la</strong> construcción 85.272 85.272<br />
Servicios <strong>de</strong> transporte 73.832 6.769 80.601 Total Valor Bruto <strong>de</strong> <strong>la</strong> Producción. Pb 8.946.014<br />
Servicios <strong>de</strong> comercio 53.520 1.995 55.515<br />
<strong>Producto</strong>s agríco<strong>la</strong>s 46.786 5.229 52.015 De <strong>la</strong> cual:<br />
Textil, prendas <strong>de</strong> vestir y cueros 27.988 23.212 51.200 Producción <strong>de</strong> mercado 6.929.376<br />
Resto <strong>de</strong> los productos 160.935 15.073 176.008 Producción para uso propio 183.252<br />
Total Consumo Intermedio 2.426.705 292.960 2.719.665<br />
Producción <strong>de</strong> no mercado 1.833.386<br />
171