physicochemical
Contents of 39(1 & 2) 2011 - acharya ng ranga agricultural university
Contents of 39(1 & 2) 2011 - acharya ng ranga agricultural university
- No tags were found...
You also want an ePaper? Increase the reach of your titles
YUMPU automatically turns print PDFs into web optimized ePapers that Google loves.
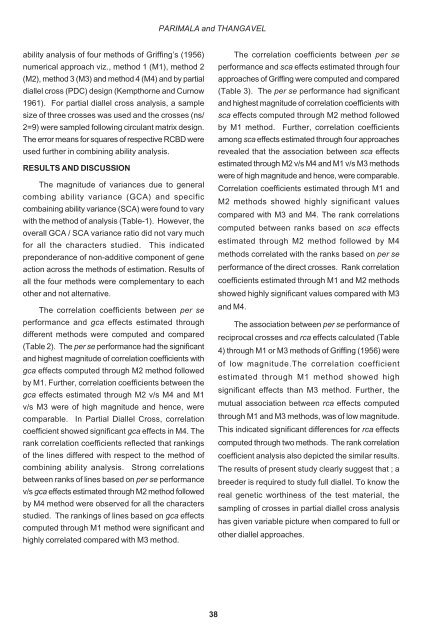
PARIMALA and THANGAVEL<br />
ability analysis of four methods of Griffing’s (1956)<br />
numerical approach viz., method 1 (M1), method 2<br />
(M2), method 3 (M3) and method 4 (M4) and by partial<br />
diallel cross (PDC) design (Kempthorne and Curnow<br />
1961). For partial diallel cross analysis, a sample<br />
size of three crosses was used and the crosses (ns/<br />
2=9) were sampled following circulant matrix design.<br />
The error means for squares of respective RCBD were<br />
used further in combining ability analysis.<br />
RESULTS AND DISCUSSION<br />
The magnitude of variances due to general<br />
combing ability variance (GCA) and specific<br />
combaining ability variance (SCA) were found to vary<br />
with the method of analysis (Table-1). However, the<br />
overall GCA / SCA variance ratio did not vary much<br />
for all the characters studied. This indicated<br />
preponderance of non-additive component of gene<br />
action across the methods of estimation. Results of<br />
all the four methods were complementary to each<br />
other and not alternative.<br />
The correlation coefficients between per se<br />
performance and gca effects estimated through<br />
different methods were computed and compared<br />
(Table 2). The per se performance had the significant<br />
and highest magnitude of correlation coefficients with<br />
gca effects computed through M2 method followed<br />
by M1. Further, correlation coefficients between the<br />
gca effects estimated through M2 v/s M4 and M1<br />
v/s M3 were of high magnitude and hence, were<br />
comparable. In Partial Diallel Cross, correlation<br />
coefficient showed significant gca effects in M4. The<br />
rank correlation coefficients reflected that rankings<br />
of the lines differed with respect to the method of<br />
combining ability analysis. Strong correlations<br />
between ranks of lines based on per se performance<br />
v/s gca effects estimated through M2 method followed<br />
by M4 method were observed for all the characters<br />
studied. The rankings of lines based on gca effects<br />
computed through M1 method were significant and<br />
highly correlated compared with M3 method.<br />
The correlation coefficients between per se<br />
performance and sca effects estimated through four<br />
approaches of Griffing were computed and compared<br />
(Table 3). The per se performance had significant<br />
and highest magnitude of correlation coefficients with<br />
sca effects computed through M2 method followed<br />
by M1 method. Further, correlation coefficients<br />
among sca effects estimated through four approaches<br />
revealed that the association between sca effects<br />
estimated through M2 v/s M4 and M1 v/s M3 methods<br />
were of high magnitude and hence, were comparable.<br />
Correlation coefficients estimated through M1 and<br />
M2 methods showed highly significant values<br />
compared with M3 and M4. The rank correlations<br />
computed between ranks based on sca effects<br />
estimated through M2 method followed by M4<br />
methods correlated with the ranks based on per se<br />
performance of the direct crosses. Rank correlation<br />
coefficients estimated through M1 and M2 methods<br />
showed highly significant values compared with M3<br />
and M4.<br />
The association between per se performance of<br />
reciprocal crosses and rca effects calculated (Table<br />
4) through M1 or M3 methods of Griffing (1956) were<br />
of low magnitude.The correlation coefficient<br />
estimated through M1 method showed high<br />
significant effects than M3 method. Further, the<br />
mutual association between rca effects computed<br />
through M1 and M3 methods, was of low magnitude.<br />
This indicated significant differences for rca effects<br />
computed through two methods. The rank correlation<br />
coefficient analysis also depicted the similar results.<br />
The results of present study clearly suggest that ; a<br />
breeder is required to study full diallel. To know the<br />
real genetic worthiness of the test material, the<br />
sampling of crosses in partial diallel cross analysis<br />
has given variable picture when compared to full or<br />
other diallel approaches.<br />
38


