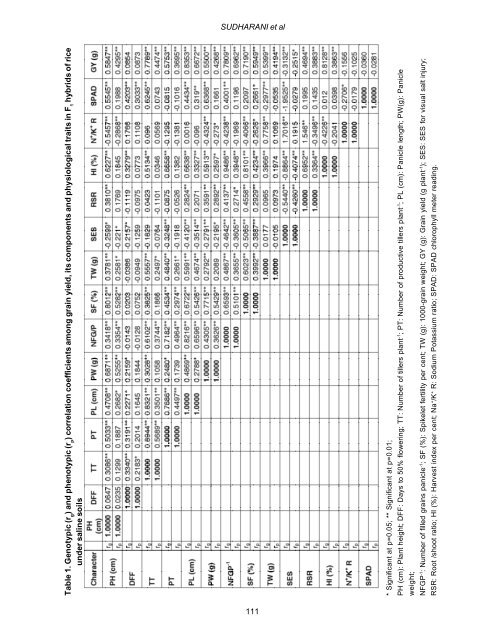
<strong>Research</strong> Notes J.Res. <strong>ANGRAU</strong> 41(1) 105-108, 2013 CORRELATION AND PATH COEFFICIENT ANALYSIS FOR YIELD AND PHYSIOLOGICAL ATTRIBUTES IN RICE (Oryza sativa L.) HYBRIDS UNDER SALINE SOIL CONDITIONS M.SUDHARANI, P.RAGHAVA REDDY, G.HARIPRASAD REDDY and CH.SURENDRA RAJU Seed <strong>Research</strong> and Technology Centre, Rajendranagar, Hyderabad-500030 Date <strong>of</strong> Receipt : 21.09.2012 Date <strong>of</strong> Acceptance : 09.11.2012 Correlation studies and path coefficient analysis were undertaken to know the inter relationship <strong>of</strong> yield components and physiological parameters related to salt tolerance and their usefulness in selection programmes under salt stress. In the present investigation 28 rice hybrids derived by crossing eight genotypes (RPBio-226, Swarna , CSR-27, CSR-30, CST-7-1, CSRC(S)7-1- 4, SR26-B and CSRC(S)5-2-2-5 in half diallel manner were utilized based on their reaction to salinity tolerance and were evaluated during kharif, 2010 under salt affected soils <strong>of</strong> Agricultural <strong>Research</strong> Station, Machilipatnam. Seedlings <strong>of</strong> 30 days old were transplanted in the main field having electrical conductivity <strong>of</strong> 7.9 dS/m and pH <strong>of</strong> 7.7 following randomized block design with three replications. <strong>The</strong> recommended agronomic, cultural and plant protection measures were followed in conducting the experiment. Genotypic and phenotypic correlation coefficients were calculated among eight parents using the formulae suggested by Al-Jibouri et al. (1958) and their significance was tested by using the ‘r’ table values (Fisher and Yates, 1963) at n-2 degrees <strong>of</strong> freedom, where ‘n’ denotes the number <strong>of</strong> treatments used in the calculation. To estimate the direct and indirect effects <strong>of</strong> the yield components on the yield, the statistical tool employed was path coefficient analysis as suggested by Wright (1921) and illustrated by Dewey and Lu (1959). <strong>The</strong> path coefficients were obtained by solving the ‘p’ normal equations following the matrix method given by Singh and Chowdhary (1985). In the present investigation, the genotypic and phenotypic correlations amongst the traits followed almost similar trend <strong>of</strong> association, the former being a little higher in most <strong>of</strong> the cases, indicating the existence <strong>of</strong> a strong inherent association between the characters. Further, dissecting these associations as direct and indirect effects through path analysis showed direct contribution <strong>of</strong> each component trait on yield and indirect effect it has through association on other component traits. <strong>The</strong> yield component viz., plant height (0.5847), number <strong>of</strong> tillers plant -1 (0.7789), number <strong>of</strong> productive tillers plant -1 (0.5753), panicle length (0.8353), panicle weight (0.5500), number <strong>of</strong> filled grains panicle -1 (0.7809), spikelet fertility per cent (0.7190), 1000-grain weight (0.5399), root/shoot ratio (0.4694) and harvest index (0.8128) were significantly and positively correlated with grain yield (Table 1) in rice hybrids tested under saline conditions. On the other hand Na + /K + ratio and SPAD chlorophyll meter readings exhibited significant negative association with grain yield, while the effect <strong>of</strong> days to 50 per cent flowering was non-significant. <strong>The</strong> findings <strong>of</strong> earlier researchers viz., Bala (2001) for plant height; Zeng and Shannon (2000), Natarajan et al. (2005) for number <strong>of</strong> tillers plant -1 ; Ravindra Babu (1996), Natarajan et al. (2005) for number <strong>of</strong> productive tillers plant -1 ; Bala (2001) for panicle length; Buu and Tuan (1991), Ravindra Babu (1996), Natarajan et al. (2005) for number <strong>of</strong> filled grains panicle -1 ; Natarajan et al. (2005) for 1000-grain weight ; Sajjad (1990) and Balan et al. (1999) for harvest index were in line with the present readings. However, Asch et al. (2000) reported strong negative association <strong>of</strong> Na + /K + ratio with grain yield which is in agreement with the present findings. Under saline soil conditions plant height, number <strong>of</strong> tillers plant -1 , productive tillers plant -1 , panicle length, panicle weight, number <strong>of</strong> filled grains panicle -1 , spikelet fertility per cent, SPAD values and test weight showed strong positive association with grain yield plant -1 under stressed environment. email: madugula.sudharani@yahoo.com 110
SUDHARANI et al Table 1. Genotypic (r g ) and phenotypic (r p ) correlation coefficients among grain yield, its components and physiological traits in F 1 hybrids <strong>of</strong> rice under saline soils * Significant at p=0.05; ** Significant at p=0.01; PH (cm): Plant height; DFF: Days to 50% flowering; TT: Number <strong>of</strong> tillers plant -1 ; PT: Number <strong>of</strong> productive tillers plant -1 ; PL (cm): Panicle length; PW(g): Panicle weight; NFGP -1 : Number <strong>of</strong> filled grains panicle -1 ; SF (%): Spikelet fertility per cent; TW (g): 1000-grain weight; GY (g): Grain yield (g plant -1 ); SES: SES for visual salt injury; RSR: Root /shoot ratio; HI (%): Harvest index per cent; Na + /K + R: Sodium Potassium ratio; SPAD: SPAD chlorophyll meter reading. 111
- Page 1 and 2:
1
- Page 3 and 4:
CONTENTS PART I : PLANT SCIENCE Eff
- Page 5 and 6:
J.Res. ANGRAU 41(1) 1-4, 2013 EFFEC
- Page 7 and 8:
EFFECT OF FOLIAR APPLICATION OF NPK
- Page 9 and 10:
J.Res. ANGRAU 41(1) 5-13, 2013 NUTR
- Page 11 and 12:
NUTRIENT UPTAKE BY RICE CROP UNDER
- Page 13 and 14:
NUTRIENT UPTAKE BY RICE CROP UNDER
- Page 15 and 16:
NUTRIENT UPTAKE BY RICE CROP UNDER
- Page 17 and 18:
NUTRIENT UPTAKE BY RICE CROP UNDER
- Page 19 and 20:
LAKSHMI et al Fig 1. Changes in C/N
- Page 21 and 22:
LAKSHMI et al Changes in C/N ratio
- Page 23 and 24:
LAKSHMI et al Table 3. Changes in h
- Page 25 and 26:
J.Res. ANGRAU 41(1) 20-29, 2013 INF
- Page 27 and 28:
PRASAD and PRASADINI of bulk densit
- Page 29 and 30:
PRASAD and PRASADINI to as high as
- Page 31 and 32:
PRASAD and PRASADINI Table 4 . Infl
- Page 33 and 34:
PRASAD and PRASADINI Table 8. Influ
- Page 35 and 36:
J.Res. ANGRAU 41(1) 30-38, 2013 GEN
- Page 37 and 38:
VEMANNA et al The range in mean val
- Page 39 and 40:
VEMANNA et al grain yield per plant
- Page 41 and 42:
VEMANNA et al 41
- Page 43 and 44:
VEMANNA et al Singh, S. P and Khan,
- Page 45 and 46:
RAMANA et al RESULTS AND DISCUSSION
- Page 47 and 48:
J.Res. ANGRAU 41(1) 42-46, 2013 A S
- Page 49 and 50:
RAJANNA et. al. Table 2. Reasons fo
- Page 51 and 52:
RAJANNA et al the present findings
- Page 53 and 54:
NARASIMHA et al Table 1. Proximate
- Page 55 and 56:
NARASIMHA et al Maynard, L., Lossli
- Page 57 and 58:
RAMANA et al with small follicles m
- Page 59 and 60: RAMANA et al Characteristics of fol
- Page 61 and 62: Research Notes J.Res. ANGRAU 41(1)
- Page 63 and 64: KIRTHY et al Akhtar et al., 2008; S
- Page 65 and 66: KIRTHY et al El Gharras H. 2009. Po
- Page 67 and 68: SANDYARANI et al Weed parameters li
- Page 69 and 70: SANDYARANI et al Table 2. Influence
- Page 71 and 72: Research Notes J.Res. ANGRAU 41(1)
- Page 73 and 74: KUMAR et al Table 2. Effect of seed
- Page 75 and 76: Research Notes J.Res. ANGRAU 41(1)
- Page 77 and 78: DEEPAK et al Table 2 Price spread a
- Page 79 and 80: Research Notes J.Res. ANGRAU 41(1)
- Page 81 and 82: YAMINI et al Table 3. Estimates of
- Page 83 and 84: YAMINI et al coupled with high per
- Page 85 and 86: LOKESH et al Table 1. Clustering pa
- Page 87 and 88: LOKESH et al Table 4. Mean values o
- Page 89 and 90: ABIRAMI et al Socio-economic Impact
- Page 91 and 92: ABIRAMI et al socio-economic impact
- Page 93 and 94: Research Notes J.Res. ANGRAU 41(1)
- Page 95 and 96: VEMANNA et al Table 1. Discriminant
- Page 97 and 98: VEMANNA et al total biomass, fresh
- Page 99 and 100: RAO et al Table 1. Plant height, nu
- Page 101 and 102: Research Notes J.Res. ANGRAU 41(1)
- Page 103 and 104: DEVI et al S.No Category Frequency
- Page 105 and 106: DEVI et al extension contact and ma
- Page 107 and 108: NIRMALA and VASANTHA earliness in a
- Page 109: NIRMALA and VASANTHA adopted this t
- Page 113 and 114: SUDHARANI et al At genotypic level,
- Page 115 and 116: NIRMALA et al weight of pods per pl
- Page 117 and 118: NIRMALA et al Table 3. Cluster mean
- Page 119 and 120: Research Notes J.Res. ANGRAU 41(1)
- Page 121 and 122: Research Notes J.Res. ANGRAU 41(1)
- Page 123 and 124: PUNYAVATHI and VIJAYALAKSHMI 6.5 6.
- Page 125 and 126: PUNYAVATHI and VIJAYALAKSHMI REFERE
- Page 127 and 128: KATTEL et al Table 1. Item Analysis
- Page 129 and 130: Research Notes J.Res. ANGRAU 41(1)
- Page 131 and 132: RADHIKA et al Thus, the results of
- Page 133 and 134: RAJU et al estimated daily dietary
- Page 135 and 136: RAJU et al Table 3. Physico-chemica
- Page 137 and 138: Research Notes J.Res. ANGRAU 41(1)
- Page 139 and 140: MINNIE et al Table 2. Estimates of
- Page 141 and 142: Statement about ownership and other
- Page 143 and 144: GUIDELINES FOR THE PREPARATION OF M
- Page 145: ESSENTIAL REQUIREMENTS FOR CONSIDER