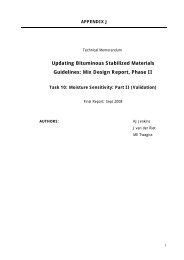
Updating Bituminous Stabilized Materials Guidelines Mix Design Report Phase II
Task 12: Laboratory Compaction - Asphalt Academy
Task 12: Laboratory Compaction - Asphalt Academy

You also want an ePaper? Increase the reach of your titles
YUMPU automatically turns print PDFs into web optimized ePapers that Google loves.
APPENDIX L<br />
Technical Memorandum<br />
<strong>Updating</strong> <strong>Bituminous</strong> <strong>Stabilized</strong> <strong>Materials</strong><br />
<strong>Guidelines</strong>: <strong>Mix</strong> <strong>Design</strong> <strong>Report</strong>, <strong>Phase</strong> <strong>II</strong><br />
Task 12: Laboratory Compaction<br />
AUTHORS:<br />
KJ Jenkins<br />
RWC Kelfkens<br />
1
1. INTRODUCTION<br />
Background<br />
The purpose of this report is to provide results and conclusion as well as any possible recommendations<br />
with regard to an alternative method of compaction of granular material in the laboratory.<br />
In the civil engineering practice, properties of granular materials are tested in various ways, including triaxial<br />
testing, CBR (California Bearing Ratio) etc. Prior to these tests taking place, specimens of material<br />
first have to be prepared. That is to say it has to be compacted into some or other form so that the tests<br />
may be carried out. Samples are typically compacted into a cylindrical form for triaxial tests and into<br />
block form for MMLS type tests i.e. accelerated testing. Laboratory results and experience have shown<br />
that the results of material properties achieved in the laboratory are not as fair and consistent a<br />
representation of the field results as the industry would like. This is believed to be as a result of<br />
laboratory compaction methodologies currently being used.<br />
In the laboratory, compaction procedures include methods such as Mod AASHTO compaction (the<br />
densities achieved in the field are typical measured against the density achieved when using this<br />
compaction method), Marshall Hammer, Gyratory compaction and Vibratory Table compaction etc.<br />
These procedures all have their advantages and disadvantages. The factor affecting the final outcome of<br />
the material properties on site is that on site high amplitude and frequency vibratory compaction is used<br />
as apposed to impact compaction, which influences particle orientation, packing and other factors<br />
Mod AASHTO compaction and Marshall Hammer compaction are both impact compaction methods. Site<br />
compaction is done by means of vibratory compaction. This poses a problem when trying to compare<br />
the properties of the site compacted material to the properties of the laboratory compacted material.<br />
There are various differences in the sample structure when comparing impact and vibratory compaction:<br />
• the arrangement of the material particles is different (i.e. a different skeleton structure),<br />
• there may be a vary clear differences in the void contents of the two compaction methods, and<br />
• the final densities on site may be much higher than that which is achieved in the laboratory<br />
(e.g. site compaction may be as high as 104% of Mod AASHTO compacted density).<br />
Gyratory compaction allows for the particles to be kneaded against each other, thus giving a different<br />
skeletal structure and particle orientation to that of Mod AASHTO and Marshall Hammer compaction as<br />
well as different voids content. This however still differs from the results on site and as a result also<br />
yields different material properties from those achieved on site. According to results from research done<br />
by the CSIR (HL Theyse, 2004), vibratory table compaction provides the best results in terms of<br />
producing the same material properties in the laboratory as those which are obtained on site. The<br />
2
skeleton structure and voids content are more similar than that of the other compaction methodologies<br />
when compared to site compacted material.<br />
As a result of the inconsistencies occurring between the field and laboratory properties of the compacted<br />
material, it was proposed that an alternative compaction method be identified and researched, one that<br />
would allow field compaction results to be simulated a closely as possible in the laboratory. Feedback<br />
received during the launch of TG2 (Technical <strong>Guidelines</strong> 2) (2002) indicated that vibratory compaction<br />
could provide a possible alternative. The research of the viability of the compaction method was to be<br />
assigned to a student at master’s level.<br />
Objectives<br />
The objectives of the research were as follows:<br />
1. Identify an appropriate refusal density compaction procedure, similar to the one currently used<br />
internationally e.g. in the United Kingdom (UK) on asphalt material, that can possibly be adapted to<br />
compaction of Bitumen Stabilised <strong>Materials</strong> (BSMs) in South Africa. At the same time identify the<br />
different compaction requirements of BSMs relative to HMA.<br />
2. Investigate refusal density compaction procedure for BSMs, i.e. bitumen emulsion and foamed<br />
bitumen stabilised material.<br />
3. Establish a correlation between the refusal density compaction procedure and Mod AASHTO in order<br />
to provide a reliable link to field densities.<br />
4. To enable the compaction of a specimen of 150mm diameter and 300mm height for use in triaxialtype<br />
testing. Currently specimens of this diameter can only be produced to a height of 125mm.<br />
5. Establish a compaction protocol for the refusal density compaction method<br />
Layout of the report<br />
The report begins with an executive summary of the research, followed by Section 1, the<br />
Introduction. In the introduction, background to the research is given as well as providing the<br />
objectives and giving a brief layout of the structure of the report. Section 2 follows which is the<br />
Literature Study. Here a summary of various literatures that was studied for background on<br />
materials and compaction methods is made. This is followed by Section 3, the Methodology.<br />
This chapter explains how the various objectives will be achieved. Section 4 then provides the<br />
results, which include statistical results, of the experiments performed and provides for the<br />
interpretation of these results. Conclusion and Recommendations are then made in Sections 5<br />
and 6 respectively, with Section 7 providing all references.<br />
3
2. LITERATURE STUDY<br />
This Section of the report will look at various pieces of literature regarding compaction.<br />
Literature on foamed and emulsion mixes will also be addressed and the respective properties<br />
of both bitumen emulsion and foamed bitumen i.e. the material properties of the bitumen<br />
emulsion and foamed bitumen as well as the effect these two cold mixes have on the material<br />
properties of granular materials.<br />
Emulsion<br />
There are three main types of emulsion (US Patent, 2002):<br />
1. Cationic emulsions: surfactants are constituted by polar molecules; formula RNH3 + X - . R<br />
is the hydrocarbon chain which constitutes the lipophilic portion of the molecule. NH3 + is<br />
the hydrophilic portion and X - is any anion from a strong acid.<br />
2. Anionic emulsions: the general formula is R--Y-- C + . R is the hydrocarbon chain which<br />
constitutes the lipophilic portion. The hydrophilic chain is given by Y - C + . Y- is a<br />
carboxylic, sulphonic, sulphuric, phsphonic or phosphoric group. C+ is a metal cat-ion,<br />
often alkaline or ammonium.<br />
3. Non-ionic emulsions: In this type of emulsion, surfactants are constituted by the R--<br />
(EO) n –OH molecule type. R is again the hydrocarbon chain which constitutes the<br />
lipophilic portion of the molecule. The hydrophilic portion is constituted by the (EO) n –<br />
OH radical; EO represents Ethylene Oxide.<br />
Typically either an anionic or cationic bitumen emulsion is used.<br />
Emulsion mixes are used in the base layer of the pavement structure as well as for a surfacing<br />
course (Miller Group et al, 2004). The application rates of the emulsion mix vary from 50mm to<br />
200mm.<br />
Binder within the BSM-Emulsion coats the smaller particles selectively and the stiffness of the<br />
emulsion mix is less than that of the hot mix asphalt. For BSM-Emulsion voids range between<br />
12% and 15% where in the open grade emulsion mixes it varies between 20% and 30%. The<br />
surface of an emulsion mix is also relatively fragile when it is compared to the surface of Hot<br />
mix Asphalt. Waterproofing is not provided for in unsealed emulsion mixes and the surface<br />
cohesion may also not be sufficient to withstand tangent stresses. The sealing of the surface of<br />
4
unsealed emulsion mixes provides waterproofing and the inherent performance of the emulsion<br />
mix is not compromised in terms of premature stripping, oxidation and ravelling.<br />
Foam<br />
Mr. KM Muthen of the CSIR shows the following advantages of foam mixes in the Contract<br />
<strong>Report</strong> CR-98/077 (1998).<br />
Foam binder increases the shear strength properties of the treated material; it also reduces the<br />
moisture susceptibility of granular materials. In foamed bitumen stabilized material (BSM-foam)<br />
the strength properties approach those of cemented material, the BSM-foam is however flexible<br />
and fatigue resistant.<br />
When compared to other cold mix processes, foam treatment material can be used with a wider<br />
range of aggregate types. There is a saving in time, because foamed mixes may be compacted<br />
immediately and may carry traffic almost directly after compaction. Energy is also conserved<br />
because the aggregates remain cold while only the bitumen is heated. Curing of foam mixes<br />
does not result in the release of volatiles; therefore environmental side-effects are avoided.<br />
Usual time constraints for achieving compaction, shaping and finishing of the layers are also<br />
avoided. This is because foam mixes remain workable for extended periods of time. Foamed<br />
mixes may also be stockpiled without the risk of binder runoff and leeching. The last advantage<br />
listed is that the foam mixes may be constructed in adverse weather conditions such as cold<br />
weather or light rain, this is because the workability or quality of the finished layer is not really<br />
affected.<br />
5
Compaction of Emulsion and Foamed BSMs<br />
Some of the early investigations into the compactability of BSMs were carried out at<br />
Stellenbosch University by Weston (1998), where he investigated Marshall, Mod AASHTO,<br />
Gyratory and roller compaction of foamed mixes.<br />
The CSIR also performed compaction experimentation on both BSM-foam and BSM-emulsion to<br />
determine the compactability of the types of mixes (Theyse, 2004). They used three methods of<br />
compaction i.e. Mod AASHTO, Gyratory and vibratory compaction. They found that there<br />
appears to be some logic governing the compaction of material but the rules seem to change<br />
from situation to situation. Factors such as the nature of the aggregate (grading and Atterberg<br />
Limits) compaction method, the type of bituminous binder (foam or emulsion) as well as the<br />
filler types used and filler contents all seem to have an effect. These factors, state the CSIR,<br />
make it very difficult to formulate a set of consistent guidelines that will ensure that the most<br />
appropriate compaction equipment, binder type, filler type and binder and filler content levels<br />
are achieved and are used.<br />
The CSIR also found that the difference between the grading and Atterberg Limits of the<br />
materials used in the investigation resulted in different optimal compaction methods for the<br />
different materials. One of the materials (Crushed hornfels) had a continuous grading and a low<br />
PI, this material was more conducive to vibratory table compaction. The other material, the<br />
decomposed granite, had a more uniform grading and it was more conducive to gyratory<br />
compaction. It is postulated that it may be because the crushed hornfels may have insufficient<br />
fines to form a paste in which the larger particles are suspended, orientated and moulded<br />
during compaction.<br />
During the CSIR’s investigation some observations were made. They are as follows:<br />
Compaction of Crushed hornfels using Vibratory Table compaction<br />
• When low to intermediate emulsion contents (below 1.5 %) were used without filler, there<br />
was a strong positive effect on the compaction of the crushed hornfels.<br />
• Where cement was used in combination with emulsion, there was a negative effect on the<br />
compaction of the crushed hornfels.<br />
• When cement was used in combination with foamed bitumen, there was no effect on the<br />
compaction of the material.<br />
Compaction of crushed Hornfels using Mod AASHTO compaction<br />
• The use of cement and fly-ash alone had a negative effect on the compaction of the material.<br />
Significant minimums occurred in the filled volume and volume of solids in the samples<br />
containing either 1 percentage fly ash or 1 percent cement.<br />
6
• Where the binder content was increased, there was a negative effect for both BSM-foam and<br />
BSM-emulsion. This negative effect was on the volume of solids; here significant reductions<br />
took place at the highest binder contents for both BSM-emulsion and BSM-foam.<br />
• When filler was used in combination with foam, there was a reduction in the negative effect<br />
of increasing the binder content mentioned above. The effect of adding filler to the BSMemulsion<br />
was found to be insignificant, only the individual effects of the binder and filler<br />
were reflected in the case of the BSM-emulsion.<br />
Compaction of Gauteng granite (decomposed Granite) using Vibratory Table compaction<br />
• When the binder contents were increased, using both foam and emulsion, there was a slight<br />
negative effect on the compaction in terms of the volume of solids.<br />
Compaction of Gauteng granite (decomposed Granite) using Mod AASHTO compaction<br />
• In the case of both cement and fly-ash, there was no discernable influence on the<br />
compaction;<br />
• Emulsion and foam both had the same negative impact in terms of a decrease in volume of<br />
solids with an increase in binder content.<br />
When looking at the vibratory compaction of the crushed Hornfels, the CSIR noted that the<br />
intermediate percentage of emulsified bitumen acted as a compaction lubricant, this was in<br />
terms of both volume filled and volume of solids results.<br />
This benefit of the lubricant was not found when using Mod AASHTO or Gyratory compaction.<br />
The vibratory type of compaction is, however, the preferred compaction method for this type of<br />
material; this in both the laboratory and in the field compaction. Emulsified bitumen at low to<br />
intermediate binder content levels (
The CSIR stated that there may be other considerations in favour of adding bituminous binder.<br />
Such considerations as to the improvement of the workability of an old crushed stone base<br />
layer that is being recycled, the retention of the fines in the layer in the long-term, and/or<br />
improving the water resistance of the material may be looked at when adding bituminous<br />
binder.<br />
The CSIR also noted that there was a definite benefit in using foam or emulsion in combination<br />
with cement. They state that the UCS and ITS requirements of the TG2 document could be<br />
achieved using these bituminous binders in combination with cement.<br />
From the validation phase of their research the effect of aggregate grading on the compaction<br />
of the material was again confirmed. They indicate that it is not only the deviation of the<br />
grading from the maximum density grading curve that determines the level of density that is<br />
achieved but also the grading of the material. The grading determines the preference of the<br />
material in terms of the type of compaction that will result in the highest possible density being<br />
achieved<br />
Comparison of different compaction methods using X-ray Computer Tomography<br />
(CT)<br />
In report No. 113/12 (EMPA No. FE 840544), March 2002 EMPA performed research to compare<br />
the difference in compaction methods using X-ray Computer Tomography (CT). The change<br />
that takes place as well as the difference in homogeneity & isotropy in asphalt concrete was<br />
examined, using the same mix but with different compaction methods.<br />
Three methods of compaction were used during this research: a) Marshall compaction, b)<br />
Gyratory compaction and c) LCPC Rolling wheel compaction. The investigation was carried out<br />
using the standard Air Void content determination (AV) and X-ray CT.<br />
Under the gyratory compaction it was found that the material loses heat in the centre (2 0 C) and<br />
where it is in contact with the outside walls of the mould (10 0 C). Although heat is lost in the<br />
centre of the specimen it was found that after the compaction the temperature in the centre<br />
was 5 0 C higher than the temperature of the material near the top or bottom of the specimen.<br />
The results of the gyratory compaction showed that the material had a tendency to flow radially<br />
towards the side of the specimen. Under Marshall Compaction the pins used in the X-ray CT test<br />
did not move significantly in the horizontal plane, however, a few of the pins showed a slight<br />
tendency to move away radially, indicating that the material, during compaction is squeezed to<br />
the side. The air void content under the gyratory compaction was in some cases found to be<br />
8
negative where the Marshall compaction gives a rather even air void distribution in the vertical<br />
direction, the bottom core pieces however have a slightly higher void content. EMPA noted the<br />
after 20 blows the difference in air void content using Marshall Compaction almost vanishes.<br />
The results from the three compaction methods showed that none of the compaction processes<br />
was able to produce homogeneous asphalt concrete specimens. Structurally different specimens<br />
are produced; therefore, state EMPA, there is no reason to expect these methods to produce<br />
specimens comparable to real life or to be used on alternate bases.<br />
Vibratory Compaction<br />
In the Example Paper: One-Point Vibrating Hammer Compaction Test for Granular Soils, Adam<br />
B. Prochaska and Vincent P. Drnevich (2005) show that there is great promise for the use of<br />
vibratory hammer compaction for the preparation of samples in the laboratory. They state that<br />
a One-Point Vibrating Hammer test on an oven dried sample will provide the maximum dry unit<br />
weight of the material and moisture content range for effective field compaction of granular<br />
soils. The results from this procedure were found to produce consistent and reproducible<br />
results. The test method is also applicable to a broader range of material than current vibratory<br />
table tests. The test results from the compaction of sandy soils indicated that the values for the<br />
dry unit weight in the densest condition are comparable to that obtained from the vibratory<br />
table tests.<br />
Mr. Thorsten Frobel of Fulton Hogan Ltd. in New Zealand provided information on the vibratory<br />
hammer compaction method used in New Zealand. In New Zealand the Mod AASHTO<br />
compaction procedure has been replaced by the Vibratory Hammer compaction test. The reason<br />
for this is that New Zealand has fairly soft aggregates, and the heavy dynamic compaction of<br />
the Mod AASHTO compaction method causes a change in the grading and this intern influences<br />
the Maximum Dry Density (MDD) and Optimum Moisture Content (OMC) significantly. The<br />
Vibratory Hammer compaction is used to specify the MDD and this is used to specify the target<br />
Dry Density for site. In the case of unbound granular materials no adjustment needs to be<br />
made to the target Dry Density, but in the case of stabilized material a correction needs to be<br />
made, therefore a sample is usually taken and compacted, either in the lab or on site at that<br />
moisture content so as to get an idea of the shift; the unbound pavement layer specification of<br />
New Zealand does however call for plateau testing. The New Zealand Specifications (TNZ,<br />
2005) provide target compaction levels for two site types:<br />
1. Greenfield sites<br />
The target Dry Density is quoted as: “The Maximum Dry Density (MDD) for<br />
construction shall be the higher of the maximum laboratory dry density at<br />
optimum water content (OWC) and the plateau density at optimum water<br />
content (OWC).”<br />
9
Note that in New Zealand the term OWC is the same as the term OMC used in<br />
South Africa.<br />
2. Overlay sites<br />
The target Dry Density is quoted as: “The Maximum Dry Density (MDD) for<br />
construction shall be the maximum laboratory dry density at optimum water<br />
content (OWC).”<br />
These compaction levels are expressed as percentage of the MDD achieved using the vibrating<br />
hammer, these levels are provided in table L. Lit 1 (TNZ, 2005).<br />
Table L. Lit 1: Mean an Minimum Level of Compaction of Pavement Layers as %MDD<br />
of Vibrating Hammer<br />
Values Sub-basecourse Pavement<br />
Layers<br />
Basecourse Pavement<br />
Layer<br />
Mean Value ≥ 95% ≥ 98%<br />
Minimum Value ≥ 92% ≥ 95%<br />
These compaction levels in table L. Lit1 are checked by testing five (5) randomly selected areas<br />
on site with a frequency of one (1) MDD per 5000m 3 of material laid. Should the tested areas<br />
conform to the criterion in table L. Lit 1 the compaction levels are accepted (TNZ, 2005).<br />
The samples prepared in New Zealand are also used for UCS testing; this is in the case of<br />
stabilized material samples. The procedure followed by the New Zealanders is briefly outlined<br />
below; this is taken from NZS 4402: 1986 Test 4.1.3.<br />
• Hammer Specifications<br />
o Frequency = 25 to 60 blows per minute<br />
o Rating = 60 to 1200 Watt power consumption<br />
o Mass of Loading Frame + hammer and Downward Force = 300N ± 50N.<br />
The Hammer may also be operated manually by experienced personnel<br />
provided the hammer is held in an upright position and that the total<br />
downward force is also in the order of 300N ± 50N. For inexperienced<br />
personnel the hammer may be placed on a scale and a downward force be<br />
applied till the scale reads 30 or 40kg; this is done prior to compaction while<br />
the machine is switched off.<br />
o Foot Piece Diameter = 145mm<br />
• Mould Specifications<br />
10
o<br />
o<br />
o<br />
Non-corrodible cylindrical metal mould = 152mm ± 0.5mm inside Diameter<br />
A Metal Spacer = 150mm ± 0.5mm diameter. This is placed inside the<br />
mould prior to compaction.<br />
Final specimen height = 125 to 127mm high.<br />
• Compaction Procedure<br />
o Mass of Material used for a sample = 5.5 kg<br />
o Assess the moisture contents required for the compaction. Adjust these<br />
content so that there are different moisture contents across the samples<br />
which span the OMC with in the required range.<br />
o Compaction time = 180sec ± 10sec per layer.<br />
o Number of layers compacted per sample = 2 layers<br />
The procedure described above is the procedure used to determine the Dry Density vs.<br />
Moisture content curve and the graphic image of the mounted hammer is shown on the<br />
following page in figure L.A: Mounting of vibrating hammer for the New Zealand vibrating<br />
hammer compaction procedure. There is also a procedure developed to determine whether<br />
or not the hammer which is being used is adequate. This is as follows:<br />
• A 10kg sample of Leighton Buzzard silica sand is taken, of which at least 75%<br />
passes the 600μm test sieve. The coarse fraction is discarded. Sufficient water is<br />
mixed with the sand finer than 600μm to raise the moisture content to 25% ± 5%.<br />
The material is compacted according to the procedure described above, excluding<br />
varying moisture contents, for a total of three samples, the mean Dry Density is<br />
then determined. If the mean Dry Density of the sand exceeds 1.74 t/m 3 the<br />
hammer may be considered suitable for the compaction procedure.<br />
11
Figure L. Lit 1: Mounting of vibrating hammer for the New<br />
Zealand vibrating hammer compaction procedure<br />
12
In 2007 ASTM published a standard test method for the vibratory hammer, this is found in<br />
ASTM D7328-07. The procedure followed differs from the procedure developed and followed by<br />
the New Zealanders. The procedure described in ASTM D7328-07 has two methods, the first<br />
(method A) uses a mould of 152.4mm diameter and the second procedure (method B) uses a<br />
mould of 279.4mm diameter. For purposes of this research method B of this procedure may be<br />
ignored. The procedure described in method A is as follows:<br />
• Hammer Specifications<br />
o Frequency = 3200 to 3500 beats per minute<br />
o Impact energy (manufacturers rating) = 9.5 to 12 Joule<br />
o Weight of hammer = 53 to 89N excluding the weight of the tamper. A list of<br />
potential hammers and their characteristics are provided by the ASTM and is<br />
shown in table L. Lit 1 below:<br />
Table L. Lit 2: Potential vibratory hammers for ASTM vibratory hammer compaction<br />
procedure<br />
Bosch<br />
11248EVS<br />
Bosch<br />
11318EVS<br />
Milwaukee<br />
5327-21<br />
Milwaukee<br />
5336-22<br />
Volts 120 120 120 120<br />
Amps 11 11 11 13<br />
Beats/min 1700-3300 1300-3300 3400 1300-3450<br />
Hz 28-55 22-55 57 22-58<br />
Impact Energy (J) 10 12 11 12<br />
Length (cm) 46 45 44 47<br />
Weight (N) 14.4 12.5 12.9 15<br />
13
• Hammer Frame Specifications<br />
o The frame shall have a metal clamp assembly to firmly hold the vibrating<br />
hammer that moves on guide rods that allows for free vertical movement.<br />
The guide rods are fastened to a metal base so as to keep them vertical and<br />
parallel.<br />
o The frame is designed to securely hold the vibrating hammer and clamp<br />
assembly in a vertical position during the removal and insertion of the<br />
mould.<br />
o The total applied surcharge of the clamp assembly + the vibrating hammer<br />
and tamper shall be 19.3kPa ± 0.7 kPa.<br />
The figures below were taken from ASTM D 7382 – 07 and the dimensions<br />
shown are in inches.<br />
Pins and/or clamps will be<br />
needed to secure the<br />
clamp assembly, vibrating<br />
hammer, and tamper<br />
above the mould to allow<br />
inserting the mould,<br />
adding soil to the mould,<br />
and removing the mould.<br />
Metal clamp Assembly<br />
Figure L. Lit 2: Mounting frame for ASTM vibrating hammer compaction<br />
14
Figure L. Lit 3: Metal clamp assembly to firmly hold the vibrating hammer<br />
• Mould Specifications<br />
o Cylindrical mould made of rigid metal<br />
o Average inside diameter = 152.4mm ± 0.7mm.<br />
o Height = 116.4mm ± 0.5mm.<br />
o Volume = 2124 ± 25cm 3 .<br />
• Compaction Procedure<br />
o Material passing the 19mm sieve shall be used for the preparation of<br />
samples.<br />
o Samples are compacted in three layers.<br />
o A compaction time of 60sec ± 5sec per layer is used to compact each layer.<br />
The ASTM also has a procedure in order to check the suitability of a vibratory hammer for the compaction<br />
process. This procedure is in some ways similar to the New Zealand procedure for checking the suitability of<br />
a vibratory hammer. The procedure is as follows:<br />
• Standard sand shall be tested and is to conform to the requirements for 20-30 sand. These<br />
specifications are found in the ASTM specifications C778. Before the test is performed the<br />
material should be stored in such a way that freezing and/or contamination does not occur,<br />
if the material was previously used it should not be re-used. A required dry specimen mass<br />
of 7kg is required and must have a moist mass of at least 9kg. A representative sample<br />
meeting this specification is selected using a riffler or splitter or any such method quartering<br />
included. The vibratory hammer and mould (152mm diameter mould) are then prepared.<br />
The sand is then compacted according to method A described above. After compaction the<br />
Dry Density is calculated and should the sample meet or exceed a dry density of 1.76<br />
ton/m 3 (17.29 kN/m 3 ) then the vibratory hammer may accepted as having sufficient energy.<br />
15
Critical comments on the Literature<br />
In terms of the purpose of this research the procedure used in New Zealand is not an adequate procedure<br />
from which to work. The compaction time of 180 seconds per layer is long, although the samples may be<br />
reaching very high Dry Densities the coarse aggregate materials used in New Zealand are of a soft quality, it<br />
is as a result of this that New Zealand has moved away from the Mod AASHTO compaction method and<br />
adopted the vibrating hammer compaction method.<br />
The compaction method used by New Zealand does serve well in that it shows that the vibratory hammer<br />
compaction may be used to specify field densities as well as moisture levels in the field.<br />
The ASTM method for vibratory hammer compaction appears to be a newly developed method as it was only<br />
published toward the end of 2007. This procedure serves well to show what level of compaction time per<br />
layer may be necessary when preparing samples. It also helps identify what the total mass (i.e. all<br />
components of the set up; hammer, foot piece, mounting head etc.) of the set up should be. The ASTM<br />
methods identify a total mass of ±34kg; the New Zealand method identifies a total mass of 30-40kg. Both<br />
these masses are similar to the procedure followed in the British Standards (this method is discussed in sub<br />
section 3.1.2 of the methodology section), which shows a mass also in the order of 35kg ± 5kg. This is a<br />
good indication of what the order of the total mass of the vibratory hammer set up should be for our<br />
research. The total masses of New Zealand and the United Kingdom compaction procedure include the force<br />
applied by an operator, which shows what the mass of an applied dead load should be in order to achieve a<br />
total mass of ± 30kg, this is beneficial as less physical labour is needed by the operator to compact the<br />
material if a surcharge load is applied.<br />
From the literature on the ASTM vibratory hammer compaction method and the New Zealand compaction<br />
method a table analyzing the compaction energies was set up.<br />
Table L.Lit 3: Comparison of Total Compaction Energy –<br />
New Zealand vs. ASTM (Bosch 11248EVS)<br />
Vibratory Hammer Lower Limit (kJ) Upper Limit (kJ)<br />
New Zealand 63 151.2<br />
Bosch 11248EVS® 51 99<br />
Table L.Lit 4: Comparison of Average Compaction Energy per Layer –<br />
New Zealand vs. ASTM (Bosch 11248EVS)<br />
Vibratory Hammer Lower Limit (kJ) Upper Limit (kJ)<br />
New Zealand 31.5 75.6<br />
Bosch 11248EVS® 17 33<br />
16
The New Zealand specifications do not clearly state what the order of the impact energy should be, however<br />
by noting that the frequency of 25 to 60 blows per second (1500 to 3600 blows per minute) is similar to the<br />
ASTM standard of 3200 to 3500 blows per minute, which provides an impact energy of 9.5 to 12 Joule, a<br />
rough estimate of 7 Joule impact energy was made. The upper limit and lower limit indicate the range in<br />
which the energy should be. The ASTM method does show a lower impact energy both in terms of the total<br />
and per layer energy used, but this is due to the fact that compaction time is only 60 seconds, i.e. 1/3 of the<br />
New Zealand procedure. This shows that a higher point energy (energy per blow) may require less total<br />
energy to compact the sample, i.e. for a higher point energy less compaction time per layer is need to<br />
compact a sample and hence less total energy.<br />
17
3. METHODOLOGY<br />
3.1 COMPACTION<br />
This chapter provides a description of the methodologies used and followed in order to perform<br />
the required experimentation so as to determine the viability of the vibratory hammer as a<br />
means of compacting Granular materials in the laboratory. For this methodology either a clean<br />
untreated G1 or G2 material could be used to perform the experiments, both these materials<br />
are a good quality granular material used in the base course of pavements. Material would also<br />
be collect form site and this site material would be used to establish a correlation between the<br />
compaction of material in the laboratory and the compaction on site. A G2 material was finally<br />
taken; the fact that fine material from a source other than the parent rock could be added to a<br />
G2 quality material seemed more adequate because the material being taken from the site<br />
would have material present that was not from the original material itself. Two and three tests<br />
would be performed for a single experiment and the experiments were measured against the<br />
Mod AASHTO compaction method. Three experiments were typically done as this accounted for<br />
the variability of the results better than what two experiments would have. Two mix conditions<br />
were studied i.e. BSM-emulsion and BSM-foam. Under both mix conditions the moisture content<br />
of the material, the surcharge load on the vibratory hammer and the temperature of the<br />
material were the conditions under which the compaction experimentation would take place.<br />
These conditions were chosen as they are all factors which affect the compaction of granular<br />
materials. Under the conditions of moisture variation and surcharge load variation experiments<br />
were performed using time as measure to obtain both density equal to the Mod AASHTO<br />
density of the material at specific moisture content (100% Mod AASHTO) and the material’s<br />
refusal density. From these results a fixed moisture content and fixed dead load were decided<br />
on and the time to 100%Mod AASHTO was taken and experimentation on the material under<br />
varying temperature conditions was carried out as well as the correlation experiments. The<br />
results obtained from the experimentation were then compared to the results of vibratory table<br />
compaction, excluding the correlation experiment results. A full flow chart of the experimental<br />
design is provided for under the results section of this report.<br />
3.1.1 Mod AASHTO<br />
Mod AASHTO compaction is the compaction method against which the vibratory<br />
hammer will be referenced. That is to say all results will be measured relative to<br />
Mod AASHTO densities.<br />
18
3.1.2 Vibratory Hammer<br />
3.1.2.1 Existing Procedures<br />
United Kingdom (UK)<br />
In the UK a compaction procedure for the vibratory hammer has already<br />
been developed, this can be found in BSEN12697-32-2003. The procedure<br />
is as follows:<br />
1. The vibrating hammer is fitted with a circular steel tamper of 146<br />
mm diameter<br />
2. Each layer is compacted for a period of 60 seconds ± 2s.<br />
3. During compaction a firm downward force is applied so that the<br />
resulting force (which includes the mass of the hammer is 350N ±<br />
50N.<br />
4. It is recommended that for inexperienced persons, that the hammer<br />
is placed on a scale and a downward force be applied till a reading of<br />
35kg ± 5kg be achieved. This gives an indication of how force is<br />
needed to be applied by the person during compaction<br />
Comment: The tolerance of 50kN allowed for the applied downward force is<br />
very lenient. The result is that there is a large variability of the achieved<br />
densities.<br />
Delft University of Technology (TU Delft)<br />
TU Delft in the Netherlands also developed a compaction procedure regarding<br />
the vibratory hammer, refer PhD. Student Patrick Muraya. The procedure<br />
followed is long; therefore only a basic description of the procedure followed<br />
at TU Delft is provided here:<br />
1. The exact mass of material of each layer is weighed off.<br />
2. The thickness to which the layer will be compacted is also<br />
determined.<br />
3. The mass of material is then poured into the mould, not spilling any<br />
material.<br />
4. The compacting unit is then set up accordingly. The height adjusting<br />
rings are loosened and the compacting bar is lowered till it touches<br />
the material. The material is first compacted by hand (8 blows). The<br />
19
height adjusting rings are then fastened X mm down from the nylon<br />
rings – X being the calculated thickness of the layer.<br />
5. The hammer is then turned on and a small amount of pressure is<br />
applied till the nylon rings meet the height adjusting rings - i.e. the<br />
height of the layer is achieved.<br />
6. The surface is then roughened (scarified) up using a bar with a<br />
rounded head and the next layer is added and compacted in the same<br />
way. This is done until compaction of the sample is completed.<br />
Figure 1 below shows a visual of the compaction set up at TU Delft.<br />
Vibratory<br />
Hammer<br />
Nylon Ring<br />
Compacting<br />
Bar<br />
Adjusting Ring<br />
Figure L.1: Compaction set up at TU Delft<br />
20
3.1.2.2 Kango 637 ®<br />
Figure L.2A: Kango 637®_Vibratory Hammer<br />
The Kango 637 ® Vibratory Hammer was the first Vibratory Hammer that was tested in South<br />
Africa. Its technical specifications are provided in the table below:<br />
Table L.1: Technical details of Kango 637®<br />
Hammer<br />
Rated power<br />
Impact<br />
Impact rate at<br />
Frequency<br />
Weight<br />
input<br />
energy<br />
rated speed<br />
Kango 637 750 W uncertain 2750 1/min 45.83 Hz 7.5 kg<br />
21
3.1.2.3 Bosch GSH 11E ®<br />
During the course of experimentation, the Kango 637 ® experienced<br />
technical difficulties and as a result became unusable. The replacement part<br />
for the hammer could not be located in South Africa and hence a new<br />
hammer was purchased, the Bosch GSH 11E. Figure 2 below shows the<br />
Bosch GSH 11E<br />
Figure L.2B: Bosch GSH 11E ® Vibratory Hammer<br />
Replacement of the Kango Hammer 637 ® during the research became<br />
necessary due to the fact that it is no longer supported with parts and back<br />
up service in South Africa; therefore adjustments had to be made for the<br />
new implement i.e. the Bosch Hammer.<br />
A comparison of the Kango 637 ® and Bosch GSH 11E ® technical<br />
specifications are provided below:<br />
Table L.2: Comparison between Bosch GSH 11E® hammer and Kango 637®<br />
Hammer<br />
Rated power<br />
input<br />
Impact<br />
energy<br />
Impact rate<br />
at rated speed<br />
Frequency Weight<br />
Kango<br />
637<br />
Bosch<br />
GSH 11E<br />
750 W uncertain 2750 1/min 45.83 Hz 7.5 kg<br />
1500 W 6-25 J 900 – 1890<br />
1/min<br />
15 – 31.5<br />
Hz<br />
10.1 kg<br />
22
3.1.3 <strong>Design</strong> of the mounting frame for the vibratory hammer<br />
3.1.3.1 Kango 637 ®<br />
With the aid of technical/mechanical support at the University of<br />
Stellenbosch i.e. Mr Johan Muller, a mounting system for the Kango 637®<br />
was developed. Below is given a schematic of the frame as well as figures<br />
of the constructed frame<br />
Figure L.3: Top view of mounting frame for Kango Hammer ®<br />
23
Figure L.4: Front view of the mounting frame for Kango Hammer ®<br />
Figure L.5: Front view of mounting frame for Kango Hammer ®<br />
24
Figure L.6: Left view of<br />
Figure L.7: Rear view of mounting<br />
mounting frame frame for Kango Hammer ®<br />
Figure L.8: Full view of the frame for Kango Hammer ®<br />
25
3.1.3.2 Bosch GSH 11E ®<br />
The mounting frame designed for the Bosch GSH 11E was effectively a<br />
modification of the existing Kango frame. The mounting head which is<br />
attached to the hammer was modified. This modification design was<br />
developed and executed by the workshop at the University of Stellenbosch<br />
Civil Engineering Department. This modification was necessary due to the<br />
fact that the size and shape of the Bosch GSH 11E® differs from that of the<br />
Kango 637®. The design appears a follows:<br />
Positioning of dead<br />
weight<br />
Rubber fitting<br />
127<br />
Sleeve<br />
113<br />
Sleeve<br />
112<br />
870<br />
64<br />
50<br />
Figure L.9: Schematic of the mounting head of the Bosch GSH 11E ®<br />
In both the original design and the modified deign, rubber was placed between the areas<br />
where the steel plates of the frame come into contact with the vibratory hammer. Due to the<br />
vibratory effect, the steel is constantly vibrating against the hammer; this could easily result<br />
in damages to the hammer. The rubber insertions protect the hammer from these damages.<br />
26
Figure L.10: Front view of Bosch<br />
mounting<br />
Figure L.11: Rear view of Bosch<br />
mounting<br />
Figure L.12: Left view of Bosch mounting head<br />
Figure L.13: Full view of<br />
mounting head<br />
3.1.3.3 Modifications to mounting system<br />
Further modifications were later made to the rods and base. A frame was<br />
designed by Mr. Dion Viljoen of Stellenbosch University Civil Engineering<br />
workshop in order to better stabilize the entire system. A pulley system was<br />
also fixed to the mounting head and frame to minimize the labour intensity<br />
of the compaction operation.<br />
During experimentation, questions regarding the mounting system arose.<br />
Specifically, how accurately are measurements being taken and how<br />
perpendicular is the footplate to the material mould when compacting. In<br />
27
addition, after one layer of the specimen had been compacted, the hammer<br />
would be physically raised and removed from the rods. When the next layer<br />
was ready to be compacted, the hammer was then placed on the steel rods<br />
and physically lowered into position. This raises an issue concerning the<br />
amount of physical effort and time needed to raise and lower the hammer.<br />
The modifications stated in the first paragraph of this subsection (3.1.3.3)<br />
addressed these questions.<br />
The pulley system allows the vibratory hammer to be raised with less<br />
physical effort and allows it to be suspended once raised, so as to allow<br />
preparation of the next layer. This results in the hammer never being<br />
removed from the vertical shafts, whilst material for an additional layer is<br />
added. The hammer may then be lowered onto the material and<br />
compaction may commence. Furthermore, the stabilized frame results in<br />
less “wobble effect” of the mounting head thus more consistent and<br />
accurate readings may be taken and the hammer is more perpendicular<br />
during compaction.<br />
Figure L.14: Bottom of pulley<br />
Figure L.15: Top of Pulley<br />
Stability frame<br />
Position where guides<br />
are fastened to the<br />
Figure L.16: Left view of Stabilizing Frame<br />
Figure L.17: Front view of Stabilizing Frame<br />
28
Mounted guide<br />
Figure L.18: Pulley system Figure L.19: Wooden base and mounted Figure L.20:<br />
guide<br />
Suspended Bosch<br />
Vibratory hammer<br />
3.1.4 Vibratory table<br />
For both BSM-foam and BSM-emulsion an experiment using the vibratory table was<br />
to be done. The standard procedure for the vibratory table compaction method is<br />
found in the TMH 1: Revised Addition (1990). The specifications of the TMH 1<br />
vibratory table compaction method are amplitude of 0.5mm, a frequency of 50Hz, a<br />
dead load surcharge of 50kg and a compaction time of 120sec (2min); for the<br />
purposes of this research compaction was done until the layer being compacted<br />
reached a layer thickness of 60mm. Measuring from the foot piece up, markings<br />
were made at intervals of 60mm and were labelled layer 1 through to layer 5, these<br />
markings are shown in figure L.21B. While the sample was compacted the operator<br />
watched to see at what point in time the marking, for the layer being compacted,<br />
become level with the top of the mould (not the extension piece). A steel rule was<br />
then placed across the top of the mould with the surcharge still inside the mould to<br />
verify that the marking for the respective layer was in fact level with the top of the<br />
mould (image on the right in figure L.21B); this was done for layer 1 through 4. An<br />
extension piece was fitted to the mould prior to compacting layer 5 but no marking<br />
was made for layer 5 on the surcharge; this was because the operator physically<br />
held the surcharge in place and could see when the footing of the surcharge<br />
reached the top of the mould.<br />
The compaction time to 100% Mod AASHTO density of the vibratory hammer was to<br />
be measured against the compaction time to 100% Mod AASHTO density using the<br />
vibratory table.<br />
29
Three (3) samples were prepared for each mix (BSM-emulsion and BSM-foam) and<br />
again the moisture content was decided on and the target dry density was obtained<br />
from that; using the Mod AASHTO curves initially set up for each mix. The samples<br />
were then compacted till a layer thickness of 60mm was achieved and the time<br />
noted. The results from the experiment were then compared to the results of the<br />
vibratory hammer.<br />
50 kg dead load<br />
300mm x 150mm<br />
mould<br />
Vibratory table<br />
Figure L.21A: Vibratory table set up<br />
30
50kg Surcharge<br />
The left image shows<br />
how and where the<br />
markings were made<br />
on the surcharge. The<br />
image on the right<br />
shows how the height<br />
300 x 150 mm<br />
Steel Mould<br />
of a layer is checked<br />
(in this case layer 2)<br />
Layer 1<br />
Layer 2<br />
Layer 3<br />
Layer 4<br />
Foot<br />
Piece<br />
60mm<br />
Steel Rule<br />
Layer 2<br />
Layer 1<br />
after the compaction<br />
of that layer was<br />
completed i.e. a layer<br />
thickness of 60mm<br />
was achieved.<br />
Figure L.21B: 60mm intervals marked on the 50kg Surcharge<br />
Frequency<br />
dial<br />
On/Off<br />
Neck extension<br />
Figure L.22: Vibratory table<br />
the final layer<br />
during compaction of<br />
31
3.2 Experimentation<br />
3.2.1 Material Type and Properties<br />
3.2.1.1 Material Type<br />
The material type chosen to be used for experimentation purposes was a<br />
G2 material. This was acquired from Lafarge at their Tygerberg Quarry.<br />
For purposes of correlation to site compaction, material from a recycling<br />
project taking place along the N7 (between Cape Town and Malmsbury)<br />
was used. This material was acquired in two states.<br />
1. Untreated milled material.<br />
2. BSM-emulsion: milled material.<br />
The N7 material is also a G2 material but due to the milling process RAP<br />
(Recycled Asphalt Pavement) was present in the material make up.<br />
After completion of the G2 and N7 experimentation, a G5 material was used<br />
to perform repeatability experiments so as to establish whether or not the<br />
compaction procedure developed from the G2 material would be compatible<br />
with other granular materials, the G5 material was acquired from Lafarge at<br />
their Eesrte River Quarry.<br />
3.2.1.2 Material Properties<br />
The following material properties for the G2, G5 and N7 Material were<br />
obtained.<br />
• Mod AASHTO curve of untreated material<br />
Table L.3: Technical Information of untreated G2 Material<br />
G2 Material: Untreated<br />
OMC<br />
Max Dry Density<br />
6.15% 2260 kg/m 3<br />
32
Table L.4: Technical Information of untreated G5 Material<br />
G5 Material: Untreated<br />
OMC Max Dry Density<br />
6.7% 2228 kg/m 3<br />
Table L.5: Technical Information of untreated N7 Material<br />
N7 Material: Untreated<br />
OMC<br />
Max Dry Density<br />
5.12% 2138 kg/m 3<br />
• Mod AASHTO curve of Bitumen <strong>Stabilized</strong> Material (BSM)<br />
Table L.6: Technical Information of BSM-emulsion G2 Material<br />
G2 Material: BSM-emulsion<br />
OMC<br />
Max Dry Density<br />
4.0% 2188 kg/m 3<br />
Table L.7: Technical Information of BSM-emulsion G5 Material<br />
G5 Material: BSM-emulsion<br />
OMC Max Dry Density<br />
6.8% 2217 kg/m 3<br />
Table L.8: Technical Information of BSM-emulsion N7 Material<br />
N7 Material: Material Treated with BSMemulsion<br />
on Site<br />
OMC<br />
Max Dry Density<br />
5.6% 2130 kg/m 3<br />
33
Table L.9: Technical Information of BSM-foam G2 Material<br />
G2 Material: BSM-foam<br />
OMC<br />
Max Dry Density<br />
4.8% 2132 kg/m 3<br />
Table L.10: Technical Information of BSM-foam G5 Material<br />
G5 Material: BSM-foam<br />
OMC Max Dry Density<br />
6.95% 2149.5 kg/m 3<br />
Atterberg limits of the G2, G5 and N7 material<br />
Table L.11: Atterberg Limits of Granular <strong>Materials</strong> used for experimentation<br />
Atterberg Limit G2 G5 N7<br />
Linear Shrinkage Non Plastic 3.3% 2%<br />
Liquid Limit Non Plastic 24% 20%<br />
Plastic Limit Non Plastic 20.7% 16.3%<br />
Plasticity Index Non Plastic 3.3% 3.7%<br />
Grading curves: the first haul of G2 material was brought in bags, where<br />
the second haul was a large stock pile of material. Therefore to check the<br />
consistency of the grading 2 bags were selected and a grading done on<br />
them and a grading was done on the stockpile material. The grading<br />
between the selected bags and stockpile varied very little. The grading<br />
curve for the N7 material was obtained from MSc. Student Mr. Percy Moloto.<br />
34
Grading curve: G2 material<br />
120.0<br />
100.0<br />
Sample 1<br />
Sample 1 Stock Pile<br />
Random Bag<br />
80.0<br />
% Passing<br />
60.0<br />
40.0<br />
20.0<br />
0.0<br />
0.01 0.1 1 10 100<br />
Seive Sizes (mm)<br />
Figure L.23: Grading curve G2 material<br />
N7 Graded Crushed Stone: Wet Grading Curve<br />
120.0<br />
UPPER LIMIT (Unsuitable: Too Fine)<br />
LOWER LIMIT (Unsuitable: Too Coarse)<br />
IDEAL (Suitable)<br />
N7 GRADED CRUSHED STONE<br />
% Passing<br />
100.0<br />
80.0<br />
60.0<br />
40.0<br />
Upper Limit: Too Fine<br />
Ideal: Suitable<br />
20.0<br />
Lower Limit: Too Coarse<br />
0.0<br />
0.0 0.1 1.0 10.0 100.0<br />
Sieve Size (mm)<br />
Figure L.24: N7 Grading Curve<br />
35
From the grading curves, material from the G2 stock pile and N7 were sieved into fractions<br />
and reconstituted. The N7 had a different grading to the G2 material and after<br />
reconstitution the differences could be seen.<br />
G2 Stock Pile & Quarry Grading Curve vs. N7 Material Grading Curve<br />
120.0<br />
100.0<br />
G2 Stock Pile (US)<br />
N7 Material<br />
G2 Quarry Grading<br />
80.0<br />
% Passing<br />
60.0<br />
40.0<br />
20.0<br />
0.0<br />
0.01 0.1 1 10 100<br />
Sieve Size (mm)<br />
Figure L.25: Comparison of G2 Stock Pile & Quarry Grading to N7 Material Grading<br />
Figure L.26: Visual N7 Material<br />
Figure L.27: Visual N7 Material < 13.2mm<br />
≥13.2mm<br />
36
Figure L.28: Visual G2 Material<br />
Figure L.29: Visual G2 Material < 13.2mm<br />
≥13.2mm<br />
Similar to the way in which the G2 and N7 material samples were prepared so to were the G5<br />
materail samples prepared from a grading curve, the curve used to reconstitute the G5 sieved<br />
fractions into a sample is provided below.<br />
100.0<br />
90.0<br />
80.0<br />
Grading Curve G5 Material: Quarry Grading vs. US Adjusted Grading<br />
Curve<br />
Quarry Grading of G5 Material<br />
US Adjusted Grading<br />
% Passing<br />
70.0<br />
60.0<br />
50.0<br />
40.0<br />
30.0<br />
20.0<br />
10.0<br />
0.0<br />
0.01 0.1 1 10 100<br />
Sieve Size (mm)<br />
Figure L.30: Grading Curve G5 Material: Quarry Grading vs. US Adjusted Grading Curve<br />
Lafarge quarry provided a grading curve (the blue line in figure L.30), there curve however<br />
included fractions of material retained on the 26mm sieve. For purposes carried out during<br />
experimentation of the G5 material the grading curve was adjusted to include only material<br />
retained on the 19mm sieve and smaller sieves (the pink line); the curve was adjusted using<br />
a dry grading.<br />
37
3.2.2 Technical Aspects of Experiments<br />
3.2.2.1 Compaction procedure for experimentation performed<br />
Based on the two existing methods stated in sub section 3.1.2.1 a design<br />
procedure for the compaction experiments was developed.<br />
1. A Mod AASHTO curve for the given material would be done. Form this<br />
curve the OMC value of the material was determined.<br />
2. A BSM-emulsion Mod AASHTO curve and a BSM-foam Mod AASHTO curve<br />
were then done. From the GEMS manual it was found that for the<br />
moisture contents of BSM-emulsion a target moisture content of 60%<br />
OMC was used. This is due to the fact that the bitumen acts as a lubricant<br />
during compaction. So the final fluids content during compaction is then<br />
60%OMC added to the % bitumen binder in the BSM-emulsion.<br />
For this Mod AASHTO curve the following moisture contents were used for<br />
BSM-emulsion:<br />
• 60%, 70%, 80%, 90% and 100% OMC<br />
For the BSM-foam Mod AASHTO curve the same moisture contents<br />
were used.<br />
3. The targeted moisture content during compaction would then be decided<br />
on, e.g. compact at 80% OMC. From this, referring to the Mod AASHTO<br />
curve for the specific mix (BSM-emulsion or BSM-foam), the target dry<br />
density was then determined.<br />
4. From step 3 the final mass of material and the mass of material per layer<br />
could then be determined. Only the moisture content needs to be taken<br />
out of the target dry density because the Mod AASHTO curve of the<br />
specific mix accounts for the presence of bitumen.<br />
The mass of material for each individual layer is then determined and<br />
weighed off. This is done because by controlling the mass of material per<br />
layer the thickness of the layer which will yield the equivalent dry density<br />
for 100% Mod AASHTO dry density is known and can be identified during<br />
compaction.<br />
38
The sample was compacted in 5 layers to a height of 300mm, therefore<br />
the equivalent dry density for 100% Mod AASHTO dry density is at 60mm<br />
layer thickness for each layer. The decision to use five layers was based<br />
on ITT <strong>Report</strong> 18.1-1997 (van de Ven et al, 1997) where five layers were<br />
used during vibratory table compaction.<br />
Prior to compaction the vibratory hammer is placed on the steel rods and<br />
allowed to rest on the base plate. Where the bottom of the sleeve rests<br />
on the rod, a mark is made using masking tape. This is the zero line. The<br />
hammer is then raised and 60mm is measured upward from the zero line<br />
and another mark is made. When, during compaction the sleeve reaches<br />
the 60mm marked off line then it is known that 100% Mod AASHTO dry<br />
density has been reached. After compaction, a mark is made where the<br />
sleeve is at its final resting place, the hammer is raised and 60mm is<br />
measured up from that point again, and so it continues till the compaction<br />
of the sample as whole is completed; figure L.31 provides a visual of how<br />
this procedure looks.<br />
Figure L.31 is a visual of the procedure used to perform the compaction<br />
experiments on the G2, G5 and N7 material. The line marked 100% Mod<br />
AASHTO (60mm) is the position of the foot piece at the point in time<br />
when the sleeve reaches the 60mm marked off line on the guide rod. This<br />
point, based on the relevant calculations, is the point when 100% Mod<br />
AASHTO is achieved. The dashed line marked final position is the point<br />
where the refusal density of the material is reached, in the case of<br />
experiments performed where time was taken as a factor and not as a<br />
fixed value. The experiments were at first run so as to determine the<br />
compaction density plot over time, therefore compaction was done to the<br />
point where it was decided that no further compaction was possible<br />
without crushing the aggregate; refusal density, this point was decided on<br />
when it appeared that the sleeve no longer moved down the guide rods.<br />
After a layer had reached refusal density a mark was made on the guide<br />
rod and 60mm was measured up from that point. This 60mm mark was<br />
then the point at which the following layer reached 100% Mod AASHTO.<br />
It should be noted that during the compaction time to refusal density, the<br />
compaction was stopped at regular time intervals and the layer thickness<br />
at that point in time was noted. This was done by making a mark on the<br />
sleeve at that specific position and measuring the distance from that point<br />
to either the zero line in the case of layer 1 or the refusal density line of<br />
the previously compacted layer in the case of the subsequent layers.<br />
39
In the case of the experiments where time was fixed and not taken as a<br />
factor, the 60mm position of the first layer was determined. Compaction<br />
of the layer took place as described previously but this time for an<br />
allocated time. After compaction of the first layer the thickness was<br />
measured by measuring from the final position of the sleeve, after the<br />
allocated compaction time, to the zero line, a mark was also made and<br />
termed final position. The hammer was then raised and 60mm was<br />
measured up from the point marked off as final position. The subsequent<br />
layers were then compacted according to their allocated times and the<br />
final positions noted. These layer thicknesses were then determined by<br />
measuring from their respective final positions to the final position of the<br />
previously compacted layer. This compaction procedure allowed the<br />
individual compacting to note whether or not the targeted 100% Mod<br />
AASHTO or site achieved density could be achieved in the allocated time.<br />
5. Between the compaction of layers, the surface of the previously<br />
compacted layer is scarified (±10mm) using a chisel, this is done before<br />
the next layer’s material is added. This is done so that interlocking of the<br />
particles may take place.<br />
6. The standard oven drying method is used to check the moisture content<br />
of the compacted sample.<br />
For each experiment a minimum number of two samples were used and a maximum<br />
of three samples was used. Two samples were used in the event that the variability<br />
of results was at a minimum (for e.g. Layer 1 of sample 1 takes 60 sec to compact<br />
and layer 1 of sample 2 takes 61 sec to compact). Typically though, three samples<br />
were used because this gave more accurate results and the variability of the results<br />
could be seen more clearly.<br />
40
Sleeve<br />
Vibratory<br />
Hammer<br />
Zero Line<br />
Side of Mould<br />
Steal Rod<br />
Base Plate<br />
Wooden base<br />
Initial Step:<br />
determining<br />
the Zero Line<br />
60mm<br />
100% Mod AASHTO<br />
(60mm)<br />
Final position<br />
Zero Line<br />
Next Step:<br />
determining<br />
the 60mm Line<br />
for the first<br />
layer<br />
Final position<br />
100% Mod AASHTO(60mm)<br />
Final position<br />
60mm<br />
100% Mod AASHTO (60mm)<br />
Final position<br />
Zero Line<br />
100% Mod AASHTO (60mm)<br />
Remaining<br />
Steps:<br />
determining<br />
the 60mm<br />
Line for the<br />
next layer<br />
Figure L.31: Measurement of layer thicknesses<br />
41
3.2.3 BSM-emulsion<br />
On the N7 recycling site a 60/40 anionic bitumen emulsion (stable grade) was used<br />
for the recycling. The content of emulsion added to treat the material was 3.3%<br />
bitumen emulsion. Therefore, in order to correlate the laboratory compaction to the<br />
site compaction as accurately as possible, the type of bitumen emulsion and<br />
emulsion content used on site was also used for the laboratory experiments. The<br />
bitumen emulsion was acquired from Colas.<br />
3.2.4 BSM-foam<br />
Rehabilitation of the N7 highway between Cape Town and Malmsbury using BSMfoam<br />
took place around 2002/2003. 60/70 penetration bitumen was used with a<br />
content of 2.3% (Theyse, 2003), the First Level Analysis <strong>Report</strong>: HVS Testing of<br />
Foamed bitumen-treated crushed stone base on N7/1 near Cape Town. The material<br />
type of the base layer was a G2 material.<br />
For purposes of testing in the Laboratory an 80/100 penetration bitumen was used<br />
with a binder content of 1.98% (2%). The binder content of 1.98% was used<br />
because that was the binder content being used on site during rehabilitation using<br />
BSM-emulsion. The result is that a comparison of the compaction of BSM-emulsion<br />
to BSM-foam can be done with the binder content being the same. Below are<br />
pictures of the foam plant WLB 10 at the University of Stellenbosch.<br />
Figure L.32: Foam Nozzle Figure L. 33: Foam plant WLB 10<br />
42
Figure L.34: Twin shaft pug mill mixer<br />
Figure L.35: Twin shaft pug mill mixer with<br />
dome<br />
3.2.5 Further Experimentation<br />
It is thought that this compaction method will also be used to compacted untreated<br />
granular material. Therefore experimentation using clean granular material having<br />
only water added will also be investigated.<br />
43
3.3 Material Property Tests<br />
3.3.1 C.T. Scanning<br />
CT scanning was to be performed on a series of samples compacted under the<br />
Vibratory hammer and Mod AASHTO compaction. The samples were two (2)<br />
vibratory hammer compacted samples: 1 BSM-emulsion sample and 1 BSM-foam<br />
sample. The other sample was a BSM-emulsion sample compacted using Mod<br />
AASHTO compaction.<br />
The purpose of this scanning was to determine what the particle orientation of the<br />
samples was like and what the voids of the compacted sample looked like. TU Delft<br />
in the Netherlands agreed to perform the tests for the University of Stellenbosch.<br />
Transporting the samples oversees was made difficult due the mass of each sample.<br />
A single sample compacted using the vibratory hammer had a mass of around 11kg.<br />
Therefore the samples were cut into two sections of ±75mm thick and the Mod<br />
AASHTO sample was section in half (this sample a massed to ±5kg). The sectioning<br />
is indicated schematically below.<br />
150mm<br />
150mm<br />
150mm<br />
Top:<br />
S1B<br />
Middle:<br />
S1A<br />
75mm<br />
75mm<br />
Piece<br />
Sent: S2<br />
±60mm<br />
Top:<br />
S3B<br />
Middle:<br />
S3A<br />
75mm<br />
75mm<br />
Emulsion <strong>Mix</strong>: Mod Aashto<br />
BSM-emulsion: Mod<br />
Compaction<br />
AASHTO Compaction<br />
BSM-emulsion:<br />
Emulsion <strong>Mix</strong>:<br />
Vibratory Vibratory<br />
Hammer<br />
Foam BSM-foam:<br />
<strong>Mix</strong>: Vibratory<br />
Vibratory Hammer Hammer<br />
Figure L.36: Sectioned samples for CT Scanning<br />
44
3.4 Statistical Analysis<br />
Statistical analyses were performed on the N7 site results. This was done to determine the target<br />
dry density to which the samples in the laboratory would be compacted when using the N7<br />
material. The full statistical analysis performed on the N7 material can be viewed in Appendix A.<br />
For the BSM-emulsion, compaction densities on site were reaching as high as 110% Mod AASHTO<br />
and the lowest result found was at 101% Mod AASHTO. Therefore it was decided to use the 75 th<br />
percentile to which compaction would be targeted. The 100% Mod AASHTO dry density was then<br />
determined.<br />
• 75 th percentile = 104.61% Mod AASHTO = 2255kg/m 3<br />
• The 100%Mod AASHTO target dry density = 2159.05kg/m 3<br />
From the CSIR report stated in sub section 3.2.4 it was found that the BSM-foam layer never<br />
reached 100% Mod AASHTO compaction. Therefore to correlate the compacted laboratory sample to<br />
the site results the mean density achieved on site was used as the target compaction dry density.<br />
• Mean density achieved on site = 2177.33kg/m3<br />
A statistical analysis will also be performed on the experimentation results of both N7 and G2<br />
material.<br />
45
4 Results and Interpretations<br />
This section of the report presents the results of the experiments performed as well as<br />
the interpretations there of. The moisture content provided in the figures in this section<br />
of the report are expressed as a percentage of the OMC of the clean or untreated<br />
material from the Mod AASHTO compaction (OMC (MOD-U)), e.g. 70% OMC is 70% of<br />
the OMC of the untreated material from the Mod AASHTO compaction. Below is a flow<br />
chart depicting the experimentation planning:<br />
Untreated G2 Material: OMC - Mod AASHTO<br />
Curve<br />
BSM: Bitumen Stabilised Material<br />
BSM-emulsion<br />
BSM-foam<br />
Mod AASHTO OMC Curve<br />
Compaction type<br />
Kango 637®/Bosch GSH 11E®<br />
Surcharge<br />
Vibratory Table<br />
TMH 1 Procedure<br />
10 kg 20 kg 15/30 kg<br />
Moisture Content (%)<br />
70%OMC<br />
80%OMC<br />
90%OMC<br />
Choose Best Result<br />
0<br />
Temperature (<br />
Celsius)<br />
5<br />
15 35<br />
Compaction of N7 Material:<br />
Field Correlation<br />
Flow Chart L.1: Experimentation Structure for G2 Granular <strong>Materials</strong><br />
46
4.1 Mod AASHTO Curves<br />
Prior to the commencement of the experiments, moisture curves were set up.<br />
First a moisture curve was set up using the clean untreated G2 material. The<br />
result is a follows:<br />
Moisture Curve of Untreated G2 Material: Mod AASHTO<br />
2280.0<br />
2260.0<br />
2240.0<br />
Dry Density (kg/m3)<br />
2220.0<br />
2200.0<br />
2180.0<br />
2160.0<br />
2140.0<br />
2120.0<br />
2100.0<br />
OMC: 6.15%<br />
0.0 1.0 2.0 3.0 4.0 5.0 6.0 7.0 8.0 9.0<br />
Moisture Content (%)<br />
Figure L.37: Mod AASHTO Moisture Curve of Untreated G2 Material<br />
From the figure it is found that the OMC (MOD-U) of the G2 material is 6.15% with<br />
a maximum dry density of 2260kg/m 3 . From the OMC, two new figures were set up<br />
using the G2 material. A moisture curve for material treated with emulsion and a<br />
moisture curve for material treated with foamed bitumen. The BSM-emulsion was<br />
prepared using a 60/40 bitumen emulsion with 3.3% emulsion added to the<br />
material. The figures are as follows:<br />
47
Moisture Curve of BSM-emulsion G2 Material: Mod AASHTO<br />
2200<br />
2186<br />
2180<br />
Dry Density (kg/m3)<br />
2160<br />
2140<br />
2120<br />
2100<br />
2080<br />
2060<br />
OMC: 3.8%<br />
0.00 2.00 4.00 6.00 8.00<br />
Moisture Content (%)<br />
Figure L.38: Moisture Curve of BSM-emulsion G2 Material – Mod AASHTO<br />
Moisture Curve of BSM-foam G2 Material: Mod AASHTO<br />
2140.00<br />
2131.00<br />
2120.00<br />
Mod Curve of BSM-foam G2<br />
Dry Density (kg/m3)<br />
2100.00<br />
2080.00<br />
2060.00<br />
2040.00<br />
2020.00<br />
2000.00<br />
OMC: 4.8%<br />
0.00 1.00 2.00 3.00 4.00 5.00 6.00 7.00 8.00 9.00 10.00<br />
Moisture Content (%)<br />
Figure L.39: Moisture Curve of BSM-foam G2 Material – Mod AASHTO<br />
From the BSM-emulsion figure and the BSM-foam figure it is found that the<br />
optimum moisture contents are 3.8% and 4.8% respectively. It is to be expected<br />
that the moisture content of the BSM-emulsion is lower than that of the BSM-foam.<br />
This is because in the BSM-emulsion the bitumen itself acts a compaction lubricant,<br />
where in the BSM-foam it does not. Therefore more moisture may be required<br />
48
during compaction of the BSM-foam. For the BSM-emulsion the total fluid content is<br />
taken as the moisture content plus the bitumen binder content, in the BSM-foam it<br />
is only the moisture that acts as a compacting lubricant. Therefore for moisture<br />
content of 3.8% the bitumen emulsion will have a fluid content of 5.78%, much<br />
higher than the foam mix moisture of 4.8%.<br />
Comparative figures are provided below to show how the BSM-emulsion and BSMfoam<br />
moisture curves look in comparison to the moisture curve of the untreated G2<br />
material. Comparative curves for both BSM-emulsion and BSM-foam material were<br />
also set up so as to compare the Mod AASHTO OMC moisture curve to the OMC<br />
moisture curve of the Vibratory Hammer, these curves are provided and discussed<br />
at a later stage in this section of the report.<br />
Comparison between Mod AASHTO curve of Untreated G2 and<br />
BSM-emulsion G2 Material - Mod AASHTO<br />
2300<br />
2260<br />
2250<br />
Mod AASTHO Untreated G2<br />
BSM-emulsion G2<br />
2.35%<br />
Density kg/m3<br />
2200<br />
2186<br />
2150<br />
2100<br />
2050<br />
3.80 6.15<br />
0.00 1.00 2.00 3.00 4.00 5.00 6.00 7.00 8.00 9.00<br />
Moisture %<br />
Figure L.40: Comparative Moisture Curve of Untreated G2 and BSM-emulsion G2 Material –<br />
Mod AASHTO<br />
49
Comparison between Mod AASHTO curve of Untreated G2 and BSMfoam<br />
G2 Material - Mod AASHTO<br />
Dry Density (kg/m3)<br />
2300<br />
2260<br />
2250<br />
2200<br />
2150<br />
2135<br />
2100<br />
Mod curve of untreated G2<br />
Mod Curve of BSM-foam G2<br />
1.35<br />
2050<br />
2000<br />
0.00 2.00 4.00 4.80<br />
6.15<br />
6.00 8.00 10.00<br />
Moisture Content (%)<br />
Figure L.41: Comparative Moisture Curve of BSM-foam and Untreated G2 Material – Mod<br />
AASHTO<br />
50
4.2 Compaction of Site treated Material – BSM-emulsion: Kango 637<br />
At the beginning of 2007, i.e. between February 2007 and April 2007 material was<br />
obtained from the N7 site while the recycling project was underway. This material<br />
had already been milled and treated with bitumen emulsion and was used to<br />
produce samples for triaxial testing that needed to be performed on the material,<br />
the triaxial set up at the University of Stellenbosch does not accommodate a<br />
sample height in excess of 250mm, therefore the samples prepared were to have<br />
dimensions of 250mm x Ф 150mm. The vibratory hammer was used to produce<br />
these samples; therefore initial experimentation of the vibratory hammer<br />
compaction set up took place on this material. For these experiments the Kango<br />
637® was used.<br />
Samples were compacted in five layers (van de Ven, 1997) and the target Dry<br />
Density was known before hand (site compaction results were obtained from Soil<br />
Lab and these were used to determine the target Dry Density of 100% Mod<br />
AASHTO), therefore the mass of material per layer could be determined and the<br />
time to the target Dry Density could be measured; once a layer reached a<br />
thickness of 50mm the 100% Mod AASHTO target Dry Density was achieved. The<br />
marking procedure described in the methodology section was not used for the<br />
experiments on the site treated BSMs, rather at regular time intervals the hammer<br />
was raised and the height of the sample was measured using a tape measure by<br />
measuring from the surface of the compacted layer to the top of the mould and<br />
subtracting that measurement from either 250mm (in the case of layer 1) or the<br />
sum height of the previously compacted layers.<br />
51
4.2.1 0kg Surcharge<br />
120.0<br />
%Mod AASHTO vs. Time: 0kg Surcharge Kango 637®<br />
N7 Site Treated Material<br />
100.0<br />
% Mod AASHTO<br />
80.0<br />
60.0<br />
40.0<br />
Layer 1<br />
Layer 2<br />
Layer 3<br />
Layer 4<br />
Layer 5<br />
20.0<br />
0.0<br />
0 20 40 60 80 100 120<br />
Time (seconds)<br />
Figure L.42: 0kg surcharge - %Mod AASHTO vs. Time of separate layers site treated material,<br />
Kango 637®<br />
From Figure L.42 it is found that with no surcharge (i.e. the hammer is compacting<br />
under its own weight and that of the frame) it takes around 60 seconds to compact<br />
the site treated material to 100% Mod AASHTO (from information provided in the<br />
methodology chapter, 100% Mod AASHTO for this experiment is given as<br />
2130kg/m 3 ). The compaction curve plateaus out between 101% and 103% Mod<br />
AASHTO (depending on the layer). That plateau is taken as the refusal density.<br />
The material compacted for layer one reached a higher refusal density than the<br />
remaining four layers. This is possibly due to it being compacted against the steel<br />
base plate. From the figure it appears that when the material is compacted against<br />
other layers the density is not as high as layer one’s refusal density but they appear<br />
more consistent, this is possibly due to the softer surface of the underlying layer<br />
against which it is compacted when compared to the hard steel base plate.<br />
52
4.2.2 10kg Surcharge<br />
120.0<br />
%Mod AASHTO vs. Time: 10kg surcharge Kango 637®<br />
N7 Site Treated Material<br />
100.0<br />
% Mod AASHTO<br />
80.0<br />
60.0<br />
40.0<br />
Layer 1<br />
Layer 2<br />
Layer 3<br />
Layer 4<br />
Layer 5<br />
20.0<br />
0.0<br />
0 20 40 60 80 100 120 140 160<br />
Time (sec)<br />
Figure L.43: 10kg Surcharge - %Mod AASHTO vs. Time of separate layers of sample of site<br />
treated material, Kango 637®<br />
Figure L.43 shows a slightly different trend from Figure L.42. Here the layers do not<br />
all reach 100% Mod AASHTO in the same time. Layer 1, 3, and 5 all are at 100%<br />
Mod AASHTO after ± 45 sec of compaction (although layer 5 reaches 100% Mod<br />
AASHTO after only 30seconds). Layers 2 and 4 achieve 100% Mod AASHTO after 90<br />
seconds of compaction. The final refusal densities are also more distributed varying<br />
from 109.5% Mod AASHTO for layer 5 to 100.7% Mod AASHTO for layers 2 and 4.<br />
It is not certain why layer 5 achieved such a high refusal density in comparison to<br />
the remaining layers. Small amounts of material were lost when emptying the bag<br />
of weighed of material for layer 5. therefore it is possible that the assumed mass of<br />
material of layer 5, when performing calculations, is in fact less and could yield a<br />
higher density calculation, this because, say for example 2000gm of material is<br />
weighed off for the layer and when it is emptied into the mould assume 100gm is<br />
lost to side of the mould, because there is a small space between the neck<br />
extension and the top of the mould, when the material is compacted to 55mm the<br />
actual density is less due the loss of material than what it would be because there is<br />
less mass in that volume of the layer, but for the calculations the original mass per<br />
layer is assumed.<br />
53
4.3 Influence of Compaction over Time with Varying Moisture Content:<br />
G2 Material<br />
A factor that affects compaction quite significantly is moisture content. Moisture acts<br />
as a lubricant between particles and therefore aids in the shifting and orientation of<br />
particles during compaction. Therefore experiments were carried out using varying<br />
moisture contents and varying the applied dead load so as to asses the outcome of<br />
the compaction.<br />
4.3.1 BSM-emulsion G2 Material<br />
4.3.1.1 10kg Surcharge – Kango 637<br />
70% OMC (MOD-U)<br />
Experiments performed on the BSM-emulsion G2 material at 70% OMC (MOD-<br />
U) were performed by civil engineering student Rojean Hanekom (Hanekom,<br />
2007).<br />
Time To 100% Mod AASHTO Compaction: BSM-emulsion G2<br />
Material 70% OMC (Mod-U) 10kg Surcharge, Kango 637®<br />
60<br />
50<br />
40<br />
Time (Sec)<br />
30<br />
20<br />
10<br />
0<br />
Layer 1 Layer 2 Layer 3 Layer 4 Layer 5<br />
Layer<br />
Figure L.44: Time to 100% Mod AASHTO compaction at 70% OMC (MOD-U) – 10kg Surcharge<br />
BSM-emulsion G2 Material, Kango 637®<br />
54
The results provided in Figure L.44 are the average result of three samples.<br />
The figure shows a variation in the time it takes to compact to 100% Mod<br />
AASHTO with layer 1 compacted the fastest to 100% Mod AASHTO (30<br />
seconds). This is possibly due to the hard steel base against which the first<br />
layer is compacted. Layers 2 and 4 took the longest with both taking 50<br />
seconds to compact to 100% Mod AASHTO. Layer 3 and 5 were also very<br />
close to each other at 40 seconds and 39 seconds respectively. These<br />
results show that there is only a 10 second variation in time with regard to<br />
the compaction of the final 4 layers.<br />
110.0<br />
%Mod AASHTO vs. Time: BSM-emulsion G2 Material 70% OMC<br />
(Mod-U) 10kg Surcharge - Kango 637®<br />
108.0<br />
106.0<br />
%Mod AASHTO<br />
104.0<br />
102.0<br />
100.0<br />
98.0<br />
Layer 1<br />
Layer 2<br />
Layer 3<br />
Layer 4<br />
Layer 5<br />
96.0<br />
94.0<br />
92.0<br />
0 50 100 150 200<br />
Time (Sec)<br />
Figure L.45: Mod AASHTO Density over time of 70% OMC (MOD-U) BSM-emulsion G2 Material<br />
– 10kg Kango 637®<br />
Figure L.45 shows a relatively large variation in the achieved refusal density,<br />
with densities ranging from 103.3 % Mod AASHTO to 109% Mod AASHTO.<br />
Layers 1 through 4 all took 180 seconds (3 minutes) to compact to refusal<br />
density, but layer 5 took the least amount of time, requiring 150 seconds<br />
(2.5 minutes) to achieve refusal density.<br />
55
80% OMC (MOD-U)<br />
Time to 100% Mod AASHTO Compaction: BSM-emulsion G2<br />
Material 80% OMC(Mod-U) 10kg Surcharge, Kango 637®<br />
70.00<br />
60.00<br />
50.00<br />
Time (S)<br />
40.00<br />
30.00<br />
20.00<br />
10.00<br />
0.00<br />
Layer1 Layer2 Layer3 Layer4 Layer5<br />
Layers<br />
Figure L.46: Time to 100% Mod AASHTO compaction at 80% OMC (MOD-U) – 10kg Surcharge<br />
BSM-emulsion, Kango 637®<br />
Figure L.46 shows a very consistent compaction profile for the time to 100% Mod<br />
AASHTO result. Only layer 4 is significantly out when compared to the remaining<br />
layers. When compared to Figure L.44, it appears that at 80% OMC (MOD-U) the<br />
compaction of the material is more consistent.<br />
56
112.0<br />
%Mod AASHTO vs. Time: BSM-emulsion G2 Material 80% OMC<br />
(Mod-U) 10kg Surcharge, Kango 637®<br />
110.0<br />
% Mod AASHTO<br />
108.0<br />
106.0<br />
104.0<br />
102.0<br />
Layer1<br />
Layer2<br />
Layer3<br />
Layer4<br />
Layer5<br />
100.0<br />
98.0<br />
0 50 100 150 200 250<br />
Time (sec)<br />
Figure L.47: Mod AASHTO Density over time of 80% OMC (MOD-U) BSM-emulsion– 10kg<br />
Surcharge BSM-emulsion, Kango 637®<br />
The profile for the refusal density (Figure L.47) shows a slightly different<br />
result in terms of consistency of the results. The achieved refusal densities<br />
vary considerably, ranging from 103.5% Mod AASHTO to about 111% Mod<br />
AASHTO. Compaction times to refusal density also vary, ranging from 155<br />
seconds to 240 seconds. The main reason for this could be the grading.<br />
Although the grading of each sample is the same, the grading of the various<br />
weighed off layers may differ from each other; this trend is seen in the<br />
other experiments. The mass of material required for one sample is decided<br />
before hand (Typically 13kg of material for a sample) and the separate<br />
layers are weighed of from this mass. The grading of the 13kg of material<br />
across the samples is consistent but because the layers are scooped out of<br />
this source using either a scoop or small spade, the grading of each layer<br />
may vary – some layers having more fines than others. If this is the case it<br />
could explain the variability in the refusal density.<br />
57
90% OMC (MOD-U)<br />
Time to 100% Mod AASHTO Compaction: BSM-emulsion G2 ® Material<br />
90% OMC(Mod-U) 10kg Surcharge, Kango 637<br />
Time (s)<br />
16.00<br />
14.00<br />
12.00<br />
10.00<br />
8.00<br />
6.00<br />
4.00<br />
2.00<br />
0.00<br />
Layer1 Layer2 Layer3 Layer4 Layer5<br />
Layers<br />
Figure L.48: Time to 100% Mod AASHTO compaction at 90% OMC (MOD-U) – 10kg Surcharge<br />
BSM-emulsion, Kango 637®<br />
Figure L.48 also shows a relatively consistent compaction profile for the<br />
time to 100% Mod AASHTO result. The times vary by no more than about 2<br />
seconds across the sample. The compaction times range from 11 to 13<br />
seconds, depending on the layer, this is however are too short to allow for<br />
adequate particle orientation. The result is that quality of site representation<br />
may not be adequate enough. The appearance of the material was very<br />
‘slushy’ when compared to the 80% OMC (MOD-U) material.<br />
58
116.0<br />
%Mod AASHTO vs. Time : BSM-emulsion G2 Material 90% OMC<br />
(Mod-U) 10kg Surcahrge - Kango 637®<br />
% Mod AASHTO<br />
114.0<br />
112.0<br />
110.0<br />
108.0<br />
106.0<br />
104.0<br />
102.0<br />
100.0<br />
Layer1<br />
Layer2<br />
Layer3<br />
Layer4<br />
Layer5<br />
98.0<br />
0 50 100 150 200 250 300 350<br />
Time (sec)<br />
Figure L.49: %Mod AASHTO Density over time of 90% OMC (MOD-U) BSM-emulsion G2<br />
Material – 10kg Surcharge, Kango 637®<br />
Once again the refusal density profile (Figure L.49) shows high variability<br />
with densities ranging from 109% Mod AASHTO to about 115% Mod<br />
AASHTO. Compaction times to refusal density also vary, ranging from 210<br />
seconds to 300 seconds. A clear result is that moisture content has an affect<br />
on the compaction of the material. From this result it was decided not to<br />
investigate compaction at 90% OMC (MOD-U) any further. As with the 80%<br />
OMC (MOD-U) the main reason for the variation in refusal density and time<br />
to refusal density could be the grading of the individual layers.<br />
4.3.1.2 20kg Surcharge – Kango 637<br />
70% OMC (MOD-U)<br />
Results are provided with reference to Rojean Hanekom (2007). The results<br />
obtained by Mr. Hanekom indicate that for a 20kg surcharge the compaction<br />
time to 100% Mod AASHTO took longer than that of the 10kg surcharge for<br />
the same moisture content (Figure L.50 and Figure L.44). The result appears<br />
interesting because it would be expected that for a higher surcharge the<br />
compaction time would be less. It was noted during experimentation that the<br />
Kango 637® did not rebound off the material (therefore having lower<br />
amplitude) as well with the 20kg surcharge as it did with the 10kg surcharge,<br />
59
i.e. there was less of impact/vibratory affect on the material and more of a<br />
general vibratory affect. This could be a possible reason for this result.<br />
Time To 100% Mod AASHTO: BSM-emulsion G2 Material 70%<br />
OMC (Mod-U) 20kg Surcharge, Kango 637®<br />
160<br />
140<br />
120<br />
Time (Sec)<br />
100<br />
80<br />
60<br />
40<br />
20<br />
0<br />
Layer 1 Layer 2 Layer 3 Layer 4 Layer 5<br />
Layer<br />
Figure L.50: Time to 100% Mod AASHTO compaction at 90% OMC (MOD-U) – 10kg Surcharge<br />
BSM-emulsion G2 Material, Kango 637®<br />
60
106.0<br />
%Mod AASHTO vs. Time: BSM-emulsion G2 Material 70% OMC (Mod-U)<br />
20kg Surcharge - Kango 637®<br />
104.0<br />
%Mod AASHTO<br />
102.0<br />
100.0<br />
98.0<br />
Layer 1<br />
Layer 2<br />
Layer 3<br />
Layer 4<br />
Layer 5<br />
96.0<br />
94.0<br />
92.0<br />
0 50 100 150 200 250<br />
Time (Sec)<br />
Figure L.51: Mod AASHTO Density over time of 70% OMC (MOD-U) BSM-emulsion– 20kg<br />
Surcharge BSM-emulsion G2 Material, Kango 637®<br />
The refusal density profile of Figure L.51 also shows variability in the refusal<br />
densities achieved, with densities ranging from 101% Mod AASHTO to<br />
about 105% Mod AASHTO. The figure indicates that the time to refusal<br />
density is consistent. As with the 80% OMC (MOD-U) 10kg surcharge the<br />
main reason for the variation in refusal density could be the grading of the<br />
individual layers but interestingly the time to refusal density is consistent.<br />
61
80% OMC (MOD-U)<br />
Time To 100% Mod AASHTO: BSM-emulsion G2 Material 80%OMC<br />
(Mod-U) 20kg Surcharge, Kango 637®<br />
30<br />
25<br />
20<br />
Time (sec)<br />
15<br />
10<br />
5<br />
0<br />
Layer1 Layer2 Layer3 Layer4 Layer5<br />
Layer<br />
Figure L.52: Time to 100% Mod AASHTO compaction at 80% OMC (MOD-U) – 20kg Surcharge<br />
BSM-emulsion G2 Material, Kango 637®<br />
The result of 80% OMC (MOD-U) BSM-emulsion with a 20kg surcharge is a very<br />
consistent time to 100% Mod AASHTO. The 70% OMC (MOD-U) result for the<br />
same criteria (Figure L.50) showed a more variable result; Layers 1 and 4 taking<br />
150 and 90 seconds respectively while layers 2, 3 and 5 took 60 seconds each).<br />
The assumption that a higher surcharge would result in less compaction time<br />
proved to be correct in the experiment at 80% OMC (MOD-U) (Mod-U) (taking<br />
less than half the time of 70% OMC (MOD-U) with the 10kg surcharge) but for the<br />
moisture content of 70% OMC (MOD-U) (figureL.50) it proved to be incorrect.<br />
62
%Mod AASHTO vs. Time : BSM-emulsion G2 Material 80% OMC<br />
(Mod-U) 20kg Surcahrge - Kango 637 ®<br />
112.0<br />
110.0<br />
%Mod AASHTO<br />
108.0<br />
106.0<br />
104.0<br />
102.0<br />
Layer1<br />
Layer2<br />
Layer3<br />
Layer4<br />
Layer5<br />
100.0<br />
98.0<br />
0 50 100 150 200 250 300 350<br />
Time (Seconds)<br />
Figure L.53: Mod AASHTO Density over time of 80% OMC (MOD-U) BSM-emulsion G2 Material<br />
– 20kg Surcharge, Kango 637®<br />
The refusal density profile of Figure L.53 also shows variability in the refusal<br />
densities achieved, with densities ranging from 107% Mod AASHTO to<br />
about 111% Mod AASHTO. The figure also indicates that the time to refusal<br />
density is variable – between 210 seconds and 300 seconds depending on<br />
the layer. As with the 80% OMC (MOD-U) 10kg surcharge the main reason<br />
for the variation in refusal density results could be the grading of the<br />
individual layers. Another possible reason for the variation is the cushioning<br />
effect of subsequent layers. Layer 1 is compacted on the stiffest anvil (the<br />
steel base plate) while each layer following layer 1 is compacted on the<br />
scoured surface of the previous layer, the scoured surface creates a softer<br />
anvil on which the next layer will be compacted, the cushioning effect may<br />
also be a factor that influences the time to 100% Mod AASHTO compaction.<br />
63
4.3.1.3 15kg Surcharge – Kango 637®<br />
Time to 100% Mod AASHTO: BSM-emulsion G2 Material 80% OMC<br />
(Mod-U) 15kg Surcharge, Kango 637 ®<br />
Time (Sec)<br />
80<br />
70<br />
60<br />
50<br />
40<br />
30<br />
20<br />
10<br />
0<br />
Layer1 Layer2 Layer3 Layer4 Layer5<br />
Layers<br />
Figure L.54: Time to 100% Mod AASHTO compaction at 80% OMC (MOD-U) – 15kg Surcharge<br />
BSM-emulsion G2 Material, Kango 637®<br />
Figure L.54 indicates an interesting trend. The 15 kg surcharge at 80%<br />
OMC (MOD-U) shows times to 100% Mod AASHTO generally fall in<br />
between the 10kg and 20kg surcharge. The results, as with the 10kg and<br />
20kg surcharge, are very consistent, only layer one has a notable<br />
variation, taking almost 70 seconds to reach 100% Mod AASHTO.<br />
Readings were taken at 180 seconds for the 15kg surcharge so as to<br />
determine what density could be expected at an extended compaction<br />
time from the time to 100% Mod AASHTO.<br />
64
4.3.1.4 Comparison between Various BSM-emulsion<br />
Experiments-Kango 637®<br />
Time to 100% Mod Aashto AASHTO: compaction: Comparison Comparison between between 70%, 80% 70%, & 90% 80% OMC &<br />
BSM-emulsion 90% OMC G2 Emulsion Material – <strong>Mix</strong> 10kg, - 10kg, 15kg 15kg & 20kg and 20kg Surcharge, Kango 637®<br />
Time (Sec)<br />
160<br />
140<br />
120<br />
100<br />
80<br />
60<br />
10kg Surcharge (70% OMC)<br />
20kg Surcharge (70% OMC)<br />
10kg Surcharge (80% OMC)<br />
15kg Surcharge (80% OMC)<br />
20kg Surcharge (80% OMC)<br />
10kg Surcharge (90% OMC)<br />
40<br />
20<br />
0<br />
Layer1 Layer2 Layer3 Layer4 Layer5<br />
Layers<br />
Figure L.55: Comparison of Time to 100% Mod AASHTO Compaction For varying Moisture<br />
Contents and Surcharges, BSM-emulsion G2 Material, Kango 637®<br />
The trend described in the previous sub section (4.3.1.3) between the<br />
10kg, 15kg and 20 surcharges at 80% OMC (MOD-U) is evident in Figure<br />
L.55. The results of Mr. Hanekom’s experiments indicate a similar trend<br />
for the 70% OMC (MOD-U) moisture content in the opposite direction.<br />
The result is that the best time to 100% Mod AASHTO compaction that<br />
will also allow for sufficient time for good particle orientation is at 80%<br />
OMC (MOD-U) moisture content with a 10kg surcharge.<br />
65
4.3.1.5 Bosch GSH 11E vs. Kango 637®<br />
Kango 637® vs. Bosch GSH 11E® : Time to 100% Mod AASHTO<br />
BSM-emulsion G2 Material 80% OMC (Mod-U) - 10kg Surcharge<br />
70<br />
60<br />
50<br />
Time to 100% Mod AASHTO:<br />
Bosch GSH 11E®<br />
Time to 100% Mod AASHTO:<br />
Kango 637®<br />
Time (sec)<br />
40<br />
30<br />
20<br />
10<br />
0<br />
1 2 3 4 5<br />
Layer<br />
Figure L.56: Comparison between Compaction times of Bosch GSH 11E® and Kango 637®<br />
Figure L.56 provides a comparative view between the Bosch® and the<br />
Kango® vibratory hammer with regard to BSM-emulsion. It is seen that the<br />
Bosch hammer also provides consistent results with only layer 4 and 5<br />
varying. The difference in compaction time between the Bosch® and<br />
Kango® seems to remain consistent; a difference of 40 seconds is generally<br />
noted with the Bosch® compacting much faster. This reduction in<br />
compaction time by the Bosch GSH 11E® indicates that it exerts more<br />
compacting energy than the Kango 637®.<br />
66
4.3.2 BSM-foam<br />
4.3.2.1 10kg Surcharge – Bosch GSH 11E<br />
Compaction experiments carried out on the BSM-foam G2 material were<br />
performed using the Bosch GSH 11E®. This was due, as was indicated earlier in<br />
the report, to the fact that the Kango 637 ® had become permanently unavailable<br />
due to technical difficulties. Only experiments performed on BSM-foam by Mr.<br />
Rojean Hanekom were done using the Kango 637®, this was because at the time<br />
of his experimentation the Kango 637® had not experienced the technical<br />
difficulties which resulted in a replacement hammer.<br />
70% OMC (MOD-U) - Kango 637®<br />
Experiments performed on BSM-foam material at 70% OMC (MOD-U) were<br />
performed by Rojean Hanekom (Rojean Hanekom, 2007).<br />
Time To 100% Mod AASHTO Compaction: BSM-foam G2 Material<br />
70% OMC (Mod-U) 10kg Surcharge, Kango 637®<br />
70<br />
60<br />
Sample1<br />
Sample2<br />
Average<br />
50<br />
Time (Sec)<br />
40<br />
30<br />
20<br />
10<br />
0<br />
Layer 1 Layer 2 Layer 3 Layer 4 Layer 5<br />
Layer<br />
Figure L.57: Time to 100% Mod AASHTO compaction at 70% OMC (MOD-U) 10kg Surcharge,<br />
BSM-foam G2 Material, Kango 637®<br />
The work done by Mr. Hanekom is shown in Figure L.57 and L.58 Figure<br />
L.57 indicates that there is considerable variability in the compaction of<br />
BSM-foam material when using the vibratory hammer. Samples used for<br />
67
experimentation show the extent to which compaction of the foam mixes<br />
may vary. It is clear from this figure that the way in which the foam mixes<br />
behave is considerably different from the BSM-emulsion. The result of the<br />
70% OMC (MOD-U) foam mix shows that each individual layer requires a<br />
separate compaction time. The middle layer appears to require the most<br />
time to achieve 100% of Mod AASHTO density.<br />
110.0<br />
%Mod AASHTO vs. Time: BSM-foam G2 Material 70% OMC<br />
(Mod-U) - 10kg Surcharge, Kango 637®<br />
108.0<br />
106.0<br />
%Mod AASHTO<br />
104.0<br />
102.0<br />
100.0<br />
98.0<br />
Layer 1<br />
Layer 2<br />
Layer 3<br />
Layer 4<br />
Layer 5<br />
96.0<br />
94.0<br />
0 50 100 150 200 250 300<br />
Time (Sec)<br />
Figure L.58: Mod AASHTO Density over time of 70% OMC (MOD-U) 10kg Surcharge, BSM- foam<br />
G2 Material, Kango 637®<br />
The refusal density plot of Figure L.58 is again indicative of what was seen in the BSMemulsion.<br />
The final refusal densities are variable, and vary from 105% Mod AASHTO to<br />
108% Mod AASHTO. All these densities are achieved in the plateau stage of the figure,<br />
consistently at 180 seconds. Layer 1 reaches the highest refusal density at 108% Mod<br />
AASHTO; this is possibly due to the hard steel base against which it is compacted. Once<br />
again the main factor affecting this variability may be the variability of the grading of the<br />
individual layers.<br />
80% OMC (MOD-U) – Bosch GSH 11E®<br />
The 80% OMC (MOD-U) BSM-foam shows a similar trend to that of the 70%<br />
OMC (MOD-U). There is much variability of the samples used for compaction,<br />
but the nature of the curve when viewing the average result is again a clime<br />
68
to the middle layers and then a tapering off of the final layer. In the 80%<br />
OMC (MOD-U) BSM-foam Layer 4 requires the most amount of time to reach<br />
100% Mod AASHTO. These results again indicate that when compacting foam<br />
mixes with the vibratory hammer each individual layer requires its own<br />
specified time.<br />
Figure L.59: Time to 100% Mod AASHTO compaction at 80% OMC (MOD-U) 10kg Surcharge,<br />
40<br />
35<br />
30<br />
Time To 100% Mod AASHTO: BSM-foam G2 Material 80%OMC<br />
(Mod-U), 10kg Surcharge, Bosch GSH 11E®<br />
Average between 3 Samples<br />
Sample 1<br />
Sample 2<br />
Sample 3<br />
Time (Sec)<br />
25<br />
20<br />
15<br />
10<br />
5<br />
0<br />
Layer1 Layer2 Layer3 Layer4 Layer5<br />
Layers<br />
BSM-foam Bosch GSH 11E®<br />
69
118.0<br />
%Mod AASHTO Vs. Time: BSM-foam G2 Material 80% OMC (Mod-U)<br />
- 10kg Surcharge, Bosch GSH 11E®<br />
116.0<br />
114.0<br />
%Mod AASHTO<br />
112.0<br />
110.0<br />
108.0<br />
106.0<br />
104.0<br />
Layer1<br />
Layer2<br />
Layer3<br />
Layer4<br />
Layer5<br />
102.0<br />
100.0<br />
98.0<br />
0 50 100 150 200 250 300 350<br />
Time (Sec)<br />
Figure L.60: Mod AASHTO Density over time of 80% OMC (MOD-U) 10kg Surcharge, BSMfoam<br />
Bosch GSH 11E®<br />
The refusal density plot of Figure L.60 shows again that the final refusal<br />
density is variable. In this case refusal densities vary from 110% Mod<br />
AASHTO to 116% Mod AASHTO. Layer 1 reaches the highest refusal density<br />
at 116% Mod AASHTO; this is possibly due to the hard steel base against<br />
which it is compacted. The result of this experiment shows how the<br />
moisture content influences the densities. Refusal densities for 80% OMC<br />
(MOD-U) are higher than for 70% OMC (MOD-U).<br />
70
90% OMC (MOD-U) – Bosch GSH 11E®<br />
35<br />
30<br />
25<br />
Time to 100% Mod AASHTO: BSM-foam G2 Material 90% OMC<br />
(Mod-U) -10kg surcharge, Bosch GSH 11E®<br />
Average between 3 Samples<br />
Sample 1<br />
Sample 2<br />
Sample 3<br />
Time (Sec)<br />
20<br />
15<br />
10<br />
5<br />
0<br />
Layer1 Layer2 Layer3 Layer4 Layer5<br />
Layers<br />
Figure L.61: Time to 100% Mod AASHTO compaction at 90% OMC (MOD-U) 10kg Surcharge,<br />
BSM-foam Bosch GSH 11E®<br />
As with the 70% and 80% OMC (MOD-U) BSM-foam curves, the 90% OMC (MOD-<br />
U) curves (Figure L.61) shows the same trend of climbing to the middle layers and<br />
then tapering off at the final layer also there is clear variability in the compaction of<br />
the various samples. The 90% OMC (MOD-U) requires the least amount of time to<br />
reach 100% Mod AASHTO but varies vary little from the 80% OMC (MOD-U) time to<br />
100% Mod AASHTO.<br />
The refusal density plot of Figure L.62 shows a slightly different trend from the<br />
previous two refusal density plots. Here Layer 1 again reaches the highest refusal<br />
density (115.8% Mod AASHTO), but the remaining layers are all concentrated<br />
around the same refusal density point of ± 113% Mod AASHTO. The result of this<br />
experiment also shows that the refusal densities achieved are in the same bracket<br />
as that of the 80% OMC (MOD-U) refusal density plot. Therefore it may be assumed<br />
that there is vary little influence in the compaction for both time and density when<br />
going from 80% to 90% OMC (MOD-U) moisture content.<br />
71
118.0<br />
% Mod AASHTO vs. Time: BSM-foam G2 Material 90% OMC (Mod-U)<br />
- 10kg Surcharge, Bosch GSH 11E®<br />
116.0<br />
114.0<br />
% Mod AASHTO<br />
112.0<br />
110.0<br />
108.0<br />
106.0<br />
104.0<br />
102.0<br />
Layer1<br />
Layer2<br />
Layer3<br />
Layer4<br />
Layer5<br />
100.0<br />
98.0<br />
96.0<br />
0 50 100 150 200 250 300 350<br />
Time (Sec)<br />
Figure L.62: Mod AASHTO Density over time of 90% OMC (MOD-U) 10kg Surcharge, BSMfoam<br />
Bosch GSH 11E®<br />
72
4.3.2.2 15kg Surcharge – Bosch GSH 11E<br />
40<br />
35<br />
30<br />
Time to 100% Mod AASHTO: BSM-foam G2 Material 80% OMC<br />
(Mod-U) -15kg surcharge, Bosch GSH 11E®<br />
Average between 3 Samples<br />
Sample 1<br />
Sample 2<br />
Sample 3<br />
Time (Sec)<br />
25<br />
20<br />
15<br />
10<br />
5<br />
0<br />
Layer1 Layer2 Layer3 Layer4 Layer5<br />
Layers<br />
Figure L.63: Time to 100% Mod AASHTO compaction at 80% OMC (MOD-U) 15kg Surcharge,<br />
BSM-foam Bosch GSH 11E®<br />
The results presented in Figure L.63 show a variation in the behaviour of<br />
the material when compacting under a higher surcharge. Here the curve<br />
climbs, but as apposed to peaking in the middle layer it drops off and the<br />
climbs to the final layer. The characteristic that each layer requires an<br />
individual time to reach 100% Mod AASHTO is still present in this<br />
experiment.<br />
73
120.0<br />
%Mod AASHTO vs. Time: BSM-foam G2 Material 80% OMC (Mod-U)<br />
- 15kg Surcharge, Bosch GSH 11E®<br />
118.0<br />
116.0<br />
% Mod AASHTO<br />
114.0<br />
112.0<br />
110.0<br />
108.0<br />
106.0<br />
Layer1<br />
Layer2<br />
Layer3<br />
Layer4<br />
Layer5<br />
104.0<br />
102.0<br />
100.0<br />
0 50 100 150 200 250 300 350<br />
Time (Sec)<br />
Figure L.64: Mod AASHTO Density over time of 80% OMC (MOD-U) 15kg Surcharge, BSMfoam<br />
Bosch GSH 11E®<br />
The refusal density plot of Figure L.64 also shows that the final refusal<br />
density is variable. Here the refusal densities vary from 112% of Mod<br />
AASHTO density to 118% of Mod AASHTO density. Layer 1 reaches the<br />
highest refusal density at 118% Mod AASHTO; this is possibly due to the<br />
hard steel base against which it is compacted. From this experiment it may<br />
be seen that the result of increasing the surcharge weight has little affect<br />
on the refusal densities achieved, it is seen that after 300 seconds<br />
compaction time densities are still increasing. For the BSM-foam the<br />
compaction was stopped after 5 minutes (300sec) as it is believed that<br />
compaction exceeding 5 minutes is not likely to take place in preparation of<br />
samples. The bracket of refusal densities from this experiment is similar to<br />
that of the 80% and 90% OMC (MOD-U) BSM-foam with the 10kg<br />
surcharge.<br />
74
4.3.3 Comparison between BSM-emulsion and BSM-foam G2<br />
Material<br />
Figures L.65 and L.66 provide a graphic view of the difference in<br />
the response of BSM-emulsion and BSM-foam G2 material to<br />
vibratory hammer compaction. The BSM-emulsion has a more<br />
consistent time to 100% Mod AASHTO compaction where the BSMfoam<br />
has a clear curve to it indicating that each layer requires a<br />
different time to reach 100% Mod AASHTO compaction.<br />
Time to 100% Mod AASHTO Compaction: BSM-emulsion G2<br />
Material 80% OMC(Mod-U) 10kg Surcharge, Kango 637®<br />
70.00<br />
60.00<br />
50.00<br />
Time (S)<br />
40.00<br />
30.00<br />
20.00<br />
10.00<br />
0.00<br />
Layer1 Layer2 Layer3 Layer4 Layer5<br />
Layers<br />
Figure L.65: Time to 100% Mod AASHTO compaction at 80% OMC (MOD-U) – 10kg Surcharge<br />
BSM-emulsion, Kango 637®<br />
75
Time To 100% Mod AASHTO: BSM-foam G2 Material 80%OMC<br />
(Mod-U), 10kg Surcharge, Bosch GSH 11E®<br />
35.00<br />
30.00<br />
100% Mod AASHTO<br />
Poly. (100% Mod AASHTO)<br />
25.00<br />
Time (Sec)<br />
20.00<br />
15.00<br />
10.00<br />
5.00<br />
0.00<br />
Layer1 Layer2 Layer3 Layer4 Layer5<br />
Layer<br />
Figure L.66: Time to 100% Mod AASHTO compaction at 80% OMC (MOD-U) 10kg Surcharge,<br />
BSM-foam Bosch GSH 11E®<br />
76
4.4 Time as a Fixed Unit with a Constant Moisture Content and Set<br />
Dead Load: G2 Material<br />
4.4.1 Vibratory Table: 50kg Dead Load<br />
4.4.1.1 BSM-emulsion<br />
The criteria used for the vibratory table was taken from the TMH1<br />
Revised Addition (1990). The frequency for the table was set at<br />
0.5Hz. Vibratory table compaction was done using a dead load of<br />
50kg and the samples were compacted in 5 layers until 100%<br />
Mod AASHTO density was achieved. The experiment was<br />
conducted using two samples for an experiment and the average<br />
time to obtain 100% Mod AASHTO Density of the three samples<br />
was used to plot Figure L.67.<br />
Figure L.67: Comparison of Vibratory Table to Kango 637® Vibratory Hammer 10kg<br />
Time to 100% Mod AASHTO - Vibratory Table vs. Kango 637® with<br />
10kg Surcharge: BSM-emulsion G2 Material 80% OMC (Mod-U)<br />
70<br />
60<br />
Vibratory Table<br />
Kango 637 ®<br />
50<br />
Time (Sec)<br />
40<br />
30<br />
20<br />
10<br />
0<br />
Layer1 Layer2 Layer3 Layer4 Layer5<br />
Layer<br />
Surcharge: 80% OMC (MOD-U) BSM-emulsion G2 Material<br />
The results of Figure L.67 show a consistency in the time to<br />
100% Mod AASHTO compaction. The vibratory table requires less<br />
time to compact to the target density of 100% Mod AASHTO<br />
when compared to the vibratory hammer, but the physical labour<br />
involved in using the vibratory table was much more than for the<br />
vibratory hammer. Typical problems that arose during compaction<br />
77
were that the cross bars used to fasten the mould to the table<br />
frequently came loose and the 50kg surcharge (deadweight<br />
placed in the mould) was difficult to keep perpendicular to the<br />
material surface, this resulted in layers not necessarily being level<br />
after compaction but rather have a sloping effect. The end result<br />
of this is that although the vibratory table requires less<br />
compaction time per layer, the overall time to prepare a single<br />
sample was much more for the vibratory table (± 45 – 60min)<br />
than for the vibratory hammer (±30 – 35min) – almost double<br />
the time.<br />
78
4.4.1.2 BSM-foamed<br />
The same procedure for the BSM-emulsion material (sub section<br />
4.3.4.1) was applied to the BSM-foam material.<br />
Time to 100% Mod AASHTO - Vibratory Table vs. Bosch GSH 11E®<br />
10kg surcharge: BSM-foam G2 Material 80% OMC (Mod-U)<br />
90<br />
80<br />
Vibratory Table<br />
Bosch GSH 11E<br />
Time (Sec)<br />
70<br />
60<br />
50<br />
40<br />
30<br />
20<br />
10<br />
0<br />
Layer1 Layer2 Layer3 Layer4 Layer5<br />
Layer<br />
Figure L.68: Comparison of Vibratory Table to Bosch ® Vibratory Hammer 10kg Surcharge:<br />
80% OMC (MOD-U) BSM-foam G2 Material<br />
Upon comparing the vibratory table to the vibratory hammer for the BSMfoam<br />
a similar trend is noted in the vibratory table compaction. The<br />
compaction curve with time climbs and then tapers off at the final layer.<br />
The difference being where in Layer 4 of the BSM-foam the peak occurs for<br />
the vibratory hammer, this same peak occurs at Layer 2 of the vibratory<br />
table. The time it takes for the vibratory table to achieve 100% mod<br />
AASHTO is much higher than for the vibratory hammer, this is the exact<br />
opposite what is seen in Figure L.67 of the BSM-emulsion where less time is<br />
required by the vibratory table to achieve this target density of 100% Mod<br />
AASHTO.<br />
It must be remembered that although a difference between the results of<br />
the BSM-foam and BSM-emulsion is evident, the BSM-foam was compacted<br />
using the Bosch® hammer where the BSM-emulsion was compacted using<br />
the Kango 637®. The results of the correlation experiment between the two<br />
79
vibratory hammers (Figure L.56) indicates that the same trend will occur for<br />
the BSM-emulsion as in the BSM-foam should the Bosch® hammer be used<br />
to compact the BSM-emulsion.<br />
Vibratory Table vs. Bosch GSH 11E® 10kg surcharge: BSM-foam G2<br />
Material 80% OMC (Mod-U) - Final %Mod AASHTO Density<br />
110.00<br />
108.00<br />
Vibratory Table<br />
Bosch GSH 11E<br />
% Mod AASHTO<br />
106.00<br />
104.00<br />
102.00<br />
100.00<br />
98.00<br />
96.00<br />
Layer1 Layer2 Layer3 Layer4 Layer5<br />
Layer<br />
Figure L.69: %Mod AASHTO Compaction after 120sec Compaction Time relative to Bosch GSH<br />
11E® 100% Mod AASHTO<br />
Figure L.69 provides a Graphic view of the relationship of the<br />
vibratory table, when compacting according to the full specification<br />
of TMH1 (1990), compared to the result of compacting the BSMfoam<br />
to 100% Mod AASHTO using the vibratory hammer. Not much<br />
variation is noted in the density of the various layers –from Layer 1<br />
to Layer3; a difference of about 1% is notable. Layer 4, however,<br />
shows significant increase in the density, no explanation can be<br />
given for this increase. Layer 5 shows that the material did not<br />
compact any further than the 100% Mod AASHTO density mark.<br />
As with the BSM-emulsion experiment, the vibratory table required<br />
much more time (±40 – 45min) to prepare a single sample than<br />
that of the Bosch ® vibratory hammer (±25 – 30min).<br />
80
4.4.2 Temperature Variation: BSM-emulsion<br />
From the results of experiments performed earlier the criterion for<br />
these experiments were set up. Results showed that compaction<br />
moisture content of 80% OMC (MOD-U) with a surcharge of 10kg<br />
for the Bosch vibratory hammer, was the best criterion for<br />
representative compaction and was therefore selected for the<br />
performance of further experimentation. From the result of time to<br />
100% Mod AASHTO compaction for this criterion and the correlation<br />
experiment (Figure L.56), times were allocated to each layer as to<br />
what would yield 100% Mod AASHTO compaction.<br />
Figure L.70: % Mod AASHTO Compaction at Fixed Time Units: 80% OMC (MOD-U) 10kg<br />
109.0<br />
108.0<br />
% Mod AASHTO At Fixed Time Units: Temperature Variation BSMemulsion<br />
G2 Material 80% OMC (Mod-U) - Bosch GSH 11E ® 10kg<br />
Surcharge<br />
5 Deg C<br />
15 Deg C<br />
35 Deg C<br />
107.0<br />
%Mod AASHTO<br />
106.0<br />
105.0<br />
104.0<br />
103.0<br />
102.0<br />
101.0<br />
100.0<br />
Layer1 (10 sec) Layer2 (15 sec) Layer3 (15 sec) Layer4 (15 sec) Layer5 (15 sec)<br />
Layer (Time sec)<br />
Surcharge, BSM-foam Bosch GSH 11E®<br />
The temperature of material is a factor which affects compaction;<br />
Figure L.70 shows the effect of the temperature on the compaction<br />
of the material. It is intuitive that at lower temperatures the<br />
material would not compact as well as it would at higher<br />
temperatures. This trend is not seen when comparing the results of<br />
the 5 0 C to 35 0 C experiment. For the 5 0 C and 15 0 C experiments,<br />
material was cooled in a fridge. The material was allowed to stand<br />
over night and was then removed from the fridge and the<br />
temperature measured. When the two bags marked off for the 5 0 C<br />
81
experiment measured 5 0 C a single bag was taken to compact and<br />
the remaining bags placed in the fridge; this kept the bags at their<br />
target temperature as the temperature of the fridge measured<br />
around 5 0 C. The bags marked off for the 15 0 C experiment were<br />
allowed to stand out side of the fridge to warm up to 15 0 C (±2 0 C),<br />
this was done was they had also reached 5 0 C. The trend from the<br />
experiment shows a reversal in the expected trend with the<br />
compatibility of the material becoming poorer as the temperature is<br />
increased.<br />
82
4.4.3 Temperature Variation: BSM-foam<br />
As in sub section 4.4.1 the results of experiments performed earlier<br />
were used to establish the criterion against which these<br />
experiments for the BSM-foam would take place. Results showed<br />
that a moisture content of 80% OMC (MOD-U) with a surcharge of<br />
10kg was the best criterion and as such was used to perform these<br />
experiments. From the result of time to 100% Mod AASHTO<br />
compaction for this criterion times were allocated to each layer as<br />
to what would yield 100% Mod AASHTO compaction.<br />
%Mod AASHTO At Fixed Time Units: Temperature Variation BSM-foam<br />
G2 Material 80% OMC (Mod-U) - Bosch GSH 11E® 10kg Surcharge<br />
108.00<br />
106.00<br />
5 Deg C<br />
15 Deg C<br />
35 Deg C<br />
% Mod AASHTO<br />
104.00<br />
102.00<br />
100.00<br />
98.00<br />
96.00<br />
94.00<br />
L1 (10sec) L2 (28sec) L3 (30sec) L4 (34sec) L5 (30sec)<br />
Layer (Time sec)<br />
Figure L.71: %Mod AASHTO Compaction at Fixed Time Units: 80% OMC (MOD-U) 10kg<br />
Surcharge, BSM-foam Bosch GSH 11E®<br />
As in sub section 4.4.1 the trend of how material compacts at<br />
different temperatures is seen in layers 1 and 2 and when<br />
comparing the 5 0 C to 35 0 C experiment. Material for the 5 0 C and<br />
15 0 C experiment were again prepared by cooling them in a fridge,<br />
however the fridge temperature was not adjusted for the 15 0 C<br />
material. Instead it was cooled to 5 0 C and allowed to stand in the<br />
bags outside the fridge for roughly 30 – 40 minutes. A thermometer<br />
and temperature probe was used to check the material<br />
temperature. Once a bag reached the target temperature of 15 0 C ±<br />
2 0 C, the bag was taken and the material compacted. Therefore no<br />
83
excess water was acquired by the material as a result of melting ice<br />
and no moisture was lost; moisture content readings show that the<br />
moisture obtained for the 15 0 C experiment was around 74%OMC<br />
(MOD-U). It cannot be explained why the compaction trend of<br />
Layers 3, 4 and 5 indicates a drop off in the density achieved at<br />
15 0 C compared with 5ºC.<br />
84
4.5 Moisture Curves of the Vibratory Hammer<br />
4.5.1 BSM-emulsion<br />
The criterion of surcharge mass and compaction time per layer used<br />
in sub section 4.4.1 was applied to this experiment. Here moisture<br />
contents of 60, 70, 80, 90 and 100% OMC (MOD-U) were used.<br />
Compaction was done using the Bosch GSH 11E® and the results<br />
are provided in Figure L.72. The curves provided are the Mod<br />
AASHTO curve for the BSM-emulsion and the moisture content<br />
curve for the vibratory hammer compacted BSM-emulsion.<br />
Moisture Curve Mod AASHTO vs. Vibratory Hammer - Bosch GSH 11E®<br />
10 kg Surcharge: BSM-emulsion G2 Material<br />
2300.00<br />
Vibratory Hammer<br />
2263.00<br />
Mod AASHTO<br />
2250.00<br />
Poly. (Vibratory Hammer)<br />
Dry Density (kg/m3)<br />
2200.00<br />
2190.00<br />
2150.00<br />
2100.00<br />
2050.00<br />
63.4% OMC<br />
91.1% OMC<br />
0 2<br />
3.9%<br />
4<br />
5.6%<br />
6 8 10 12<br />
Moisture Content (%)<br />
Figure L.72: Moisture Curve of Mod AASHTO vs. Vibratory Hammer: BSM-emulsion G2 Material<br />
The result of the BSM-emulsion experiment shows that the OMC<br />
(Vib Treated) point of the vibratory hammer is much higher (almost<br />
30%OMC (MOD-U) higher) than for the Mod AASHTO OMC<br />
(Treated) point. The vibratory hammer curves at 5.6% moisture<br />
content where the Mod AASHTO curves at 3.9% moisture content,<br />
this almost 2% more moisture for the vibratory hammer before it<br />
curves. Analysing the densities, the vibratory hammer achieved a<br />
density of 2263kg/m 3 ; this is much higher than the Mod AASHTO<br />
peak density of 2190kg/m 3 . Another interesting point is that the<br />
85
curve shows that the vibratory hammer is more sensitive to<br />
moisture than the Mod AASHTO compaction. For the information<br />
provided in the table below, the moisture contents ranging from<br />
80% OMC to 100% OMC yield an average density of 102.86% Mod<br />
AASHTO. Taking this average and referring to sub section 4.7.1 Site<br />
Results: BSM-emulsion, the procedure used achieved the 95 th<br />
percentile of the site compaction results of 102.71% Mod AASHTO<br />
at these three moisture contents.<br />
Table L.12: %Mod AASHTO Compaction Achieved Using the Vibratory<br />
Hammer – BSM-emulsion G2 Material<br />
Sample M.C %OMC Achieved Dry Density (kg/m 3 ) % Mod<br />
AASHTO<br />
3 4.96 80.65 2206.76 101.23<br />
4 5.53 89.92 2257.19 103.78<br />
5 6.2 100.81 2245.76 103.59<br />
The average density for the last three samples is 102.86% Mod AASHTO<br />
86
4.5.2 BSM-foam<br />
The criterion of surcharge mass and compaction time per layer used<br />
in sub section 4.4.2 was applied to this experiment. As in sub<br />
section 4.5.1 moisture contents of 60, 70, 80, 90 and 100% OMC<br />
(MOD-U) were used. Compaction was done using the Bosch GSH<br />
11E® and the results are provided in Figure L.73. The curves<br />
provided are the Mod AASHTO curve for the Foam mix material and<br />
the moisture content curve for the vibratory hammer compacted<br />
foam mix material.<br />
Moisture Curve Mod AASHTO vs. Vibratory Hammer - Bosch GSH 11E®<br />
10 kg Surcharge: BSM-foam G2 Material<br />
2320.00<br />
2298.00<br />
Mod AASHTO<br />
Vibratory Hammer<br />
2270.00<br />
Dry Density (kg/m3)<br />
2220.00<br />
2170.00<br />
2138.00<br />
2120.00<br />
2070.00<br />
2020.00<br />
1970.00<br />
71.5% OMC<br />
78% OMC<br />
2 3 4<br />
4.4 4.8<br />
5 6 7 8<br />
Moisture Content (%)<br />
Figure L.73: Moisture Curve of Mod AASHTO vs. Vibratory Hammer: BSM-foam G2 Material<br />
Contrary to sub section 4.5.1 the OMC (Vib BSM-foam) point of the<br />
vibratory hammer is lower than that of the Mod AASHTO OMC<br />
(BSM-foam) point; the difference is not significant, only 7%OMC<br />
(MOD-U) i.e. 0.4% moisture per mass of material. However when<br />
the achieved densities are viewed a clear difference is seen. The<br />
vibratory hammer achieved a density of 2298kg/m 3 ; this is much<br />
higher than the Mod AASHTO peak density of 2138kg/m 3 . The<br />
figure shows that the vibratory hammer achieves higher densities<br />
than the Mod AASHTO compaction at the same moisture contents.<br />
87
Figure L.40 shows, as in Figure L.39, that the vibratory hammer is<br />
more sensitive to moisture than the Mod AASHTO compaction.<br />
The maximum dry density achieved with the Bosch vibratory<br />
hammer using the BSM-foam (2298kg/m 3 ) is slightly higher than<br />
the maximum dry density achieved for the BSM-emulsion (2263<br />
kg/m 3 : Figure L.72). The reason for this could be that the<br />
compaction times per layer of the BSM-emulsion were generally<br />
around 15 seconds per layer, where the BSM-foam experienced<br />
longer compaction time, varying from 28 to 34 seconds depending<br />
on the layer. The BSM-emulsion and BSM-foam show a similar level<br />
of sensitivity to the moisture content. If the incline is taken as a<br />
straight line then the gradients are 2% for the BSM-emulsion and<br />
1.835% for the BSM-foam. From this the BSM-emulsion does<br />
appear slightly more sensitive to moisture. Table L.10 indicates that<br />
the longer compaction time for the BSM-foam does in fact have an<br />
influence on the extent to which the samples were compacted. The<br />
compaction densities achieved for the above curve exceed 100%<br />
Mod AASHTO very comfortably; the density achieved near the peak<br />
is 108.4% Mod AASHTO.<br />
Table L.13: %Mod AASHTO Compaction Achieved Using the Vibratory<br />
Hammer – BSM-foam G2 Material<br />
Sample M.C %OMC Achieved Dry Density (kg/m 3 ) % Mod<br />
AASHTO<br />
1 3.32 53.97 2110.62 103.72<br />
2 3.72 60.55 2215.71 107.14<br />
3 4.09 66.52 2224.55 106.03<br />
4 4.8 78.07 2262.49 105.97<br />
5 5.53 89.9 2178.32 104.48<br />
The average density achieved was 105.47% Mod AASHTO<br />
As with the BSM-emulsion material, these results indicate that at<br />
higher moisture contents higher compaction, in terms of %Mod<br />
AASHTO, is achievable.<br />
88
4.6 Correlation to Site Material and Site Achieved Compaction<br />
In order to correlate the compaction experimentation of the G2 material to<br />
compaction being achieved in the field material was acquired from a Cold in Place<br />
Recycling (CIPR) Project along the N7. On this specific site a CIPR Project had<br />
taken place in 2002/2003 where a lane was treated using BSM-foam. In 2007 a<br />
CIPR Project took place again, but in this specific project BSM-emulsion was used<br />
to treat the appropriate lanes. The field compaction results for the BSM-foam CIPR<br />
were obtained from HL Theyse, CR-2003/23. The field compaction results and<br />
relevant field information for the BSM-emulsion CIPR were respectively obtained<br />
from Soil Lab and the engineers responsible for the project. The field results for<br />
the respective mixes are provided in the statistical analysis section of this report.<br />
Under this section (4.6) results marked N7 material are the results of the milled N7<br />
material treated with either bitumen emulsion or foamed bitumen and then<br />
compacted in the laboratory.<br />
4.6.1 BSM-emulsion<br />
The criteria of moisture content, surcharge mass and compaction<br />
time per layer used in sub section 4.4.1 was applied to this<br />
experiment. Compaction was done using the Bosch GSH 11E® and<br />
the results are provided in Figure L.74 The figure indicates how the<br />
N7 material correlates to the G2 material when using the same<br />
criterion when both materials have been treated with bitumen<br />
emulsion. From the statistical analysis results of site compacted<br />
material, the 85 th percentile was chosen as the target density mark,<br />
this in tern showed that the target dry density of the site<br />
compacted material which would give its equivalent 100% Mod<br />
AASHTO was 2138kg/m 3 , this is the target dry density of the N7<br />
BSM-emulsion.<br />
89
% Target Dry Density<br />
110.0<br />
108.0<br />
106.0<br />
104.0<br />
102.0<br />
100.0<br />
98.0<br />
96.0<br />
Comparison Between G2 & N7 Compacted Material:<br />
80% OMC (Mod-U), Bosch GSH 11E® 10kg Surcharge, BSM-emulsion<br />
N7 Material<br />
5 Deg C G2<br />
15 Deg C G2<br />
35 Deg C G2<br />
94.0<br />
92.0<br />
90.0<br />
Layer1 (10 sec) Layer2 (15 sec) Layer3 (15 sec) Layer4 (15 sec) Layer5 (15 sec)<br />
Layers (Compaction Time in seconds)<br />
Figure L.74: Comparison of G2 and N7 Material: BSM-emulsion<br />
What becomes immediately clear is that the criterion for the clean<br />
G2 material does not work for the N7 material. The N7 material<br />
never reaches 100% of the achieved site density. The main reason<br />
for this is the grading. From the grading curves presented in the<br />
Methodology section it is clear that the grading between the G2<br />
material and N7 material differ. Material properties also differ, this<br />
because although the N7 material is of G2 quality, it contains RAP in<br />
it as a result of the milling process; traces of cement may also be<br />
present should the base have been treated with cement during the<br />
initial construction of the road.<br />
4.6.2 BSM-foam<br />
The criterion of surcharge mass and compaction time per layer used<br />
in sub section 4.4.2 was applied to this experiment. Compaction<br />
was done using the Bosch GSH 11E® Hammer and the results are<br />
provided in Figure L.75. The figure shows how the N7 material<br />
correlates to the G2 material when using the same criterion when<br />
both materials have been treated with foamed bitumen. A statistical<br />
analysis was also performed on the results of site compacted<br />
material taken from the CSIR report CR 2003/23 (Theyse, 2003);<br />
the mean dry density was chosen as the target density to which the<br />
N7 material would be compacted. This is due to the fact that on the<br />
90
BSM-foam CIPR site compaction never reached 100% Mod AASHTO<br />
compaction. The mean density was found to be 2177.33kg/m 3 .<br />
Figure L.75: Comparison of G2 and N7 Material: BSM-foam<br />
Comparison Between G2 & N7 Compacted Material:<br />
80% OMC (Mod-U), Bosch GSH 11E® 10kg Surcharge, BSM-foam<br />
108.0<br />
Comparison between G2 & N7 compacted Material: Foamed <strong>Mix</strong><br />
108.00<br />
106.00<br />
104.00<br />
% Target Dry Density<br />
102.00<br />
100.00<br />
98.00<br />
96.00<br />
94.00<br />
92.00<br />
N7 Material<br />
5 Deg C G2<br />
15 Deg C G2<br />
35 Deg C G2<br />
90.00<br />
88.00<br />
Layers (Compaction Time in seconds)<br />
L1 (10s) L2(28s) L3 (30s) L4 (34s) L5 (30s)<br />
Layer (time sec)<br />
As in sub section 4.6.1 it is immediately clear that the criterion for<br />
the clean G2 material does not work for the N7 material. Once<br />
again the N7 material never reaches 100% of the achieved site<br />
density. The main reason for this is the reason discussed in sub<br />
section 4.6.1 regarding the grading and material properties.<br />
It is also clear that the mix type, BSM-foam or BSM-emulsion, is not<br />
the cause of this behaviour of the N7 material. Densities achieved<br />
for both mixes of the N7 material are similar e.g. layer 1 in both<br />
cases is around 96% of the of the achieved site density.<br />
91
4.7 Statistical Results<br />
4.7.1 Site Results: BSM-emulsion<br />
Statistical Calculations: N7 Site Information -<br />
Emulsion <strong>Mix</strong><br />
%Mod Aashto<br />
n Dry Density %Mod Aashto<br />
1 2181 101.6<br />
2 2227 103.6<br />
3 2255 104.2<br />
4 2255 104.7<br />
5 2272 106.1<br />
6 2287 106.2<br />
7 2305 107.4<br />
8 2323 107.5<br />
9 2345 108.9<br />
10 2345 109.6<br />
11 2350 110.1<br />
12 2367 110.7<br />
Percentile<br />
Mean = 106.72 % 75th : 104.61 %<br />
Std Dev = 2.83 % 85th : 103.99 %<br />
COV = 2.65 % 95th : 102.71 %<br />
Outliers<br />
n = 12<br />
x0 = 101.6<br />
|T0| = 1.81<br />
T = 2.29<br />
|T0|
The results of this statistical analysis show that the compaction<br />
results on site have vary little variation; this is seen in COV value of<br />
2.48%. It is interesting to note that on average, the dry density<br />
achieved on site was in the order of 106% of Mod AASHTO density,<br />
these are very high levels of compaction and the level of variation<br />
was also very low, COV equalling 2.65%.<br />
93
4.7.2 Site Results: BSM-foam<br />
Foam <strong>Mix</strong> on N7<br />
First Level analysis report:<br />
HVS Testing of the Foamed<br />
Bitumen-Treated crushed<br />
Stone Base on N7/1 near<br />
Cape Town Version: 1st draft<br />
CSIR transportek<br />
Pages 13, 14, 15<br />
Fig 14 and Fig 15<br />
Summary of the pavement and instrumentation detail detail of of the the test tst sections<br />
Binder type 60/70<br />
Binder Content 2.50 %<br />
Field Dry Density (Fig 14)<br />
Field Dry Density (Fig 15)<br />
2137 kg/m3<br />
2166 kg/m3<br />
Appendix C: rehabilitation investigation<br />
Distance (km) Field Dry Density Mod AASHTO Dry Density<br />
17.7 2109 kg/m3 2260 kg/m3<br />
16 2148 kg/m3<br />
14 2146 kg/m3<br />
11.99 2224 kg/m3<br />
10 2218 kg/m3<br />
7.8 2219 kg/m3<br />
Mean = 2177.33 kg/m3<br />
St Deviation = 49.15 kg/m3<br />
C.O.V = 2.26 %<br />
The results of this statistical analysis show, as in the analysis of the<br />
BSM-emulsion CIPR, that the compaction results on site have very<br />
little variation; The COV value for the BSM-foam is 2.26%. In<br />
contrast to the field compaction of the BSM-emulsion, the BSMfoam<br />
never obtained its 100% Mod AASHTO level of compaction;<br />
on average a compaction density of 96.34% Mod AASHTO was<br />
achieved.<br />
Overall, the statistical results from field compaction indicate that the<br />
extent to which field compaction varies is very low. The BSMemulsion<br />
and BSM-foam CIPR results had COV’s of 2.48% and<br />
94
2.26% respectively.<br />
95
4.7.3 Laboratory BSM-emulsion G2 Material<br />
10kg Surcharge<br />
70% OMC<br />
Sample1<br />
Sample2<br />
Time to 100%<br />
Mod AASHTO<br />
(sec)<br />
Time to 100%<br />
Mod AASHTO<br />
(sec)<br />
STD C.O.V<br />
Layer<br />
Mean Dev (%)<br />
Layer1 30 15 22.50 10.61 47.14<br />
Layer2 60 15 37.50 31.82 84.85<br />
Layer3 45 60 52.50 10.61 20.20<br />
Layer4 30 45 37.50 10.61 28.28<br />
Layer5 30 30 30.00 0.00 0.00<br />
Mean 39.00 33.00 36.00<br />
STD Dev 13.42 19.56 16.49<br />
C.O.V (%) 34.40 59.27 46.83<br />
80% OMC<br />
Sample1 Sample2 Sample3<br />
Time to 100%<br />
Mod AASHTO<br />
(sec)<br />
Time to 100%<br />
Mod AASHTO<br />
(sec)<br />
Time to 100%<br />
Mod AASHTO<br />
(sec)<br />
STD C.O.V<br />
Layer<br />
Mean Dev (%)<br />
Layer1 35 55.37 50.28 46.88 10.60 22.61<br />
Layer2 41 60.73 36 45.91 13.08 28.48<br />
Layer3 51.1 55.82 29.86 45.59 13.83 30.33<br />
Layer4 60 62.01 122 81.34 35.23 43.31<br />
Layer5 25 58.41 75.37 52.93 25.63 48.42<br />
Mean 42.42 58.47 62.70 54.53<br />
STD Dev 13.65 2.93 37.49 18.02<br />
C.O.V (%) 32.17 5.01 59.79 32.32<br />
96
90% OMC<br />
Sample1 Sample2 Sample3<br />
Time to 100%<br />
Mod AASHTO<br />
(sec)<br />
Time to 100%<br />
Mod AASHTO<br />
(sec)<br />
Time to 100%<br />
Mod AASHTO<br />
(sec)<br />
STD C.O.V<br />
Layer<br />
Mean Dev (%)<br />
Layer1 12.52 11.65 10.93 11.70 0.80 6.80<br />
Layer2 15.77 12.77 9.81 12.78 2.98 23.31<br />
Layer3 9.47 13.29 9.6 10.79 2.17 20.11<br />
Layer4 10.45 17.19 12.57 13.40 3.45 25.71<br />
Layer5 11.72 14.9 13.07 13.23 1.60 12.06<br />
Mean 11.99 13.96 11.20 12.38<br />
STD Dev 2.42 2.15 1.58 2.05<br />
C.O.V (%) 20.16 15.41 14.08 16.55<br />
15kg Surcharge<br />
80% OMC<br />
Sample1 Sample2 Sample3<br />
Time to 100%<br />
Mod AASHTO<br />
(sec)<br />
Time to 100%<br />
Mod AASHTO<br />
(sec)<br />
Time to 100%<br />
Mod AASHTO<br />
(sec)<br />
STD C.O.V<br />
Layer<br />
Mean Dev (%)<br />
Layer1 67.44 53 81.85 67.43 14.43 21.39<br />
Layer2 28.68 23.47 40.37 30.84 8.65 28.06<br />
Layer3 35.74 24.59 42.42 34.25 9.01 26.30<br />
Layer4 25.89 26 39.57 30.49 7.87 25.80<br />
Layer5 18.24 25.33 37.4 26.99 9.69 35.89<br />
Mean 35.20 30.48 48.32 38.00<br />
STD Dev 19.08 12.63 18.83 16.85<br />
C.O.V (%) 54.21 41.42 38.97 44.87<br />
97
20kg Surcharge<br />
70% OMC<br />
Sample1 Sample2 Sample3<br />
Time to 100%<br />
Mod AASHTO<br />
(sec)<br />
Time to 100%<br />
Mod AASHTO<br />
(sec)<br />
Time to 100%<br />
Mod AASHTO<br />
(sec)<br />
STD C.O.V<br />
Layer<br />
Mean Dev (%)<br />
Layer1 130 210 110 150.00 52.92 35.28<br />
Layer2 25 90 86 67.00 36.43 54.37<br />
Layer3 25 46 165 78.67 75.50 95.98<br />
Layer4 63 45 170 92.67 67.57 72.92<br />
Layer5 32 60 145 79.00 58.85 74.49<br />
Mean 55.00 90.20 135.20 93.47<br />
STD Dev 44.77 69.39 36.23 50.13<br />
C.O.V (%) 81.40 76.93 26.80 61.71<br />
80% OMC<br />
Sample1 Sample2 Sample3<br />
Time to 100%<br />
Mod AASHTO<br />
(sec)<br />
Time to 100%<br />
Mod AASHTO<br />
(sec)<br />
Time to 100%<br />
Mod AASHTO<br />
(sec)<br />
STD C.O.V<br />
Layer<br />
Mean Dev (%)<br />
Layer1 17.3 18.87 20 18.72 1.36 7.24<br />
Layer2 12.8 22 20.99 18.60 5.05 27.13<br />
Layer3 16.32 28.03 12.28 18.88 8.18 43.34<br />
Layer4 13 22.3 23.13 19.48 5.62 28.88<br />
Layer5 24.91 18.37 16.44 19.91 4.44 22.30<br />
Mean 16.87 21.91 18.57 19.12<br />
STD Dev 4.92 3.85 4.27 4.35<br />
C.O.V (%) 29.15 17.58 22.98 23.24<br />
98
The statistical results of the laboratory experimentation provided on<br />
the previous two pages show that for a 10kg surcharge the<br />
moisture content of 90% OMC (Mod-U) required, on average, the<br />
least amount of time to compact a layer to 100% Mod AASHTO,<br />
12.38sec. The interesting result from this analysis is that on<br />
average at 70% OMC (Mod-U) less time is required to compact a<br />
layer to 100% Mod AASHTO density when compared to 80% OMC<br />
(Mod-U); at 70% OMC (Mod-U) 36sec is the average time to<br />
compact a layer to 100% Mod AASHTO where at 80% OMC (Mod-<br />
U) it is 54.53sec, this is not what is expected as the moisture<br />
content is increased.<br />
It is also notable that for the 10kg surcharge the 90% OMC (Mod-<br />
U) has a lower standard deviation (Std Dev) and coefficient of<br />
variation (COV). The Std Dev is only 2 seconds and the COV is<br />
16.55%. The COV may be regarded as high, but when compared to<br />
the 70% and 80% OMC (Mod-U) of 46.83% and 32.32%<br />
respectively, it is much lower.<br />
The 15kg surcharge at 80% OMC (Mod-U) shows a consistency,<br />
statisticaly, to the 10kg surcharge of 70% OMC (Mod-U). The mean<br />
time to 100% Mod AASHTO differs by only 2 sec and the Std Dev<br />
for 15kg surcharge is 16.85sec compared to the 16.49sec of the<br />
10kg surcharge at 70% OMC (Mod-U). The COV’s are also very<br />
similar, 44.87% for the 15kg surcharge and 46.83% for the 10kg<br />
surcharge at 70% OMC (Mod-U). This result of the 15kg surcharge<br />
indicates that similar behaviour of the material will occur when it is<br />
compacted at 70% OMC (Mod-U) with a 10kg surcharge.<br />
The trend differs when a 20kg surcharge is used. At 70% OMC<br />
(Mod-U) the mean time to 100% Mod AASHTO more than doubles,<br />
from 36sec at 10kg surcharge to 93.47 sec at 20kg. The Standard<br />
Deviation and COV also increase dramatically from 16.49sec to<br />
50.13sec and from 46.83% to 61.71% respectively. The resulting<br />
effect is that as the surcharge load is increased, the material<br />
becomes less responsive to compaction at 70% OMC (Mod-U). This<br />
is due to the effect that at a higher surcharge load there is less<br />
vibratory/impact affect and more of a general vibratory effect.<br />
99
The trend for 80% OMC (Mod-U) with a 20kg surcharge has the<br />
opposite effect to that of the 70% OMC (Mod-U) of the previous<br />
paragraph. The mean time to 100% Mod AASHTO more than halves<br />
and the Std Dev is almost one quarter of the Std Dev for the 10kg<br />
surcharge. The COV however does not drop as dramatically as the<br />
Standard Deviation and mean time to 100% Mod AASHTO; it does<br />
however drop significantly, i.e. by 10%.<br />
100
Temperature Variation: 10kg Surcharge 80% OMC (MOD-U)<br />
5 Deg Celscius<br />
Sample1<br />
Sample2<br />
STD<br />
Dev<br />
C.O.V<br />
(%)<br />
% Mod AASHTO % Mod AASHTO<br />
Layer Achieved Achieved Mean<br />
Layer1 (10s) 108.59 107.39 107.99 0.84 0.78<br />
Layer2 (15s) 106.66 106.44 106.55 0.16 0.15<br />
Layer3 (15s) 107.62 106.44 107.03 0.83 0.77<br />
Layer4 (15s) 105.73 105.51 105.62 0.15 0.15<br />
Layer5 (15s) 107.62 106.44 107.03 0.83 0.77<br />
Mean 107.24 106.45 106.84<br />
STD Dev 1.09 0.67 0.88<br />
C.O.V (%) 1.01 0.63 0.82<br />
15 Deg Celscius<br />
Sample1<br />
Sample2<br />
STD<br />
Dev<br />
C.O.V<br />
(%)<br />
% Mod AASHTO % Mod AASHTO<br />
Layer Achieved Achieved Mean<br />
Layer1 (10s) 105.30 107.54 106.42 1.58 1.48<br />
Layer2 (15s) 107.18 108.50 107.84 0.93 0.87<br />
Layer3 (15s) 105.30 105.65 105.48 0.25 0.23<br />
Layer4 (15s) 105.30 105.65 105.48 0.25 0.23<br />
Layer5 (15s) 107.18 106.58 106.88 0.42 0.40<br />
Mean 106.05 106.78 106.42<br />
STD Dev 1.03 1.24 1.13<br />
C.O.V (%) 0.97 1.16 1.07<br />
35 Deg Celscius<br />
Sample1<br />
Sample2<br />
STD<br />
Dev<br />
C.O.V<br />
(%)<br />
% Mod AASHTO % Mod AASHTO<br />
Layer Achieved Achieved Mean<br />
Layer1 (10s) 105.13 104.99 105.06 0.10 0.09<br />
Layer2 (15s) 103.32 103.15 103.23 0.12 0.11<br />
Layer3 (15s) 107.01 102.25 104.63 3.36 3.21<br />
Layer4 (15s) 103.32 103.15 103.23 0.12 0.11<br />
Layer5 (15s) 106.06 103.15 104.61 2.06 1.97<br />
Mean 104.97 103.34 104.15<br />
STD Dev 1.65 1.00 1.32<br />
C.O.V (%) 1.57 0.97 1.27<br />
101
The statistical results of the temperature variation experiment for<br />
the BSM-emulsion show the reverse of the expected trend. The<br />
trend is expected to show that as the material becomes warmer the<br />
compaction will become better, but the opposite of this is reflected<br />
from the results of this experiment. The reason for this is unclear.<br />
The COV values across the samples show that the variability of the<br />
results is very low, COV being in the order of 1 for all three<br />
temperatures. When viewed independently, the 35 0 C experiment<br />
produced the largest amount of variation (COV averaging 1.27%)<br />
and the 5 0 C experiment showed the least amount of variation (COV<br />
averaging 0.82%), but the difference in COV values between the<br />
35 0 C and the 5 0 C experiment is 0.45%, this is extremely small and<br />
may even be ignored. This shows that the temperature at which<br />
samples are prepared does not influence the variability of the<br />
samples, i.e. the variation in the level of compaction across samples<br />
prepared at 5 0 C will not be more or less variable than the variation<br />
in the level of compaction across samples prepared at 35 0 C in terms<br />
of the COV values.<br />
102
4.7.4 Laboratory BSM-foam G2 Material<br />
10kg Surcharge<br />
70% OMC<br />
Sample1 Sample2 Sample3<br />
Time to 100%<br />
Mod AASHTO<br />
(sec)<br />
Time to 100%<br />
Mod AASHTO<br />
(sec)<br />
Time to 100%<br />
Mod AASHTO<br />
(sec)<br />
STD C.O.V<br />
Layer<br />
Mean Dev (%)<br />
Layer1 150 150 180 160.00 17.32 10.83<br />
Layer2 180 150 180 170.00 17.32 10.19<br />
Layer3 180 180 210 190.00 17.32 9.12<br />
Layer4 180 180 150 170.00 17.32 10.19<br />
Layer5 180 180 150 170.00 17.32 10.19<br />
Mean 174.00 168.00 174.00 172.00<br />
STD Dev 13.42 16.43 25.10 18.32<br />
C.O.V (%) 7.71 9.78 14.43 10.64<br />
80% OMC<br />
Sample1 Sample2 Sample3<br />
Time to 100%<br />
Mod AASHTO<br />
(sec)<br />
Time to 100%<br />
Mod AASHTO<br />
(sec)<br />
Time to 100%<br />
Mod AASHTO<br />
(sec)<br />
STD C.O.V<br />
Layer<br />
Mean Dev (%)<br />
Layer1 5.44 6.02 5.81 5.76 0.29 5.10<br />
Layer2 19.67 21.78 21.64 21.03 1.18 5.61<br />
Layer3 37.92 22.73 15.26 25.30 11.55 45.63<br />
Layer4 29.46 38 20.12 29.19 8.94 30.63<br />
Layer5 14.26 37 31.61 27.62 11.88 43.02<br />
Mean 21.35 25.11 18.89 21.78<br />
STD Dev 12.71 13.12 9.42 11.75<br />
C.O.V (%) 59.55 52.26 49.89 53.90<br />
90% OMC<br />
Sample1 Sample2 Sample3<br />
Time to 100%<br />
Mod AASHTO<br />
(sec)<br />
Time to 100%<br />
Mod AASHTO<br />
(sec)<br />
Time to 100%<br />
Mod AASHTO<br />
(sec)<br />
STD C.O.V<br />
Layer<br />
Mean Dev (%)<br />
Layer1 5.62 8 6.25 6.62 1.23 18.62<br />
Layer2 16.63 14.33 21.07 17.34 3.43 19.75<br />
Layer3 14.71 17.77 29.93 20.80 8.05 38.70<br />
Layer4 12.94 21.73 19.1 17.92 4.51 25.17<br />
Layer5 14.15 18.83 18.93 17.30 2.73 15.78<br />
Mean 12.81 16.13 19.06 16.00<br />
STD Dev 4.23 5.26 8.46 5.98<br />
C.O.V (%) 33.05 32.61 44.40 36.69<br />
103
15kg Surcharge<br />
80% OMC<br />
Sample1 Sample2 Sample3<br />
Layer<br />
Time to<br />
100% Mod<br />
AASHTO<br />
(sec)<br />
Time to<br />
100% Mod<br />
AASHTO<br />
(sec)<br />
Time to<br />
100% Mod<br />
AASHTO<br />
(sec) Mean<br />
STD<br />
Dev<br />
C.O.V<br />
(%)<br />
Layer1 8.93 6.92 8.38 8.08 1.04 12.86<br />
Layer2 31.65 21.67 25.45 26.26 5.04 19.19<br />
Layer3 21.42 17.41 16.94 18.59 2.46 13.24<br />
Layer4 27.27 26.57 19.92 24.59 4.06 16.50<br />
Layer5 35.11 19.99 26.16 27.09 7.60 28.07<br />
Mean 24.88 18.51 19.37 20.92<br />
STD Dev 10.28 7.29 7.25 8.27<br />
C.O.V (%) 41.32 39.39 37.41 39.37<br />
The statistical results of the BSM-foam experiments show the<br />
expected trend with regard to the moisture content. Under the 10kg<br />
surcharge, the mean time it takes to compact a layer to 100% Mod<br />
AASHTO density decreases as the moisture content increases. The<br />
70% OMC (Mod-U) has a mean time of 172sec, at 80% OMC (Mod-<br />
U) the mean time is 21.78sec and at 90% OMC (Mod-U) the mean<br />
time is 16sec. From this it is evident that at 70% OMC (Mod-U)<br />
compaction time to 100% Mod AASHTO is too high and therefore<br />
inadequate to be used to produce samples. The mean time for the<br />
80% and 90% OMC (Mod-U) moisture contents are much smaller<br />
and differ by 5.78 sec. The 80% OMC (Mod-U) is the best option in<br />
this case as the extra 5.78sec do not hamper production time and<br />
will provide time to allow for adequate particle orientation during<br />
compaction.<br />
From the results it is also seen that as the moisture content<br />
increases under the 10kg surcharge the Standard deviation also<br />
reduces as des the mean time to 100% Mod AASHTO. As with the<br />
BSM-emulsion experiments the 90% OMC (Mod-U) has the lowest<br />
Standard deviation under the 10kg surcharge. Interestingly, where<br />
the 70% OMC (Mod-U) of the BSM-emulsion under the 10g<br />
surcharge has the highest COV, this is not the case with the BSMfoam.<br />
Instead at 70% OMC (Mod-U) the BSM-foam has the lowest<br />
COV with the 80% OMC (Mod-U) having the highest COV. This<br />
indicates that although the 80% OMC (Mod-U) provides the most<br />
104
adequate compaction time to 100% Mod AASHTO, it is also the<br />
moisture content that provides the most variable results, where,<br />
although the 70% OMC (Mod-U) takes the longest to compact to<br />
100% Mod AASHTO, it also provides the results with the least<br />
variation.<br />
The 15kg surcharge at 80% OMC (Mod-U) has a mean time to<br />
100% Mod AASHTO compaction similar to the 10kg surcharge at<br />
80% OMC (Mod-U); less than 1 second difference between the two<br />
surcharges. The Std dev and COV under this surcharge are however<br />
much lower than the Std dev and COV under the 10kg surcharge.<br />
This means less variability in the compaction results. The results<br />
also indicate that the 15kg surcharge may be used as an alternative<br />
surcharge mass to the 10kg surcharge at 80% OMC (Mod-U); this<br />
may be done to reduce the variability of the compaction results.<br />
105
Temperature Variation: 80% OMC (Mod-U) 10kg Surcharge<br />
5 Deg Celscius<br />
Sample1 Sample2 Sample3<br />
% Mod AASHTO % Mod AASHTO % Mod AASHTO<br />
STD C.O.V<br />
Layer Achieved Achieved Achieved Mean Dev (%)<br />
Layer1 (10s) 96.36 96.98 103.19 98.84 3.78 3.82<br />
Layer2 (28s) 101.18 100.21 103.19 101.53 1.52 1.50<br />
Layer3 (30s) 104.67 103.67 101.46 103.26 1.64 1.59<br />
Layer4 (34s) 105.58 100.21 102.32 102.70 2.70 2.63<br />
Layer5 (30s) 108.41 101.91 104.08 104.80 3.31 3.16<br />
Mean 103.24 100.60 102.85 102.23<br />
STD Dev 4.63 2.48 1.00 2.70<br />
C.O.V (%) 4.49 2.46 0.97 2.64<br />
15 Deg Celscius<br />
Sample1 Sample2 Sample3<br />
% Mod AASHTO % Mod AASHTO % Mod AASHTO<br />
STD C.O.V<br />
Layer Achieved Achieved Achieved Mean Dev (%)<br />
Layer1 (10s) 100.96 105.67 103.32 3.33 3.22<br />
Layer2 (28s) 105.39 102.96 104.18 1.72 1.65<br />
Layer3 (30s) 104.47 102.09 103.28 1.69 1.63<br />
Layer4 (34s) 101.82 102.09 101.95 0.19 0.19<br />
Layer5 (30s) 102.69 104.75 103.72 1.46 1.41<br />
Mean 103.07 103.51 103.29<br />
STD Dev 1.84 1.62 1.73<br />
C.O.V (%) 1.78 1.57 1.68<br />
35 Deg Celscius<br />
Sample1 Sample2 Sample3<br />
% Mod AASHTO % Mod AASHTO % Mod AASHTO<br />
STD C.O.V<br />
Layer Achieved Achieved Achieved Mean Dev (%)<br />
Layer1 (10s) 101.20 100.55 107.85 103.20 4.04 3.92<br />
Layer2 (28s) 106.53 105.84 105.96 106.11 0.37 0.34<br />
Layer3 (30s) 105.60 105.84 105.96 105.80 0.18 0.17<br />
Layer4 (34s) 105.97 104.63 105.96 105.52 0.77 0.73<br />
Layer5 (30s) 103.80 107.73 105.96 105.83 1.97 1.86<br />
Mean 104.62 104.92 106.34 105.29<br />
STD Dev 2.17 2.68 0.85 1.90<br />
C.O.V (%) 2.07 2.56 0.80 1.81<br />
106
The expected compactability trend between the 5 0 C and 35 0 C is<br />
seen, as the 35 0 C experiment had a mean dry density of 105.29%<br />
Mod AASHTO and the 5 0 C experiment had a mean dry density of<br />
102.23% Mod AASHTO across the three samples of both<br />
temperatures. The statistical results show that the influence of the<br />
variation of the 15 0 C experiment from the expected trend was from<br />
Sample 1. At 15 0 C Samples 2 and 3 both produced mean densities<br />
of 103% Mod AASHTO, this is consistent with the expected trend,<br />
but Sample 1 produced a mean layer density of 99.37% of Mod<br />
AASHTO density, this is completely out of the expect compaction<br />
trend therefore another sample should be prepared and compacted<br />
so as to establish the trend.<br />
Looking at the average COV of the three samples, excluding<br />
sample1 of the 15 0 C experiment, for each temperature the<br />
statistical results for the temperature variation experiments of the<br />
BSM-foam indicate that at 15 0 C variability of the compaction results<br />
are the lowest while the temperature that produced the most<br />
variable results is at 5 0 C.<br />
107
4.7.5 COV values of the vibratory hammer for BSM specimens<br />
after determining the actual final mass and Dry Density<br />
The statistical calculations provided previously were all based on<br />
specimens in ideal circumstances, i.e. the calculated mass of<br />
material placed into the mould is the mass of the specimen that is<br />
produced. This is in reality not the case. Excessively wet samples<br />
tended to loose mass as material seeped out between the mould<br />
walls and the vibratory hammer foot piece (tamping foot).<br />
Therefore the final actual mass and Dry Density of each BSM<br />
specimen was noted, the Dry Density was then calculated. The<br />
results for the temperature variation experiments were then<br />
statistically analysed and the COV values for each temperature was<br />
determined. The results are as follows:<br />
Table L14: COV of vibratory hammer<br />
COV* of BSM<br />
Temperature<br />
Emulsion Foam<br />
5 0 C 0.13 0.24<br />
15 0 C 0.39 0.42<br />
35 0 C 0.84 2.34<br />
*COV is of the vibratory hammer compaction<br />
The results show, as the previous statistical analysis showed, that<br />
as the temperature at which compaction takes place increases so to<br />
does the variability of the mixes increase. Generally the COV values<br />
are very low, i.e. they are comfortably below 1. The BSM-foam at<br />
35 0 C however is well above 2, this jump is significant. The reason<br />
for this is that of the three specimens compacted the third<br />
specimen produced a final Dry Density almost 4% higher than the<br />
first 2 specimens.<br />
The results shown in Table L14 also show that the BSM-emulsion<br />
produced specimens with less variability than did the BSM-foam. At<br />
15 0 C however the variability between the two mixes is very similar.<br />
108
4.7.6 Comparing the COV values of the vibratory hammer to the<br />
COV value of the Mod AASHTO compaction method<br />
The COV determined in Table L14, was then compared to the COV<br />
of the Mod AASHTO compaction method. The COV of the Mod<br />
AASHTO was determined by taking G5 material and compacting 4<br />
specimens at the same moisture content. This was done so as to<br />
determine the repeatability of the Mod AASHTO compaction<br />
method. The G5 material was not treated with cold mix bitumen,<br />
only water was added. The COV of the Mod AASHTO is shown<br />
below:<br />
• COV ModAASHTO = 0.45%<br />
When this COV is compared to the vibratory hammer COV values, it<br />
is found that generally the vibratory hammer COV is less than the<br />
Mod AASHTO COV. This is however not the case when the vibratory<br />
hammer was used to compact material warmer than room<br />
temperature (25 0 C).<br />
COV of the vibratory hammer: BSM-emulsion and BSM-foam<br />
COV (%)<br />
2.5<br />
2<br />
1.5<br />
1.12<br />
1<br />
BSM-emulsion<br />
BSM-foam<br />
Poly. (BSM-foam)<br />
Poly. (BSM-emulsion)<br />
0.63<br />
0.5<br />
0<br />
0 5 10 15 20 25 30 35 40<br />
Temperature (Degrees Celcius)<br />
Figure L.76: Projection of COV values of vibratory hammer at room temperature<br />
Figure L.76 shows that the COV of the vibratory hammer at room<br />
temperature is higher than the Mod AASHTO COV. The BMSemulsion<br />
produces a COV of 0.63 which is close to the Mod<br />
AASHTO COV of 0.45. The BSM-foam however produces a COV of<br />
109
1.12. This is significantly higher than the Mod AASHTO COV<br />
although it is still statistically low.<br />
110
4.8 CT Scanning<br />
CT scanning was used to determine the voids condition of the various compacted<br />
samples. The sections shown in this report are of the middle scans of each of the<br />
samples scanned.<br />
Sample 1: S1<br />
Section<br />
150mm<br />
Middle<br />
scan<br />
Middle<br />
scan<br />
Top:<br />
S1B<br />
Middle:<br />
S1A<br />
75mm<br />
75mm<br />
Emulsion BSM-emulsion:<br />
<strong>Mix</strong>:<br />
Vibratory Hammer Hammer<br />
Figure L.77: CT scan S1B - Middle scan<br />
Figure L.78: CT scan S1A - Middle scan<br />
From Figure L.77 and figure L.78 it appears that the voids content in S1A are in fact higher<br />
than in S1B.<br />
111
S1B<br />
85<br />
E<br />
75<br />
65<br />
Scan slice nummer (boorkern lengte in mm).<br />
55<br />
45<br />
35<br />
25<br />
S<br />
15<br />
5<br />
voids<br />
Mortar<br />
Stone<br />
-5<br />
0 20 40 60 80 100<br />
Volume in %<br />
Figure L.79: CT scan S1B – Graphic Plot, BSM-emulsion, vibratory hammer compaction<br />
From Figure L.79 the voids condition and content may clearly be seen. The<br />
analysis of the figure is taken from the point marked “S” to the point marked “E”<br />
(this is done for each of the CT scan graphic plots). This is done as a result of the<br />
anomalies present at the top and bottom of the specimen, the reason for these<br />
anomalies is that the top and bottom sections of the sample are the sections that<br />
112
were either cut or were the pieces that were the most frequently handled, this<br />
may lead to the loss of aggregate in the sample at these points (this was seen to<br />
happen on the surface of the section being cut). The figure for S1B shows that<br />
the voids content is quite consistent, with only a temporary increase near the top.<br />
The mortar (Emulsion) and stone configuration differ quite extensively. The figure<br />
shows that as the mortar content increases so the stone content decreases and<br />
the opposite is also true.<br />
Figure L.81 shows a different picture; here the voids increase quite consistently till<br />
the middle of the section and then decrease until the end. The reason for this<br />
high increase at the centre of S1A is that the centre of this section falls extremely<br />
close to the intersection of the last two layers of the original sample, therefore<br />
this voids condition may in fact give an indication of the voids condition of the<br />
scarified surface after compaction of the next layer, this reasons may also provide<br />
an explanation for the bulge in S1B, Figure L.80 shows graphically where the<br />
scarified surfaces sit relative to the section points of S1A and S1B (this diagram is<br />
also applicable to the BSM-foam results). When the dimensions provided in the<br />
diagram of Figure L.80 are projected onto the Figures L.79 and L.81, assuming<br />
that the scans were performed from the top end of the sample moving<br />
downwards, the bulge of S1B fits almost perfectly in place with the position of the<br />
scarified surface. The bulge of S1A is slightly out, but this may be attributed to<br />
some form of compaction variability, i.e. that the scarified surface of S1A was<br />
possibly scarified to extensively, leaving a larger area for compaction.<br />
113
The visual of the difference in voids at the centre of S1A and S1B may be seen in<br />
Figures L.77 and L.78. S1A is the middle section of the specimen, so the fact that<br />
the voids show an increase as apposed to a drastic decrease, it may be concluded<br />
that no further compaction of sub layers takes place when compacting the top<br />
layers (in this case S1B). The same would be true should the voids content remain<br />
consistent throughout the sample length. When the mortar and stone content is<br />
viewed, the same trend is seen as is seen in figure L.81.<br />
S1B:<br />
75mm<br />
S1A:<br />
75mm<br />
60mm<br />
15mm<br />
45mm<br />
30mm<br />
60mm*<br />
Scarified<br />
area<br />
60mm<br />
60mm<br />
Scarified<br />
area<br />
* The 60mm<br />
sections are the<br />
original layers of<br />
the sample when it<br />
was initially<br />
compacted<br />
Figure L.80: Graphical illustration of the scarified surface relative to the section points for<br />
the CT scanned samples<br />
114
S1A<br />
85<br />
75<br />
E<br />
65<br />
Scan slice nummer (boorkern lengte in mm).<br />
55<br />
45<br />
35<br />
25<br />
15<br />
voids<br />
Mortar<br />
stone<br />
S<br />
5<br />
0 20 40 60 80 100<br />
-5<br />
Volume in %<br />
Figure L.81: CT scan S1A – Graphic Plot, BSM-emulsion, vibratory hammer compaction<br />
115
Sample 2: S2<br />
Section<br />
150mm<br />
Middle<br />
scan<br />
Piece Sent:<br />
S2<br />
±60mm<br />
Emulsion BSM-emulsion: <strong>Mix</strong>: Mod Mod<br />
Aashto<br />
AASHTO Compaction Compaction<br />
Figure L.82: CT scan S2 - Middle scan<br />
The CT scan performed on the Mod AASHTO compacted sample (Figure L.83) showed a more<br />
consistent voids content. There is a slight increase in the voids near to the bottom of the sample but<br />
not really significant. The mortar and stone content show the trend again that as the mortar content<br />
increases so to does the stone content decrease. The increase decrease rate is not extensively high,<br />
so that there is a frequent cross over between the two plots, there is however only one point at<br />
which the two plots intersect.<br />
116
s2<br />
85<br />
75<br />
Scan slice nummer (boorkern lengte in mm).<br />
65<br />
E<br />
55<br />
45<br />
35<br />
25<br />
S<br />
15<br />
5<br />
voids<br />
Mortar<br />
stone<br />
0 20 40 60 80 100<br />
-5<br />
Volume in %<br />
Figure L83: CT scan S2 – Graphic Plot, BSM-emulsion, Mod AASHTO compaction<br />
117
Sample 3: S3<br />
Section<br />
150mm<br />
Middle<br />
scan<br />
Middle<br />
scan<br />
Top: S3B<br />
Middle: S3A<br />
75mm<br />
75mm<br />
Foam BSM-foam:<br />
<strong>Mix</strong>: Vibratory<br />
Vibratory Hammer Hammer<br />
Figure L.84: CT scan - S3B Middle scan, BSMfoam<br />
Figure L.85: CT scan - S3A Middle scan, BSMfoam<br />
The BSM-foam was compacted close to refusal density, while the BSM-emulsion<br />
material was compacted to a target density of 100% Mod AASHTO. Figures L.84<br />
and L.85 show that the top and middle section of the BSM-foam differ less<br />
extensively in their voids content than does the BSM-emulsion.<br />
118
S3B<br />
85<br />
E 75<br />
65<br />
Scan slice nummer (boorkern lengte in mm).<br />
55<br />
45<br />
35<br />
25<br />
S<br />
15<br />
5<br />
voids<br />
Mortar<br />
Stone<br />
-5<br />
0 20 40 60 80 100<br />
Volume in %<br />
Figure L.86: CT scan S3B – Graphic Plot, BSM-foam, vibratory hammer compaction<br />
Figure L84 shows that the voids content of sample S3B varies very little, it is in fact very<br />
consistent. In principle the trend of higher voids content at the points where scarification of<br />
the layers took place should be applicable for the BSM-foam, yet this trend (as was seen in<br />
119
the BSM-emulsion) is not found in sample S3B and S3A. This is due to the fact that the<br />
BSM-foam was compacted for an excessively long period of time (3 minutes per layer) the<br />
scarified layer would have had more time to be compacted and allow the particles to<br />
orientate more thus reducing the voids at these points. The mortar and stone content of<br />
the BSM-foam is also more consistent than in the BSM-emulsion. Figure L.86 shows the<br />
same results as Figure L.87; the only difference is that the mortar and stone content of<br />
Figure L.86 is less consistent near the top of the sample than in Figure L.86.<br />
The voids content in both Figures L.86 and L.87 are consistently low, there is no excessive<br />
decrease in the voids at any one point, and this indicates that no further compaction of the<br />
subsequent layers takes place. This also indicates that no crushing of the aggregate takes<br />
place; this is because at a refusal state the only time that further compaction may transpire<br />
is when the aggregate begins to be crushed.<br />
120
S3A<br />
85<br />
75<br />
65<br />
Scan slice nummer (boorkern lengte in mm).<br />
55<br />
45<br />
35<br />
25<br />
15<br />
voids<br />
Mortar<br />
Stone<br />
5<br />
-5<br />
0 20 40 60 80 100<br />
Volume in %<br />
Figure L.87: CT scan S3A – Graphic Plot, BSM-foam, vibratory hammer compaction<br />
121
4.9 Experimentation on Untreated G2 Material<br />
Experimentation was carried out on untreated G2 material so as to determine<br />
what the compaction trend is when only moisture is added to the material. This<br />
could also provide a possible guide to develop an O.M.C. curve procedure for the<br />
vibratory hammer.<br />
2360.00<br />
Moisture Curve: Untreated G2 Material - Bosch GSH 11E® 10kg<br />
Surcharge<br />
2340.00<br />
2338.00<br />
Dry Density (kg/m3)<br />
2320.00<br />
2300.00<br />
2280.00<br />
2260.00<br />
2240.00<br />
2220.00<br />
5.9<br />
2.0 3.0 4.0 5.0 6.0 7.0 8.0 9.0 10.0<br />
Moisture Content (%)<br />
Figure L.88: Dry Density vs. Moisture Content: Untreated G2 Material – Bosch GSH 11E ®<br />
The compaction curve show in figure L.88 indicates that the vibratory hammer<br />
compaction is quite sensitive to the moisture content. The climb to the peak at<br />
first sight is quite steep. The gradient of the incline is 77.42; this is high as it is<br />
very close to 100 (which in the case of this graph would be a vertical line). The<br />
decline after the peak moisture content has a gradient of -25, the negative merely<br />
indicates the direction of the line, where as the value of 25 shows that the<br />
gradient is less steep than the initial incline. This indicates that after the peak<br />
moisture content the compaction densities achieved are not as sensitive to the<br />
moisture content as the initial compaction densities. A possible reason for this is<br />
that as the moisture increases the effect of any pore pressure within the sample<br />
would increase, as the moisture content is already high the effect of pore<br />
pressures would become more prevalent, this would have an effect on<br />
compaction, possibly making the sample less sensitive to the compaction. This is<br />
because more of the compaction energy exerted by the hammer would be taken<br />
up by the moisture, transferring less compaction energy to the material. In the<br />
122
case of the incline the moisture is acting more as lubricant, aiding in particle<br />
movement, rather than an energy absorber.<br />
Moisture Curve: Untreated G2 Material - Mod AASHTO vs. Vibratory<br />
Hammer Bosch GSH 11E® 10kg Surcharge<br />
2350.00<br />
2338.00<br />
2300.00<br />
Dry Density (kg/m3)<br />
2260.00<br />
2250.00<br />
2200.00<br />
2150.00<br />
2100.00<br />
Mod AASHTO<br />
Vibratory Hammer<br />
5.9 6.15<br />
0.0 1.0 2.0 3.0 4.0 5.0 6.0 7.0 8.0 9.0<br />
Moisture Content (%)<br />
Figure L.89: Dry Density vs. Moisture Content: Untreated G2 Material - Bosch ® Hammer<br />
Compaction vs. Mod AASHTO<br />
The above figure (Figure L.89) shows the comparison between the Mod AASHTO<br />
compacted, untreated G2 material and the Vibratory hammer compacted<br />
untreated G2 material. The first point that is evident is that the compaction<br />
densities achieved by the vibratory hammer are significantly higher than the Mod<br />
AASHTO densities for the same moisture content. Table L.15 shows the densities<br />
achieved at the various moisture contents; the densities are expressed as a<br />
percentage of the Mod AASHTO density. It is seen that compacting layer 1 for 10<br />
seconds and the remaining four layers for 15 seconds each yields densities in<br />
excess of 100% Mod AASHTO density.<br />
123
The difference in the moisture content at the peak of the two curves, the OMC<br />
value, is very small, only 0.25%. This indicates that for the procedure used that<br />
the OMC of the Mod AASHTO and the OMC of the vibratory hammer are very<br />
similar. The curve also shows that at lower moisture contents higher Dry Densities<br />
may be achieved.<br />
Table L.15: %Mod AASHTO Compaction Achieved Using the Vibratory<br />
Hammer – Untreated G2 Material<br />
Sample M.C %OMC Achieved Dry Density % Mod<br />
(kg/m 3 )<br />
AASHTO<br />
1 4.24 68.98 2238.01 102.38<br />
2 5.07 82.51 2269.32 101.67<br />
3 5.73 93.10 2336.3 103.56<br />
4 6.26 101.83 2329.61 103.08<br />
5 7.4 120.27 2302.56 102.79<br />
The average density achieved is 102.7% Mod AASHTO<br />
124
4.10 Repeatability Experimentation: G5 Material<br />
The purpose of the repeatability experimentation was to determine how well the<br />
vibratory hammer compaction procedure developed using a G2 quality material<br />
would perform using a different material; in this case a G5 granular material was<br />
chosen.<br />
4.10.1 Mod AASHTO Compaction of G5 Material<br />
4.10.1.1 Untreated G5 Material<br />
Moisture Curve: Untreated G5, Mod AASHTO<br />
2240.00<br />
2228.00<br />
2220.00<br />
OMC Mod AASHTO<br />
2200.00<br />
Dry Density (kg/m3)<br />
2180.00<br />
2160.00<br />
2140.00<br />
2120.00<br />
2100.00<br />
2080.00<br />
2060.00<br />
6.7<br />
2.0 3.0 4.0 5.0 6.0 7.0 8.0 9.0 10.0 11.0 12.0<br />
Moisture Content (%)<br />
Figure L.90: Moisture Curve: Untreated G5 Material – Mod AASHTO<br />
Figure L.90 shows the Mod AASHTO moisture curve used to<br />
determine the OMC of the Untreated G5 material. The Max<br />
Dry Density was found to be 2228 kg/m 3 with an OMC of<br />
6.7%.<br />
125
4.10.1.2 BSM-emulsion G5 Material<br />
Moisture Curve: BSM-emulsion G5 Material, Mod AASHTO<br />
2240.00<br />
2220.00<br />
2217.00<br />
2200.00<br />
OMC Mod AASHTO<br />
Dry Density (kg/m3)<br />
2180.00<br />
2160.00<br />
2140.00<br />
2120.00<br />
2100.00<br />
2080.00<br />
2060.00<br />
6.8<br />
3.0 4.0 5.0 6.0 7.0 8.0 9.0 10.0 11.0<br />
Moisture Content (%)<br />
Figure L.91: Moisture Curve: BSM-emulsion G5 Material – Mod AASHTO<br />
Moisture Curve: Untreated G5 vs. BSM-emulsion G5 Material<br />
Mod AASHTO<br />
Dry Density (kg/m3)<br />
2240.00<br />
2228.00<br />
2220.00<br />
2217.00<br />
2200.00<br />
2180.00<br />
2160.00<br />
2140.00<br />
2120.00<br />
2100.00<br />
∆OMC = 0.1%<br />
2080.00<br />
2060.00<br />
Untreated G5<br />
BSM-emulsion G5<br />
6.7 6.8<br />
2.0 3.0 4.0 5.0 6.0 7.0 8.0 9.0 10.0 11.0 12.0<br />
Moisture (%)<br />
Figure L.92: Moisture curve: Untreated G5 vs. BSM-emulsion G5 Material– Mod AASHTO<br />
126
Figure L.91 shows the Mod AASHTO curve determined for<br />
the BSM-emulsion G5 material; this curve was plotted<br />
against the untreated G5 moisture curve and is shown in<br />
Figure L.92. The results of comparing the two curves shows<br />
that the OMC value of the BSM-emulsion was 0.1% higher<br />
than for the untreated G5 material. The max Dry Density of<br />
the untreated G5 material was however 11kg/m 3 higher<br />
than for the BSM-emulsion G5 material. It is also seen from<br />
the result of comparing the two curves that the gradient of<br />
BSM-emulsion is steeper when compared to the untreated<br />
material. The same point may be noted, with regard to the<br />
gradient steepness of the two mixes, in the G2 material.<br />
This indicates that the compaction of the BSM-emulsion is<br />
more sensitive to moisture than the untreated material.<br />
4.10.1.3 BSM-foam G5 Material<br />
Moisture Curve: BSM-foam G5 Material, Mod AASHTO<br />
2160.00<br />
OMC Mod AASHTO<br />
2150.00<br />
2149.50<br />
Dry Density (kg/m3)<br />
2140.00<br />
2130.00<br />
2120.00<br />
2110.00<br />
2100.00<br />
6.95<br />
3.0 4.0 5.0 6.0 7.0 8.0 9.0 10.0 11.0 12.0<br />
Moisture Content (%)<br />
Figure L.93: Moisture Curve: BSM-foam G5 Material – Mod AASHTO<br />
127
Moisture Curve: Untreated G5 vs. BSM-foam G5 Material<br />
Mod AASHTO<br />
Dry Density (kg/m3)<br />
2240.00<br />
2228.00<br />
2220.00<br />
2200.00<br />
2180.00<br />
2160.00<br />
2149.50<br />
2140.00<br />
2120.00<br />
2100.00<br />
2080.00<br />
∆ OMC = 0.25<br />
Untreated G5<br />
BSM-foam G5<br />
2060.00<br />
6.70 6.95<br />
3.00 4.00 5.00 6.00 7.00 8.00 9.00 10.00 11.00 12.00<br />
Moisture (%)<br />
Figure L.94: Moisture curve: Untreated G5 vs. BSM-foam G5 Material – Mod AASHTO<br />
The same comparison, as to what was done for the BSMemulsion,<br />
of the treated material to the untreated material<br />
was done for the BSM-foam. The OMC of the BSM-foam for<br />
the Mod AASHTO moisture curve was found to be 0.25%<br />
higher than for the OMC of the untreated G5 Mod AASHTO<br />
moisture curve (Figure L.94). The Maximum Dry Density of<br />
the BSM-foam was however 78.5kg/m 3 less than the<br />
untreated material, and when looking at the gradients, the<br />
BSM-foam material has a slightly flatter incline compared to<br />
the untreated material, but the decline of the moisture<br />
curve is steeper in the case of the BSM-foam. This gradient<br />
indicates that the BSM-foam is less sensitive to moisture<br />
while moving up to the OMC point than the untreated<br />
material, but after reaching OMC the decrease in the Dry<br />
Density is more rapid and therefore more sensitive to the<br />
moisture in the case of the BSM-foam.<br />
128
4.10.2 Vibratory Hammer Compaction of G5 Material<br />
4.10.2.1 Untreated G5 Material<br />
Moisture Curve: Untreated G5 Bosch GSH 11E® 10kg Surcharge<br />
2250.00<br />
2240.00<br />
2236.00<br />
2230.00<br />
Dry Density (kg/m3)<br />
2220.00<br />
2210.00<br />
2200.00<br />
2190.00<br />
2180.00<br />
2170.00<br />
2160.00<br />
2150.00<br />
6.0<br />
3.0 4.0 5.0 6.0 7.0 8.0 9.0 10.0<br />
Moisture Content (%)<br />
Figure L.95: Moisture curve: Untreated G5 Vibratory Hammer – Bosch GSH 11E®<br />
2260.00<br />
2240.00<br />
2236.00<br />
2228.00<br />
2220.00<br />
Moisture Curve Mod AASHTO vs. Vibratory Hammer Bosch GSH 11E®<br />
10kg Surcharge: Untreated G5 Material<br />
Dry Density (kg/m3)<br />
2200.00<br />
2180.00<br />
2160.00<br />
2140.00<br />
2120.00<br />
2100.00<br />
2080.00<br />
OMC Mod AASHTO<br />
OMC Vibratory Hammer<br />
2060.00<br />
6.0 6.7<br />
2.0 4.0 6.0 8.0 10.0 12.0<br />
Moisture Content (%)<br />
Figure L.96: Moisture Curve: Mod AASHTO Compaction vs. Vibratory Hammer Compaction –<br />
Untreated G5 Material<br />
129
Table L.16: %Mod AASHTO Compaction Achieved: Mod AASHTO vs.<br />
Vibratory Hammer – Untreated G5 Material<br />
Sample M.C %OMC Achieved Dry Density<br />
(kg/m 3 )<br />
% Mod<br />
AASHTO<br />
1 5.30 79.06 2161.00 100.05<br />
2 5.91 88.26 2238.45 102.12<br />
3 6.69 99.87 2234.07 100.27<br />
4 8.09 120.69 2228.15 100.64<br />
The average achieved Dry Density = 100.77% Mod AASHTO<br />
The vibratory hammer compaction of the untreated G5<br />
material was done using the same procedure developed for<br />
the BSM-emulsion. This was decided based on the fact that<br />
the emulsion is believed to act as a lubricant during the<br />
compaction of BSM-emulsion, and in the case of untreated<br />
material there is only lubrication being added to the<br />
material in the form of water. Therefore layer one was<br />
compacted for 10 seconds and the remaining 4 layer were<br />
each compacted for 15 seconds.<br />
The results of the experiment are presented graphically in<br />
Figures L.94 and L.95. It is seen from these results that the<br />
vibratory hammer compaction is more sensitive to moisture<br />
on the incline as apposed to the Mod AASHTO compaction.<br />
The decline shows a drop in moisture sensitivity for the<br />
vibratory hammer, the Mod AASHTO compaction however<br />
shows a higher level of sensitivity to the moisture content<br />
after OMC than does the vibratory hammer. Across the<br />
various moisture contents the Dry Densities achieved were<br />
consistently around 100% Mod AASHTO (averaging<br />
100.77%). On site the accepted level of compaction of a G5<br />
material is 95 percent Mod AASHTO, considering that across<br />
the various moisture contents an average Mod AASHTO Dry<br />
Density of 100.77% is being achieved with the vibratory<br />
hammer, it shows that the densities achieved with the<br />
procedure are acceptable with respect to accepted levels of<br />
site compaction for the G5 material. In the case of the G2<br />
material the Dry Densities were on average around 103%<br />
Mod AASHTO. The peak moisture content of the untreated<br />
130
G5 material using the procedure was found to be 6% which<br />
indicates that the OMC of the vibratory hammer may in fact<br />
be lower than that of the Mod AASHTO compaction (which<br />
in this case is 6.7%). The OMC results indicate that at a<br />
lower OMC for a given material (in this case a G5 material)<br />
the vibratory hammer compaction can produce Dry<br />
Densities similar to or higher that the Mod AASHTO Dry<br />
Densities.<br />
The result of the achieved Dry Densities of the G5 material<br />
indicates that the procedure is useable on lesser quality<br />
granular materials such as G5 material.<br />
131
4.10.2.2 BSM-emulsion G5 Material<br />
2220.00<br />
Moisture Curve: BSM-emulsion G5 Material, Bosch GSH 11E® 10kg<br />
Surcharge<br />
OMC Vibratory Hammer<br />
2202.00<br />
2200.00<br />
Dry Density (kg/m3)<br />
2180.00<br />
2160.00<br />
2140.00<br />
2120.00<br />
2100.00<br />
7.0<br />
4.0 5.0 6.0 7.0 8.0 9.0 10.0 11.0 12.0<br />
Moisture Content (%)<br />
Figure L.97: Moisture curve: BSM-emulsion G5 Material, Vibratory Hammer – Bosch GSH 11E®<br />
2240.00<br />
2220.00<br />
2217.00<br />
2202.00<br />
2200.00<br />
Moisture Curve Mod AASHTO vs. Vibratory Hammer Bosch GSH 11E®<br />
10kg Surcharge: BSM-emulsion G5 Material<br />
OMC Vibratory Hammer<br />
OMC Mod AASHTO<br />
Dry Density (kg/m3)<br />
2180.00<br />
2160.00<br />
2140.00<br />
2120.00<br />
2100.00<br />
2080.00<br />
2060.00<br />
6.8 6.95<br />
4.0 5.0 6.0 7.0 8.0 9.0 10.0 11.0 12.0<br />
Moisture Content (%)<br />
Figure L.98: Moisture curve: BSM-emulsion G5 Material, Mod AASHTO vs. Vibratory Hammer –<br />
Bosch GSH 11E®<br />
132
Table L.17: %Mod AASHTO Compaction Achieved Using the Vibratory<br />
Hammer – BSM-emulsion G5 Material<br />
Sample M.C %OMC Achieved Dry Density (kg/m 3 ) % Mod<br />
AASHTO<br />
1 4.91 75.56 2106.52 101.47<br />
2 5.53 85.06 2167.29 102.13<br />
3 6.42 98.77 2186.11 99.82<br />
4 7.01 107.83 2201.12 99.69<br />
5 7.41 114.04 2197.18 101.07<br />
Average Achieved Dry Density = 100.84% Mod AASHTO<br />
G5 material was treated using Bitumen Emulsion and the<br />
Dry Density vs. Moisture content curve was developed for<br />
this mix using the vibratory hammer. For this compaction<br />
the same procedure developed for the BSM-emulsion for<br />
the G2 material was applied; figures L.96 and L.97 show<br />
the results of the experiment.<br />
The experiment shows that at the peak moisture content<br />
the Dry Density achieved with the vibratory hammer is less<br />
than the Mod AASHTO Dry Density. The peak moisture<br />
content i.e. the OMC of both the vibratory hammer and of<br />
the Mod AASHTO is very similar, only differing by 0.15%.<br />
The criterion for the accepted level of compaction on site is<br />
however still met, site compaction being accepted at 95%<br />
Mod AASHTO and the vibratory hammer achieved a<br />
compaction level of 99.82% Mod AASHTO at its OMC. It<br />
should be noted that from Figure L.99 it is seen that there<br />
is a moisture content bracket where the Dry Density<br />
achieved using the vibratory hammer does not reach 100%<br />
Mod AASHTO (it reached between 99.5% and 100%) but<br />
outside of the bracket Dry Densities exceeding 100% Mod<br />
AASHTO are achieved.<br />
The BSM-emulsion experiment also showed that the G5<br />
material was less sensitive to moisture overall when<br />
compacting using the vibratory hammer as apposed to the<br />
133
Mod AASHTO; this is shown by virtue that the vibratory<br />
hammer curve is quite flat when compared to the Mod<br />
AASHTO cure (figure L.97).<br />
Comparing the result of the G5 BSM-emulsion to the G2<br />
BSM-emulsion (sub section 4.5.1) a potential trend may be<br />
noted, i.e. that as the material quality decreases (e.g. from<br />
a G2 to a G5 material) so to does the extent with which<br />
100% Mod AASHTO compaction is exceeded using the<br />
vibratory hammer. This indicates that the material quality<br />
influences the level of compaction.<br />
The repeatability experiment for the BSM-emulsion shows<br />
that the procedure is applicable to and can produce<br />
acceptable result across material quality which varies as far<br />
as from G2 to G5.<br />
134
4.10.2.3 BSM-foam, G5 Material<br />
Moisture Curve: BSM-foam G5 Material, Bosch GSH 11E® 10kg<br />
Surcharge<br />
2170.00<br />
OMC Vibratory Hammer<br />
2160.00<br />
Dry Density (kg/m3)<br />
2150.00<br />
2140.00<br />
2130.00<br />
2120.00<br />
2110.00<br />
2100.00<br />
6.85<br />
3.0 4.0 5.0 6.0 7.0 8.0 9.0 10.0<br />
Moisture Content (%)<br />
Figure L.99: Moisture curve: BSM-foam Vibratory Hammer – Bosch GSH 11E®<br />
Moisture Curve Mod AASHTO vs. Vibratory Hammer Bosch GSH 11E®<br />
10kg Surcharge: BSM-foam G5 Material<br />
2170.00<br />
2160.00<br />
OMC Vibratory Hammer<br />
OMC Mod AASHTO<br />
Dry Density (kg/m3)<br />
2150.00<br />
2149.50<br />
2140.00<br />
2130.00<br />
2120.00<br />
2110.00<br />
2100.00<br />
6.85 6.95<br />
3.0 4.0 5.0 6.0 7.0 8.0 9.0 10.0 11.0<br />
Moisture Content (%)<br />
Figure L.100: Moisture curve: BSM-foam G5 Material, Mod AASHTO vs. Vibratory Hammer –<br />
Bosch GSH 11E®<br />
135
Table L.18: %Mod AASHTO Compaction Achieved Using the Vibratory<br />
Hammer – BSM-foam Treated G5 Material<br />
Sample M.C %OMC Achieved Dry Density (kg/m 3 ) % Mod<br />
AASHTO<br />
1 4.93 73.59 2133.19 102.66<br />
2 6.26 93.40 2151.56 101.15<br />
3 7.07 105.52 2158.96 100.46<br />
4 7.94 118.54 2151.34 101.62<br />
Average Achieved Dry Density = 101.47% Mod AASHTO<br />
The final repeatability experiment was setting up the<br />
moisture content vs. Dry Density curve for G5 material that<br />
had been treated using Foamed bitumen. The results of the<br />
experiment are presented in figures L.98 and L.99 as well<br />
as in table L.15.<br />
The experiment procedure used was similar to the<br />
procedure developed for the G2 BSM-foam. Compaction<br />
was done using the compaction times assigned to perform<br />
the moisture content vs. Dry Density curve of the G2 BSMfoam,<br />
these times are as follows:<br />
Layer 1 = 10 seconds<br />
Layer 2 = 25 seconds<br />
Layer 3 = 25 seconds<br />
Layer 4 = 34 seconds<br />
Layer 5 = 25 seconds<br />
The results of the BSM-foam showed, similar to the BSMemulsion<br />
results, that the compaction density achieved<br />
using the vibratory hammer is less sensitive to moisture<br />
than what the Mod AASHTO compaction is; this is evident<br />
by the lower incline and decline in the moisture content vs.<br />
Dry Density curve of the vibratory hammer compaction.<br />
The Dry Densities achieved averaged out at 101.47% Mod<br />
AASHTO with all moisture contents exceeding the 100%<br />
Mod AASHTO mark. This result is good in that it indicates<br />
that the compaction procedure is capable of producing Dry<br />
Densities well above the accepted level of site compaction;<br />
136
95% Mod AASHTO for G5 material. The procedure may<br />
therefore be used for lesser quality granular materials,<br />
which have been treated using Foamed mix bitumen, to<br />
produce samples so as to give an indication of the level of<br />
compaction achievable on site.<br />
In the Moisture vs. Dry Density curve of the BSM-foam G5<br />
material, the sample treated for 80% OMC was ignored<br />
when setting up the graph. When this ample was<br />
compacted the point at which it fell on the graph was<br />
outside of the other four (4) points. The grading curve in<br />
Figure L.101 was constructed (dry grading) and the<br />
possible explanation for this outlier is show in the en-circled<br />
area. The 80% OMC sample and the 100% OMC sample<br />
were both broken up after compaction and allowed to dry<br />
out completely prior to doing the grading curve. The 100%<br />
OMC was chosen as it lay on the plotted curve. Because the<br />
remaining four samples all fell on the plotted curve it may<br />
be assumed (considering that they are reconstituted<br />
samples) that their grading is virtually the same. The encircled<br />
section of figure L.101 shows a discrepancy in the<br />
grading. When this was evaluated and the results converted<br />
to mass of material it was found that the 80% OMC sample<br />
had ±1100gm of material for the sieve fractions 13.2mm to<br />
2mm more than the 100% OMC sample. Looking at the<br />
fines, it was found that the 100% OMC sample had<br />
±500gm for the sieve fractions 0.0425mm to 0.075mm<br />
more than the 80% OMC sample.<br />
137
Grading Curve: Foamed <strong>Mix</strong> G5 Material - 80% OMC vs. 100% OMC<br />
120.0<br />
100.0<br />
80% OMC<br />
100% OMC<br />
80.0<br />
% Passing<br />
60.0<br />
40.0<br />
20.0<br />
0.0<br />
0.01 0.1 1 10 100<br />
Sieve Size (mm)<br />
Figure L.101: Grading curve: BSM-foam G5 Material – 80% OMC vs. 100% OMC<br />
The difference in the material grading of the two samples<br />
may be attributed to the segregation of the 80% OMC<br />
sample during the weighing off of the various layers. For<br />
the 100% OMC sample the moisture content and weighing<br />
off of the various layers made use of almost all of the<br />
material, after which there was in the order of 600gm<br />
material left over where with the 80% OMC there was well<br />
in excess of 1000gm of material left over after weighing off<br />
of separate layers and moisture content samples being<br />
taken, this large excess indicates that there is larger room<br />
for segregation of the sample than for the 80% OMC<br />
sample.<br />
138
4.10.3 Grading of G5 material Before and After Compaction<br />
90.0<br />
80.0<br />
Grading Curve of G5 Material: Grading Prior to Compaction vs. Grading<br />
After Compaction<br />
Grading Prior to Compaction<br />
Grading After Compaction<br />
70.0<br />
60.0<br />
% Passing<br />
50.0<br />
40.0<br />
30.0<br />
20.0<br />
10.0<br />
0.0<br />
0.01 0.1 1 10 100<br />
Sieve Size (mm)<br />
Figure L.102: G5 Material Grading Curve – Before and After Compaction<br />
The grading curve provided in figure L.102 was developed using the<br />
dry grading method on untreated G5 material. The grading curves<br />
of the material indicate that after compaction the overall grading of<br />
the sample is different. The result does not appear to be as a result<br />
of crushing, this is because there is not a distinctive increase in the<br />
finer material. The reason may rather be due the segregation that<br />
occurs during the weighing off process, or it could be due to the<br />
loss of fine material through the seepage of material between the<br />
walls of the mould and the foot piece of the vibratory hammer<br />
when samples are compacted at higher moisture levels.<br />
139
4.11 Zero Air Voids of the Curves<br />
The Zero air voids curve was plotted against the moisture sensitivity curve<br />
of the various mixes. This was done so as to establish were the compaction<br />
curves lie with respect to the absolute maximum Dry Density, indicated by<br />
the zero air voids curve.<br />
To set up these curves the specific gravity (Gs) of both the G2 and G5 material<br />
was determined in both the untreated and BSM states; the Gs of the bitumen<br />
was taken as 1.00 and for both the BSM-emulsion and BSM-foam the binder<br />
content was taken as 1.98%. The Gs values of the fine material were<br />
determined using the TMH 1 method in the case of the G5 material. In the<br />
case of the coarse material i.e. the large stones, the same method was used as<br />
was used for the G2 material. A few of the largest stones (± 19mm) were<br />
taken and the individual density of each one was determined, these were<br />
averaged out and used as the representative density of the parent rock from<br />
which the Gs value may be obtained; dividing this density with the density of<br />
water in the case of the G2 material; for the G5 material the relative density<br />
(RD) of the fine material was summed with the representative density of the<br />
parent rock and divided by two, this gave the density from which the Gs value<br />
was determined. The Gs values determined were as follows:<br />
• Gs of the Untreated G2 = 2.873<br />
• Gs of BSM G2 = 2.836<br />
• Gs of the Untreated G5 = 2.788<br />
• Gs of BSM G5 = 2.733<br />
Figures L.103 to L.108 show the relationship of the moisture curve to the zero air<br />
voids line.<br />
140
4.11.1 Zero air voids vs. Moisture curve of the G2 material<br />
Dry Density<br />
(kg/m3)<br />
Zero Air Voids Line vs. Moisture Curve of<br />
Mod AASHTO<br />
and Bosch GSH 11E®: Untreated G2<br />
Material<br />
2400.00<br />
2350.00<br />
2300.00<br />
2250.00<br />
2200.00<br />
2150.00<br />
2100.00<br />
2050.00<br />
Vibratory hammer<br />
Mod AASHTO<br />
Zero Air Voids<br />
0.0 2.0 4.0 6.0 8.0 10.0 12.0<br />
Moisture Content (%)<br />
Figure L.103: Zero air voids line vs. Moisture curve – Untreated G2 Material<br />
Dry Density<br />
(kg/m3)<br />
Zero Air Voids Line vs. Moisture Curve of<br />
Mod AASHTO<br />
and Bosch GSH 11E®: BSM-emulsion G2<br />
Material<br />
2350.00<br />
2300.00<br />
2250.00<br />
2200.00<br />
2150.00<br />
2100.00<br />
2050.00<br />
2000.00<br />
Vibratory hammer<br />
Mod AASHTO<br />
Zero Air Voids<br />
0.0 2.0 4.0 6.0 8.0 10.0 12.0<br />
Moisture Content (%)<br />
Figure L.104: Zero air voids line vs. Moisture curve – BSM-emulsion G2 Material<br />
141
Dry Density<br />
(kg/m3)<br />
2350.00<br />
2300.00<br />
2250.00<br />
2200.00<br />
2150.00<br />
2100.00<br />
2050.00<br />
2000.00<br />
Zero Air Voids Line vs. Moisture Curve of<br />
Mod AASHTO<br />
and Bosch GSH 11E®: BSM-foam G2<br />
Material<br />
Vibratory hammer<br />
Mod AASHTO<br />
Zero Air Voids<br />
0.0 2.0 4.0 6.0 8.0 10.0 12.0<br />
Moisture Content (%)<br />
Figure L.105: Zero air voids line vs. Moisture curve - BSM-foam G2 Material<br />
The zero air voids curve plotted for the G2 material show that the<br />
untreated material finishes closer to the zero air voids line than dos<br />
the BSMs. The expected result of higher compaction energy is seen<br />
in the curves as the vibratory hammer curve shifts upward slightly<br />
to the left, moving closer to the zero air voids line, with the<br />
exception of the BSM-emulsion plot (figure L.104) which shifts to<br />
the right however the movement is closer to the zero air voids line.<br />
In view of these results, the vibratory hammer produces samples<br />
with lower air voids than does the Mod AASHTO compaction<br />
method.<br />
142
4.11.2 Zero air voids vs. Moisture curve of the G5 material<br />
Dry Density<br />
(kg/m3)<br />
Zero Air Voids Line vs. Moisture Curve of<br />
Mod AASHTO<br />
and Bosch GSH 11E®: Untreated G5<br />
Material<br />
2400.00<br />
2350.00<br />
2300.00<br />
2250.00<br />
2200.00<br />
2150.00<br />
2100.00<br />
2050.00<br />
2000.00<br />
1950.00<br />
Vibratory hammer<br />
Mod AASHTO<br />
Zero Air Voids<br />
0.0 2.0 4.0 6.0 8.0 10.0 12.0<br />
Moisture Content (%)<br />
Figure L.106: Zero air voids line vs. Moisture curve – Untreated G5 Material<br />
Dry Density<br />
(kg/m3)<br />
Zero Air Voids Line vs. Moisture Curve of<br />
Mod AASHTO<br />
and Bosch GSH 11E®: BSM-emulsion G5<br />
Material<br />
2350.00<br />
2300.00<br />
2250.00<br />
2200.00<br />
2150.00<br />
2100.00<br />
2050.00<br />
Vibratory hammer<br />
Mod AASHTO<br />
Zero Air Voids<br />
0.0 2.0 4.0 6.0 8.0 10.0 12.0<br />
Moisture Content (%)<br />
Figure L.107: Zero air voids line vs. Moisture curve – BSM-emulsion G5 Material<br />
143
Dry Density<br />
(kg/m3)<br />
Zero Air Voids Line vs. Moisture Curve of<br />
Mod AASHTO<br />
and Bosch GSH 11E®: BSM-foam G5<br />
Material<br />
2350.00<br />
2300.00<br />
2250.00<br />
2200.00<br />
2150.00<br />
2100.00<br />
2050.00<br />
Vibratory hammer<br />
Mod AASHTO<br />
Zero Air Voids<br />
0.0 2.0 4.0 6.0 8.0 10.0 12.0<br />
Moisture Content (%)<br />
Figure L.108: Zero air voids line vs. Moisture curve – BSM-foam G5 Material<br />
The results seen in the G2 material are evident in the G5 material<br />
results. The G5 material showed more consistent results in terms of<br />
how close to the zero air voids line the compacted samples finished.<br />
The moisture curve of the untreated material did not finish<br />
excessively closer to the zero air voids line than did the BSMs; on<br />
the contrary when the position of the MDD of the vibratory hammer<br />
of the G5 is viewed relative to the zero air voids line then it is seen<br />
that the BSM-emulsion curve (figure L.107) is closer to the zero air<br />
voids line. As with the G5 material the expected trend of the<br />
moisture curve moving upward slightly to the left for higher<br />
compaction energy is seen; however for the G5 material the BSMemulsion<br />
conforms to this trend. In view of these curves the<br />
vibratory again shows that it produces samples with lower air voids<br />
than does the Mod AASHTO compaction method.<br />
144
4.11.3 Zero air voids curve compared to CT scanning results<br />
The comparison of the CT scanning results could only be done for<br />
the BSM-emulsion of the G2 material as there was both a Mod<br />
AASHTO compacted sample and a vibratory hammer compacted<br />
sample of the material. The voids of Figure L.79 were used for the<br />
vibratory hammer and an area on the sample where the voids were<br />
at a minimum was chosen, therefore the voids from slice 20 to slice<br />
54 were average out and used as this gave a comparable result,<br />
(the scarification of the layer surface had not been identified prior<br />
to the CT scanning, therefore the voids of Figure L.81 were not<br />
used for this comparison). The voids of figure L.83 were used for<br />
the Mod AASHTO compaction and the section of the sample where<br />
the voids were at a minimum was chosen and the voids across that<br />
section were averaged out; slice 8 to slice 62. The voids results are<br />
as follows:<br />
• CT scanning = 0.68% voids<br />
• Mod AASHTO = 0.77% voids<br />
These results show that the vibratory hammer produced lower air<br />
voids content than did the Mod AASHTO, this confirms the results of<br />
the zero air voids line, which showed that the vibratory hammer<br />
produced samples with a lower air voids content.<br />
145
4.12 Compaction Energy of the Compaction Methods<br />
4.12.1 Bosch GSH 11E®<br />
The compaction energy exerted by the Bosch® vibratory hammer over the<br />
BSM-emulsion and BSM-foam samples as well as the untreated granular<br />
material was determined after completion of the compaction experiments.<br />
This energy was then compared to the compaction energy of the New<br />
Zealand vibrating hammer compaction method and to the energy of the<br />
ASTM vibrating hammer compaction method (see table L.Lit 3 and L.Lit 4 of<br />
the literature study section of this appendix). The New Zealand and ASTM<br />
compaction methods compact in two and three layers respectively to<br />
produce samples of a height similar to the Mod AASHTO compaction<br />
method. Therefore to compare the energies the new Zealand and ASTM<br />
methods were evaluated over five layers; this allowed both methods to be<br />
compared to the procedure developed by the University of Stellenbosch<br />
(US).<br />
The calculation of the energy of each hammer was done as follows.<br />
n=5<br />
• Total Energy = Σ ( Point Energy × (beats/min) × compaction<br />
x=1<br />
time of Layer x ÷ 60seconds)<br />
• Average energy per Layer = Total Energy ÷ No. of Layers<br />
The energy of the Bosch® hammer for the BSM-emulsion was determined<br />
for two time scenarios:<br />
1. Times assigned to the layers based on the experiment results.<br />
2. Doubling the compaction times assigned to the layers based on the<br />
experiment results.<br />
The energies are assigned a lower limit and an upper limit. This is the range<br />
in which the energies fall based on the minimum and maximum beats per<br />
minutes of the specific vibratory hammer.<br />
The point energy of the respective compaction methods are provided below<br />
and the comparative results then follow.<br />
• New Zealand = 7 Joules: 1500-3600 beats/min<br />
146
• ASTM = 10 Joules (Bosch 11248 EVS ®): 1700-3300 beats/min<br />
• US = 25 Joules (Bosch GSH 11E ®): 900-1890 beats/min<br />
Compaction Energy over the BSM-emulsion samples: Times initially<br />
assigned to each layer<br />
Table L.19: Comparison of Total Energy of Vibratory Hammers BSMemulsion<br />
Vibratory Hammer Lower Limit (kJ) Upper Limit (kJ)<br />
New Zealand 157.5 378<br />
ASTM: Bosch<br />
11248EVS®<br />
85 165<br />
US: Bosch GSH 11E® 26.25 55.13<br />
Table L.20: Comparison of Average Energy/Layer of Vibratory<br />
Hammers BSM-emulsion<br />
Vibratory Hammer Lower Limit (kJ) Upper Limit (kJ)<br />
New Zealand 31.5 75.6<br />
ASTM: Bosch<br />
11248EVS®<br />
17 33<br />
US: Bosch GSH 11E® 5.25 11.025<br />
The New Zealand and ASTM compaction methods make use of fixed<br />
times per layer of 180 seconds and 60 seconds respectively. The<br />
comparisons presented above assume that there compaction methods<br />
are used as is to compact BSM samples. The untreated material at<br />
Stellenbosch University was compacted using the procedure developed<br />
for the BSM-emulsion samples. The compaction times for the US<br />
procedure are as follows<br />
• Layer 1 = 10seconds<br />
• Layer 2 through to Layer 5 = 15 seconds each<br />
Based on the given point energies the trend that is seen is that a higher<br />
point energy yields a less total energy required to compact a sample. This<br />
trend was noted in the literature study of this appendix and the compaction<br />
procedure developed by the University of Stellenbosch confirms this point as<br />
the Bosch GSH 11E® has the highest point energy (25 Joules) but uses the<br />
least total energy and least average energy per layer to compact the<br />
untreated and BSM-emulsion samples.<br />
147
Compaction Energy over the BSM-emulsion samples: Times initially<br />
assigned to each layer Doubled<br />
Table L.21: Comparison of Total Energy – Compaction time per layer<br />
doubled BSM-emulsion<br />
Vibratory Hammer Lower Limit (kJ) Upper Limit (kJ)<br />
New Zealand 157.5 378<br />
ASTM: Bosch<br />
11248EVS®<br />
85 165<br />
US: Bosch GSH 11E® 52.5 110.25<br />
Table L.22: Comparison of Average Energy/Layer – Compaction<br />
time per layer doubled BSM-emulsion<br />
Vibratory Hammer Lower Limit (kJ) Upper Limit (kJ)<br />
New Zealand 31.5 75.6<br />
ASTM: Bosch<br />
11248EVS® 17 33<br />
US: Bosch GSH 11E® 10.5 22.05<br />
The trend seen in the energies prior to doubling the compaction times<br />
for the US procedure are still seen after doubling the compaction times.<br />
It is expected that doubling the compaction times of the US procedure<br />
will produce samples with a much higher final Dry Density which will<br />
also be further above the upper limit of the accepted level of<br />
compaction specified for site.<br />
148
Compaction Energy over the BSM-foam samples: Times initially<br />
assigned to each layer<br />
Table L.23: Comparison of Total Energy of Vibratory Hammers BSMfoam<br />
Vibratory Hammer Lower Limit (kJ) Upper Limit (kJ)<br />
New Zealand 157.5 378<br />
ASTM: Bosch<br />
11248EVS®<br />
85 165<br />
US: Bosch GSH 11E® 44.63 93.71<br />
Table L.24: Comparison of Average Energy/Layer of Vibratory<br />
Hammers BSM-foam<br />
Vibratory Hammer Lower Limit (kJ) Upper Limit (kJ)<br />
New Zealand 31.5 75.6<br />
ASTM: Bosch<br />
11248EVS® 17 33<br />
US: Bosch GSH 11E® 8.93 18.74<br />
The BSM-foam samples show the same trend as the BSM-emulsion samples<br />
in both the total energy required to compact a sample and the average<br />
compaction energy per layer.<br />
There was no need to double the compaction energies for the BSM-foam<br />
samples as the samples produced from this procedure have final Dry<br />
Densities that are well exceed the accepted level of compaction on site.<br />
149
4.12.2 Mod AASHTO Compaction<br />
The compaction energy of the Mod AASHTO compaction method was<br />
determined from the formula:<br />
• Compaction Energy (CE) = (No. of blows/layer) x (No. of layers) x<br />
(weight of hammer) x (drop height of hammer)<br />
In order to compare the overall energy of the Mod AASHTO method to the<br />
vibratory hammer method the number of layer was taken as 5, the number<br />
of blows per layer was taken as 55, the drop height was taken as 0.4572m<br />
and the weight of the hammer was 4.536kg x g (gravitational acceleration<br />
= 9.81m.s -2 ). The compaction energy is provided below:<br />
• CE/Layer = 1.865 kJ<br />
• CE Total = 5.595 kJ<br />
This results, when compare to the Bosch GSH 11E® compaction energy, is<br />
much lower than the vibratory hammer compaction energy. The Bosch®<br />
hammer at the University of Stellenbosch exerted a CE/Layer of 11.025kJ<br />
for the BSM-emulsion and 18.74kJ for the BSM-foam. The vibratory hammer<br />
exerted energy per layer greater than the total energy of the Mod AASHTO<br />
compaction method. The total energy of the vibratory hammer of 55.13KJ<br />
and 93.71KJ for BSM-emulsion and BSM-foam respectively are vastly<br />
greater that the total energy of 5.595KJ for the Mod AASHTO compaction<br />
method.<br />
150
4.13 Development of Material Tools<br />
During the experiment process spot measurements were made of the layer<br />
thickness just prior to compaction, i.e. directly after the material for the<br />
respective layer had been added and the hammer had be lowered into<br />
position, measurements were taken as to determine the starting thickness<br />
of the layer. These measurements were taken by measuring the distance<br />
from the lower end of the sleeve to either the zero line, in the case of layer<br />
one, or to the final position of the previously compacted layer; the<br />
measurements showed a starting height of around 92mm in the case of the<br />
G5 material. These measurements were used to design a scoop. This was<br />
done by determining the volume of the material prior to compaction and<br />
then developing a scoop with either the same volume as the starting<br />
volume of an individual layer or with a fraction of the starting layer of ½ or<br />
1/3 of the volume. This was done so that as apposed to weighing of the<br />
mass of material per layer a scoop could be used to place material into the<br />
mould that would provide a similar mass as to what would have been<br />
weighed off.<br />
The result was a scoop with a volume of 1/3 the starting volume of a layer.<br />
The dimensions are a diameter of 90mm and a height of 85mm. This design<br />
allows for three scoops of aggregate to be added into the mould that will<br />
provide a starting height of ±92mm.<br />
151
4.14 Development of Specifications for Site Compaction<br />
The vibratory hammer compaction method is to be used to provide specifications for<br />
compaction levels on site. In order to develop the specifications the vibratory<br />
hammer results were equated to the current specifications. This was done as<br />
follows:<br />
Material Type Current specification (%Mod AASHTO)<br />
G2 100-102%<br />
G5 95%<br />
The average level of compaction achieved during the sensitivity analysis of the<br />
vibratory hammer was determined for each of the individual BSMs. The standard<br />
deviation for each BSM was also calculated. The <strong>Design</strong> Value i.e. the level of<br />
compaction from which the specifications will be developed was calculated using the<br />
following formula:<br />
<strong>Design</strong>Value = X − zS<br />
Previously Ф was taken as 15% (Subsection 4.7.1) therefore z = 1.033<br />
X is the average level of compaction of the vibratory hammer as a % of Mod<br />
AASHTO<br />
z is the dimensionless factor<br />
S is the standard deviation<br />
The results of this calculation were as follows:<br />
Table L25: <strong>Design</strong> values for site compaction specifications of G2 material<br />
BSM Average compaction level<br />
(% Mod AASHTO)*<br />
Standard<br />
Deviation<br />
<strong>Design</strong> Value<br />
(85%<br />
reliability)<br />
Untreated 102.70 0.72 101.96<br />
Emulsion 102.86 1.42 101.40<br />
Foam 105.47 1.36 104.06<br />
*After vibratory hammer compaction<br />
152
Table L26: <strong>Design</strong> values for site compaction specifications of G5 material<br />
BSM Average compaction level (%<br />
Mod AASHTO)*<br />
Standard<br />
Deviation<br />
<strong>Design</strong> Value<br />
(85%<br />
reliability)<br />
Untreated 100.77 0.91 99.58<br />
Emulsion 100.84 1.06 99.74<br />
Foam 101.48 0.92 100.52<br />
*After vibratory hammer compaction<br />
The current accepted level of compaction is then divided by the <strong>Design</strong> Value to<br />
obtain the level of compaction for the vibratory hammer. This level of compaction<br />
for the vibratory hammer is equivalent to the current specifications. The<br />
specifications determined in this report do need to be revisited as site compaction<br />
data becomes available. The final specifications are as follows:<br />
Table L27: Site compaction specifications for G2 material<br />
BSM Site Specification (% vibratory<br />
hammer compaction)<br />
Untreated 98.6 - 100<br />
Emulsion 98.6 - 100<br />
Foam 96.1 - 98<br />
The G5 material produced <strong>Design</strong> Values all in the order of 100% Mod AASHTO for<br />
vibratory hammer compaction. Therefore the fraction of Mod AASHTO compaction<br />
specified for the level of site compaction is to be used. An example of this is as<br />
follows: for a G5 material the current specification for site compaction is 95% of<br />
Mod AASHTO compaction. Therefore according to the previous statement the<br />
accepted level of site compaction is as specified below.<br />
Table L28: Site compaction specifications for G5 material<br />
BSM Site Specification (% vibratory<br />
hammer compaction)<br />
Untreated 95<br />
Emulsion 95<br />
Foam 95<br />
153
4.15 Outline of Proposed Protocol<br />
From the results a potential compaction protocol may be identified. The protocol<br />
is for the production of samples that will give an indication of what Dry Densities<br />
may be obtained in the field i.e. using the vibratory hammer compaction as a<br />
means to indicate what densities are possible on site by means of a sensitivity<br />
analysis. A full, detailed description of the compaction protocol is provided in the<br />
recommendations section of this appendix. A brief outline is described below.<br />
Protocol: Sample production as an indication of achievable compaction<br />
levels<br />
For the compaction protocol the following information is needed:<br />
1. Mod AASHTO moisture content curve<br />
2. OMC (Mod-U)<br />
3. Target Binder content if material is to be stabilized<br />
4. Type of cold mix treatment i.e. bitumen emulsion mix or foamed bitumen<br />
mix<br />
The following tools and temperature information is also needed<br />
5. Bosch GSH 11E® with a surcharge of 10kg<br />
6. Compaction is done at room temperature<br />
7. Drill with a drill bit longer than or equal to 300mm with a point marked off<br />
10mm from the tip of the drill bit.<br />
8. Extension piece for the mould so as to compact layer 5<br />
9. Material scoop.<br />
A Moisture curve for the untreated material ifs first developed, from this moisture<br />
curve the OMC of the untreated material is known and this OMC is used to<br />
develop a moisture curve for either the BSM-emulsion or the BSM-foam; which<br />
ever stabilizing method is to be used. These graphs are the reference graphs for<br />
the target Dry Densities.<br />
Compaction using the vibratory hammer is done at various moisture contents<br />
ranging from 2% moisture to 10 or 12% moisture; this depends on the type of<br />
aggregate used.<br />
154
The amount of moisture added to the material will depend on the type of cold mix<br />
treatment. For the BSM-foam moisture is added to the samples till the sample is<br />
reached which has a ratio of the water added to OMC of the untreated material of<br />
0.8 (80%). At this point the remaining samples receive the same amount of water<br />
as the sample with a ratio of water added to OMC of the untreated material of<br />
0.8. The material is then treated using the foamed bitumen and the remaining<br />
moisture required to achieve the targeted moisture content of each of the<br />
samples is added. The BSM-emulsion samples must first have the moisture in the<br />
emulsion calculated out of the targeted moisture content, the moisture is then<br />
added followed by the bitumen emulsion.<br />
The material is prepared; either BSM-emulsion or BSM-foam. The sample is then<br />
compacted in 5 layers in a mould 300mm high with a diameter of 150mm.<br />
Material is placed In the mould using a material scoop. Each individual layer<br />
receives three scoops of material for the respective mix, this is placed in the<br />
mould using a scoop with dimensions of 90mm diameter and height of 85mm and<br />
the sample is compacted. Each layer is compacted for a set period of time until all<br />
five layers have been compacted. Times for the respective layers are provided in<br />
the recommendations section of the appendix.<br />
After a layer has been compacted, that layer surface is then scarified using the<br />
drill. Three scoops of material are then added using the material scoop and the<br />
layer is compacted, this process continues until all five layers have been<br />
compacted.<br />
The sample is removed and the final height and final mass of the sample are<br />
taken. A moisture content of the remaining material is also taken using the<br />
standard oven drying method and the Dry Density is then determined. The Dry<br />
Density for each of the samples is at their respective moisture contents is<br />
determined. These are then used to plot the moisture curve of moisture Content<br />
vs. Dry Density of the vibratory hammer. This curve is then compared to the Mod<br />
AASHTO moisture curve set up for the respective BSM. The comparison is<br />
expressed as a percentage of the Mod AASHTO Dry Density.<br />
The results show that the Dry Densities achieved are above the recommended<br />
levels of compaction for G2 and G5 materials. This shows that the vibratory<br />
hammer may be used to specify the level of site compaction. Based on the results<br />
of this research the level of compaction should be taken as 100% of the Maximum<br />
Dry Density achieved using the vibratory hammer for the G2 material. In the case<br />
of the G5 material the Maximum Dry Densities of the vibratory hammer<br />
155
compaction was found to be extremely near to the Maximum Dry Densities of the<br />
Mod AASHTO compaction, therefore the specification of 95% Mod AASHTO<br />
compaction currently used to specify the level of compaction on site should be<br />
applied to the vibratory hammer to specify the level of site compaction; i.e. site<br />
compaction should be equal to or larger than 95% vibratory hammer compaction.<br />
156
5 CONCLUSIONS<br />
Based on the results of the experiments the following conclusions were drawn.<br />
5.1 Influence of Time on Compaction with Varying Moisture Content of G2 Material<br />
The experiments showed that as the moisture content increased the compaction time to 100%<br />
Mod AASHTO compaction decreased. What was also seen is that once the moisture content was<br />
at 90% OMC for the BSM-emulsion the compaction time reduced so far that it may be assumed<br />
that sufficient time is not provided for the particles to become properly orientated within the<br />
specimen during compaction at this moisture content and hence the representation of the<br />
prepared sample to the compaction of the material on site may not be adequate.<br />
At 80% OMC in both the BSM-foam and BSM-emulsion mixes the compaction time to reach<br />
100% Mod AASHTO was sufficient to allow for proper orientation of the material particles, but<br />
also short enough that the preparation of the sample does not necessarily become a very time<br />
consuming procedure.<br />
The influence of the surcharge weight is also evident in the results of the experiments. The<br />
20kg load at 80% OMC showed a compaction time effect similar to that of the 10kg load at<br />
90% OMC. The Kango 637® however suffered damages to the gear box at a 20kg surcharge<br />
load and this damage is believed to be as a result of this load. Based on the short time the<br />
20kg load gives and the fact that the Kango 637® suffered damages at this load the 10kg load<br />
became the safest and best option. The 15kg surcharge showed compaction times in between<br />
the 10kg and 20kg surcharge mass, it could therefore be considered as an option for the<br />
surcharge weight used during compaction, however these results are all based on the Kango<br />
637® results and when the correlation experiment between the Kango and Bosch hammer is<br />
taken into account, the 10kg surcharge proves to be the best option.<br />
In terms of the refusal density, it was generally seen that throughout the compaction of the<br />
emulsion mixes the time required to achieve refusal density was between 2 and 5 minutes of<br />
compaction time depending on the layer being compacted. The effect of moisture on this seems<br />
minimal, as there are cases where at 80% OMC it took roughly 3.5 minutes to reach refusal<br />
density and then at 90% OMC the layers all fall into a bracket of between 3.5 and 4 minutes.<br />
The surcharges also had little effect, with the layers across the various samples, again taking<br />
3.5, 4 minutes to reach refusal density. What is clear is that the achieved refusal densities are<br />
influenced by the moisture content and surcharge load. The higher the moisture content, the<br />
higher the bracket of the refusal density and the higher the surcharge load in combination with<br />
the moisture content the higher the bracket in which the refusal density falls.<br />
157
The foam mixes exhibited a similar trait to that of the emulsion mixes with regard to the refusal<br />
density compaction. Once again as the moisture content increased so to does the bracket in<br />
which the refusal density falls, and with the surcharge mass, the same trend was seen. A<br />
difference was seen in the compaction of the foamed mix to refusal density, the density of this<br />
mix continued to climb after 5 minutes of compaction. This results shows that the foamed mix<br />
requires longer compaction time to reach refusal density than does the emulsion mix.<br />
5.2 Comparison of Vibratory Hammer to Vibratory Table<br />
The conclusion from this correlation experiment is that the vibratory hammer is a faster<br />
procedure with less physical labour required (if no pulley system is available for the vibratory<br />
table). Also the vibratory hammer gives more control and accuracy over both the target<br />
densities and the final level of the surface of the sample (a more perpendicular surface face is<br />
achieved with the vibratory hammer).<br />
5.3 Correlation of N7 Material to G2 Material<br />
Parameters used for the compaction of the clean G2 material i.e. time per layer etc. were not<br />
applicable to the N7 G2 material. This is because, although the N7 material is a G2 quality, the<br />
milling process of the recycling process changes the grading and quality of the material from its<br />
original state when initially used in construction. The presence of RAP in the N7 material is<br />
believed to have had an influence on the compaction of the material. More time is required to<br />
reach the targeted site densities for the N7 material than for the clean bitumen treated G2<br />
material to reach its 100% Mod AASHTO dry density. Simply because it takes 30 seconds to<br />
compact the G2 material to its 100% Mod AASHTO does not mean it will take the same time to<br />
compact the N7 material to its 100% Mod AASHTO density or the targeted site density. The<br />
material properties, i.e. grading and the presence of other elements such as RAP or cement<br />
from the initial construction influence the compaction time.<br />
The correlation experiment shows an important conclusion. Time cannot be taken as a fixed<br />
unit. Material properties influence the compaction time, therefore compaction using the<br />
vibratory hammer to produce site related samples should be performed as a function of the<br />
layer thickness and not as a function of time.<br />
158
5.4 CT Scanning<br />
From the CT scanning results the first conclusion that can be drawn is that the vibratory<br />
hammer produces samples with very low voids contents. The extent to which the surface of<br />
various layers is scarified has an influence on the level of voids at the intersection of two layers.<br />
This indicates that when compacting, care must be taken that the surface of a compacted layer<br />
is not scarified to extensively as this allows for higher voids contents in those areas, this is<br />
because the compaction time assigned to compact a single layer (specifically for emulsion<br />
mixes) is relatively short, this does not allow the loose material to necessarily arrange itself<br />
properly even though the target Dry Densities are achieved. These points will inevitably be<br />
week spots in the prepared sample.<br />
The CT Scanning showed a consistency in the air voids across the two samples per mix that<br />
were sent to the Netherlands. There is no sudden drop in the voids content in the lower layer of<br />
the sample, this indicates that no subsequent compaction of the underlying layers takes place<br />
nor does crushing of the material occur.<br />
5.5 Repeatability Experimentation: G5 Material<br />
The repeatability experiments showed that the compaction procedure developed using G2<br />
material proved to be adequate for the compaction of lesser quality granular materials such as<br />
G5 material. The G2 emulsion mix showed Dry Densities of around 103% Mod AASHTO and<br />
using the same procedure on the emulsion treated G5 material Dry Densities of around 100%<br />
Mod AASHTO were achieved; both these Dry Densities exceed the accepted level of site<br />
compaction. Looking at the Untreated material the same results were seen as with the emulsion<br />
mixes, the G2 material achieved Dry Densities of 103% Mod AASHTO and the G5 material<br />
achieved Dry Densities of 101% Mod AASHTO.<br />
5.6 Conclusions regarding variability<br />
The variability results of Subsection 4.7 show that the vibratory hammer does have a low variability<br />
in terms of specimen production. Therefore the vibratory hammer is capable of consistently<br />
producing laboratory specimens. The results also show in Subsection 4.7.6 that the Mod AASHTO<br />
compaction (at room temperature) is slightly less variable than the vibratory hammer compaction.<br />
The difference is only slight. The largest difference came from the BSM-foam which showed a<br />
difference of 0.67 from the Mod AASHTO COV at room temperature. The conclusion drawn from<br />
such a small difference is that the variability of vibratory hammer is very similar to the Mod AASHTO<br />
compaction.<br />
159
5.7 Conclusions drawn from the Mod AASHTO curves<br />
An interesting conclusion may be drawn when viewing the Mod AASHTO curves of the<br />
untreated material against the BSMs. The maximum Dry Densities produced for the BSMs were<br />
lower than the untreated material. This shows that the bitumen emulsion and foamed bitumen<br />
influence the level of compaction that may be achieved.<br />
5.8 Conclusions drawn from the Vibratory Hammer Moisture curves<br />
The moisture curves of the vibratory hammer showed in general (with the exception of the<br />
BSM-emulsion) that the graph moved slightly to the left of the Mod AASHTO moisture curve.<br />
This shows that the OMC of the vibratory hammer is slightly lower than that of the Mod<br />
AASHTO OMC; vibratory hammer OMC was typically around 90% of the Mod AASHTO OMC of a<br />
specific mix. The curves also showed that in general higher Dry Densities are achieved using<br />
the vibratory hammer at lower moisture contents.<br />
The vibratory hammer moisture curves showed that in general the accepted level of<br />
compaction, according to current standards, may be obtained at various moisture contents. The<br />
bitumen emulsion and untreated materials produced compaction levels that are very close to<br />
what would typically be accepted on site. The fact that the results are so close to accepted<br />
compaction levels leaves room for variability (specifically in the case of the high quality G2<br />
material which has an accepted level of compaction of 100 -102% Mod AASHTO (TRH 4) and<br />
with the vibratory hammer levels of 102-103% Mod AASHTO were achieved). Therefore in<br />
order to reduce this variability the compaction times may be increased by a factor of 2, this may<br />
produce samples that are well in excess of the accepted levels of compaction, but the variability<br />
may be reduced.<br />
5.9 Overall Conclusions and Observations Drawn from the Experiments<br />
A procedure using time to produce samples may be developed. This procedure should not be<br />
used to compact a sample after a pavement has been constructed with the intention to<br />
produced site representative samples. When the procedure using time to compact is compared<br />
to the procedure followed by the USA (ASTM D 7382 – 07) and New Zealand it is evident that<br />
the compaction time allocated from the experiment results is far less than what these two<br />
countries have specified in their compaction procedures. The reason for this is the compaction<br />
energy of the hammer. The compaction energy assigned by the USA is around 10 Joule, The<br />
Bosch GSH 11E® used by Stellenbosch University has a point energy during compaction of 27<br />
Joule, this is 2.7 times higher than specified by the USA, and will influence the compaction time<br />
of the various layers.<br />
160
The refusal densities of the various layers are variable. As was stated in the results, this is<br />
believed to be as a result of the variability of the grading of the individual layers. Although the<br />
final grading of a sample may be correct in relation to the grading curve of the material, the<br />
material of the individual layers may in fact have variability in relation to the grading curve.<br />
Much time is lost during the preparation of samples once compaction is completed. This is due<br />
to having to unscrew the bolts of the split mould and then having to dismantle the entire mould<br />
so as to remove the specimen and once removed the mould may at times be wiped clean,<br />
depending on how dirty it has become during compaction, and then re-assembled for the<br />
compaction of the next sample. This dismantling is necessary because the sample does have a<br />
tendency to stick to the walls of the mould, therefore it cannot merely be slid out of the mould.<br />
A not stick spray, this may be purchased at any supermarket, is used to treat the walls of the<br />
mould prior to the compaction of a sample; this reduces the sticking of the sample to the mould<br />
walls.<br />
An important point that was also noted was that at high moisture contents, particularly 90%<br />
and 100% OMC (Mod-U) the material in the mould began to stick to the bottom of the foot<br />
piece. The effect of this was that upon raising the vibratory hammer, large amounts of material<br />
from the compacted layer were removed from the mould. The compaction of the emulsion mix<br />
for prolonged periods of time had the effect that emulsified bitumen began to ‘squeeze out’<br />
between the walls of the mould and the foot piece. This ‘squeezing effect’ in the end results in<br />
lower binder content of the compacted sample. Also small amounts of water were seen seeping<br />
out at the base of the mould when compacting at high moisture contents (80%, 90% and<br />
100% OMC (Mod-U)) for prolonged periods of time.<br />
It was also noted that a times the interlocking between layers was not always adequate and the<br />
sample tended to break in this case when being picked up. Therefore adequate scouring of the<br />
surface of the compacted layer should be done, typically look to 10mm of scour. Also samples<br />
should be picked up from the bottom end, this is because, as was seen in samples that were<br />
too moist, the bottom end seemed at times as if it would fall off, and this is due to the size and<br />
mass of the sample. The typical mass of a sample of 150mm × 300mm was in the order of<br />
11kg and should the sample be picked up at the top end, the weight of the layers below each<br />
interlocking face will exert a tensile force on the section and if the interlocking is not strong<br />
enough the sample will break at those points.<br />
During the compaction of the G5 material at higher moisture contents (90%OMC to 110%OMC)<br />
it was noted that there was no seepage of water out from the bottom of the mould. Where in<br />
the case of the G2 material there was clearly water seeping out. The G5 material when wet had<br />
a very clayey appearance where the G2 did not. This clayey appearance may account for the<br />
161
water retention of the G5 material, as clay materials do have a high level of water retention,<br />
which may be the reason for the lack of seepage of water through the bottom of the mould.<br />
162
6 RECOMMENDATIONS<br />
Based on the results obtained from the experiments and the conclusions drawn, the following<br />
recommendations may be made.<br />
6.1 Reducing the loss of time<br />
The dismantling and re-assembling of the mould takes up a significant part of the sample<br />
preparation time. The removing and replacing of the bolts in particular consumes time.<br />
Therefore the mechanism of loosening and fastening the split mould and fastening the mould<br />
onto its steel base should be reviewed. As apposed to using nuts and bolts to fasten the mould,<br />
a type of clasp should rather be used. i.e. instead of having to unfasten the bolts, the clasps<br />
may merely be opened and the mould disassembled.<br />
4<br />
3<br />
Closed Clasp<br />
2<br />
1<br />
Opened Clasp<br />
Figure L.109: Split mould set up with clasps<br />
Figure L.109 shows the Mould (4) set up taken from the British Standards. A similar clasp<br />
system to this is proposed to mount the mould to the base; these clasps are shown by number<br />
2 on the figure and the base by number 1. The bolts used in the British Standards (number 3)<br />
should be replaced by clasps similar to those shown on the right of the mould set up; a total of<br />
four clasps would be need, two clasps on either side of the mould. It is also recommended that<br />
as apposed to two clasps being mounted to the base, that two more clasps be mounted; a<br />
clasp at the point marked 1 on the mould set up and a clasp directly across from it. This would<br />
bring the total number of clasps used to fasten the mould to the base to four which would<br />
provide enough support for the mould during compaction. It is believed that a clasp system<br />
similar to the one proposed would greatly speed up the process of producing samples.<br />
163
6.2 Reducing the loss of material<br />
The extension piece used to extend the split mould height so as to accommodate the final Layer<br />
of material just prior to compaction was taken from the moulds used for Mod AASHTO<br />
compaction. This piece does not fit tightly around the split mould used for the vibratory<br />
hammer compaction; instead there is a small surface space between the mould and the<br />
extension’s inner circumference; this is where material gathers while compacting Layer 5. An<br />
extension piece that fits exactly on the circumference of the split mould’s opening should be<br />
made; this will therefore reduce the amount of material lost in Layer 5.<br />
6.3 Vibratory Hammer Specifications<br />
From the research done the following Vibratory Hammer Specifications are proposed:<br />
Power rating:<br />
Frequency:<br />
Point Energy:<br />
1500 Watt consumption<br />
900 – 1890 beats/min (15 – 31.5Hz)<br />
25 Joule<br />
The vibratory Hammer should be mounted on two guide rods; one on either side of<br />
the hammer.<br />
The total mass of vibratory hammer, surcharge and mounting head should be 30kg<br />
± 1.5kg.<br />
The Bosch GSH 11E® vibratory hammer meets these specifications<br />
164
6.4 Procedure to be followed for compaction using vibratory hammer<br />
Based on the findings of this report the following compaction procedure is recommended when<br />
using the vibratory hammer.<br />
The compaction of a 150mm X 300mm sample of bitumen stabilized granular material will be<br />
performed using a vibratory hammer, e.g. the Bosch GSH 11E®, with a surcharge of 10kg<br />
mounted in a frame. Compaction of the material will take place with the aggregate at room<br />
temperature i.e. 25ºC. The layout of the procedure is similar to the layouts provided in the TG 2<br />
manual.<br />
1 APPARATUS<br />
1.1 A steel split mould 152mm in diameter and 300mm in height with an extension piece<br />
and clasps to fix the mould to the base of the frame.<br />
1.2 3 Circular papers with diameter of 152mm.<br />
1.3 Non-stick spray e.g. non stick cooking spray purchased at any supermarket.<br />
1.4 A Vibratory Hammer with the following Specifications (see note 4.3):<br />
Power rating:<br />
Frequency:<br />
Point Energy:<br />
1500 Watt consumption<br />
900 – 1890 beats/min (15 – 31.5Hz)<br />
25 Joule<br />
The vibratory Hammer should be mounted on two guide rods; one on either side of<br />
the hammer. A mounting head should be fitted to the vibratory hammer to allow a<br />
surcharge of 10kg to be mounted to the vibratory hammer. There should be a pulley<br />
system connecting the frame and mounting head. This allows for easy lifting and<br />
lowering of the vibratory hammer.<br />
The total mass of vibratory hammer, surcharge and mounting head should be 30kg<br />
± 1.5kg.<br />
1.5 A 150mm tamping foot<br />
1.6 Material Scoop (90mm Ф x 85mm h)<br />
1.7 Samples are compacted in 5 Layers.<br />
1.8 Suitable marker e.g. permanent marker<br />
1.9 Adjustable spanner to fasten and loosen surcharge load to the vibratory hammer.<br />
1.10 Steel ruler of length >300mm<br />
1.11 Chisel for tamping layers<br />
1.12 Drill with drill bit of 300mm with a point marked off 10mm from the tip of the bit.<br />
165
2 PROCEDURE<br />
2.1 Preparation of the material<br />
Preparing the sample of material for initial Moisture Curve<br />
Determine the grading curve of the aggregate (TMH 1) and reconstitute the material to<br />
produce samples that will be used to obtain the OMC of the natural (untreated) material<br />
using the Mod AASHTO compaction method (TMH1: Method A7).<br />
Develop a Mod AASHTO curve (dry density versus moisture content) for the appropriate<br />
BSM using the OMC of the untreated material. This is done for various moisture contents<br />
over a range of 60% of OMC (Mod-Untreated Material) to 110% of OMC (Mod-Untreated<br />
Material) or till the appropriate moisture curve is obtained.<br />
Preparing the sample of material for vibratory hammer compaction<br />
From the grading curve reconstitute the material to the produce a sample of 14kg (see<br />
note 4.1) of aggregate with a maximum particle size of 19mm. A total of 5 or 6 samples<br />
of 14kg each are needed for a moisture curve.<br />
The aggregate is prepared as follows:<br />
1. For a moisture curve samples are to be compacted over a range of moisture<br />
contents. Ranging from 2% moisture to 10 or 12% moisture; increasing in<br />
increments of 2%.<br />
2. Should cement or lime need to be added to a specific mix, add these first<br />
to the sample:<br />
3. For Untreated material i.e. no bitumen stabilization, add the fractions of<br />
water to each of the individual sample masses.<br />
4. For BSM-emulsion, the moisture content of the bitumen emulsion needs to be<br />
calculated out of the physical mass of water that is added by hand. An<br />
example of this calculation is as follows:<br />
166
Assumptions made for the example:<br />
A mix is to have a target moisture content of 6% moisture.<br />
The bitumen emulsion content of the mix is 3%.<br />
The bitumen emulsion is a 60/40 emulsion.<br />
For a 60/40 emulsion, 40% of the emulsion is water. Therefore of the 3%<br />
bitumen emulsion to be added to the mix, 40% of it is water. Therefore the<br />
fraction of water being added to the mix from the emulsion is 40% x<br />
3%÷100 = 1.2%<br />
The fraction of water that is to be added to the mix in order to obtain a<br />
moisture content of 6% is now 6%-1.2% = 4.8%. The physical mass of<br />
water to be added to the mix in order to give a target moisture content of<br />
6% when the bitumen emulsion is added is now 4.8% of the mass of the<br />
sample.<br />
First add the physical mass of water to the material and allow to stand for 40 –<br />
60 minutes. After this time add the bitumen emulsion to the mix and also allow<br />
to stand for 40-60 minutes to allow breaking of the bitumen emulsion.<br />
5. For the BSM-foam add the fractions of moisture to the material checking<br />
the ratio of the water relative to the OMC of the moisture curve developed for<br />
the untreated material from the TMH 1. When the moisture to be added reaches<br />
around 70-80% of the OMC of the untreated material, add this same moisture<br />
to the remaining samples and calculate the amount of moisture to be added to<br />
the sample to achieve the targeted moisture content. Prepare the BSM-foam in<br />
accordance with the procedure outlined in the TG (2) manual. After the foaming<br />
procedure add the remaining moisture to the samples mixed with moistures of<br />
70-80% of OMC of the untreated material.<br />
167
2.2 Compaction Procedure<br />
2.2.1 Prepare the mould and vibratory hammer<br />
Preparing the vibratory hammer<br />
Fix the Mounting Head to the vibratory hammer and fit hammer onto the<br />
guide rods. Place the 10kg surcharge load onto the mounting head and<br />
fasten tightly – see separate drawing for Mounting Head, Subsection 5<br />
(Kelfkens, 2008). Using the pulley system raise the vibratory hammer to the<br />
maximum height it can be raised or to an adequate height that will allow<br />
the operator to work beneath the vibratory hammer.<br />
Preparing the Mould<br />
Make sure the mould is clean and then spray the interior of the mould with<br />
the non-stick spray. After a sample has been compacted and removed from<br />
the mould, the mould should be cleaned by wiping of excess material from<br />
the mould walls. This should be done prior to the compaction of the next<br />
sample. Fix the mould to the base of the frame directly below the foot piece<br />
of the vibratory hammer using the clasps. Place two of the circular paper<br />
sheets at the base of the mould.<br />
Lower the vibratory hammer into the mould, checking that the vibratory<br />
hammer is perpendicular to the base of the mould i.e. the tamping foot is<br />
flat on the base with no point of the foot slightly raised. Allow the vibratory<br />
hammer to rest in the mould with no material present. Where the lower end<br />
of sleeve of the mounting head rests on the guide rod mark that position<br />
clearly on the vertical guide using the suitable marker. Raise the vibratory<br />
hammer and measure up from the initial mark 300mm and mark this clearly<br />
(non-erasable).<br />
2.2.2 Compaction of the sample<br />
Addition of material to mould<br />
Material is placed in the mould 1 using the material scoop. Fill the scoop<br />
with the prepared material and level off the scoop and place it in the mould.<br />
Add three scoops of material to provide a starting layer thickness of 92mm.<br />
168
Using the chisel, work the material around in order to evenly distribute it in<br />
the mould; try to distribute the particles evenly as well i.e. not too much<br />
fine material on top or to much coarse material on top, but rather a fair<br />
distribution of each i.e. unsegregated. Make sure the material is as level as<br />
possible before lowering the vibratory hammer till the foot piece comes to<br />
rest on the material.<br />
Compaction of individual layers<br />
Samples are compacted according to set times for each layer. The<br />
compaction times for the individual layers of a sample according to the type<br />
of Bitumen <strong>Stabilized</strong> Material is provided in Table L.29:<br />
Table L.29: Compaction times of individual layers for various BSMs<br />
Compaction Time of Individual layers Number in Seconds<br />
<strong>Mix</strong> type Layer 1 Layer 2 Layer 3 Layer 4 Layer 5*<br />
Untreated 10 15 15 15 15<br />
BSM-emulsion 10 15 15 15 15<br />
BSM-foam 10 25 25 35 25<br />
After the material of a layer has been compacted for the allocated time,<br />
raise the vibratory hammer. Using the drill, scarify the entire surface area of<br />
the top of the compacted layer to a depth of ± 10mm (see Note 4.2).<br />
After the surface of a respective layer has been scarified, add the material<br />
for the next layer and compact accordingly.<br />
*After Layer four has been compacted and scarified, the extension piece<br />
(collar) must first be fitted to the mould before adding the material for layer<br />
5. After adding the material for layer 5 place a circular sheet of paper on<br />
top of the material and then lower the vibratory hammer into position; the<br />
paper helps prevent material of the final layer from sticking to the tamping<br />
foot. Before raising the vibratory hammer the final height of the sample<br />
must be measured, once this is done the vibratory hammer may be raised<br />
and the sample removed.<br />
Measuring the final height of the specimen<br />
After Layer 5 has been compacted and prior to raising the vibratory hammer<br />
take the steel rule and measure the distance from the zero line to the<br />
169
ottom end of the sleeve. This distance is taken as the final height of the<br />
specimen.<br />
Removing and handling the compacted sample<br />
Raise the vibratory hammer and remove the extension piece (collar).<br />
Disassemble the mould entirely. Place a plastic bag over the sample and<br />
remove it taking care to pick the sample up from the bottom end. Weigh<br />
the sample after compaction to check the final mass of the sample.<br />
Checking the moisture content of the sample<br />
Take a small amount (750-950 gm) of BSM either just prior to during or<br />
after compaction and using the standard oven drying method determine the<br />
moisture content.<br />
Determining the final Dry Density<br />
From the moisture content determined, the final mass of the compacted<br />
sample and the final height measured the final Dry Density of the sample<br />
may be determined.<br />
2.3 Moisture sensitivity curve<br />
For the moisture sensitivity curve a total of 5 or 6 samples needs to be<br />
compacted at various moisture contents. This is described in Subsection 2.1.<br />
The curve is developed by plotting the final Dry Density of each of the<br />
samples against their respective final moisture contents. The peak, point at<br />
which the curve turns, is the OMC of the vibratory hammer and the<br />
Maximum Dry Density.<br />
Compaction specifications for site compaction<br />
The MDD of the vibratory hammer may be used to specify site compaction levels.<br />
The table below provides the levels of compaction:<br />
Table L30: Specifications for the level of site compaction<br />
Material Type/Quality Level of Site Compaction (% Vibratory Hammer)<br />
Untreated BSM-emulsion BSM-foam<br />
G1 and G2/G3 (High Quality) 98.6 - 100 98.6 - 100 96.1 – 98<br />
170
For G4 to G6 materials the fraction of Mod AASHTO compaction specified for the<br />
level of site compaction is to be used. An example of this is as follows: for a G5<br />
material the current specification for site compaction is 95% of Mod AASHTO<br />
compaction. Therefore according to the previous statement the accepted level of<br />
site compaction is 95% of vibratory hammer compaction.<br />
See Note 4.8<br />
The Moisture curve of the vibratory hammer may be compared to the moisture<br />
curve of the specific mix which was developed from the TMH 1: Method A7. The<br />
OMC values are then compared and the lower OMC of the two curves is used to<br />
specify the compaction moisture on site.<br />
171
3 CALCULATIONS<br />
3.1 Addition of lime or cement<br />
Cement or lime content (C/L)<br />
C/L (gm) = C/L (%) × 14000 ÷ 100<br />
3.2 Addition of water for untreated material<br />
Water (gm) = (target moisture content (%))/100× mass of sample (gm)<br />
3.3 Addition of stabilizer and water to Bitumen <strong>Stabilized</strong> Material (BSM)<br />
BSM-emulsion<br />
Mass of bitumen emulsion<br />
Emulsion mass (gm) = Emulsion content (%)/100 × dry mass of aggregate (gm)<br />
Moisture contents<br />
MC in BSM from emulsion (%) = (MC of emulsion (%))/100 × emulsion content (%)<br />
Mass of water added to BSM = (∆MC) × mass of sample (gm))<br />
100<br />
∆MC = X (%) - MC in BSM from emulsion (%)<br />
X = target moisture content of the mix<br />
BSM-foam<br />
The bitumen stabilizer is added according to the method provided in the TG 2 manual<br />
for preparing BSM-foam.<br />
Ratio of Moisture contents<br />
MC mix : OMC = X/ (OMC (untreated material))<br />
MC mix : OMC = Ratio of the targeted moisture content of the mix to the<br />
OMC (untreated material)<br />
X = target moisture content of the mix<br />
172
For MC mix : OMC > 0.8 (80%)<br />
Mf = X – (MC mix : OMC) previous mix × (OMC (untreated material))<br />
MF = Moisture added after foaming<br />
X = target moisture content of the mix<br />
(MC mix : OMC) previous mix = Final sample with a ratio ≤ 0.8<br />
3.4 Dry Density<br />
Volume of the sample = π × 0.005625 × Fh<br />
Fh = Final height of the sample<br />
Dry Density = (Fm(kg)/(1+(MC(%)/100)) ÷ Volume of the sample<br />
Fm = Final Mass of the sample<br />
MC = Moisture Content<br />
4 NOTES<br />
4.1 For a final sample of 300mm high a sample mass of 14kg is recommended when<br />
preparing the BSM.<br />
4.2 Layers should not be scarified deeper than 10mm. The result of scarifying deeper<br />
than10mm is that the layer being compacted does not bond adequately well to the<br />
previous layer and hence there is an increase in voids at this interface.<br />
4.3 Should the vibratory hammer not meet the specifications provided and where no<br />
suitable alternative compaction hammers can be sourced, then a vibratory hammer<br />
with a point energy of 25 Joule ± 2 Joule should be used. If the weight of the<br />
hammer deviates from the specifications by more than 5%, then calibration tests<br />
need to be made.<br />
4.4 After a sample has been compacted and removed from the mould, the mould should<br />
be cleaned by wiping off excess material from the mould walls. This should be done<br />
prior to the compaction of the next sample.<br />
173
4.5 When preparing the moisture curve, the material should be looked at carefully. It<br />
must be noted at which moisture content the material becomes muddy. This is due<br />
to when samples are prepared that are to be tested in the laboratory; material that<br />
is muddy may not produce samples that are representative of the site compaction<br />
(in terms of particle orientation). The samples should then be compacted at the<br />
moisture content immediately below the moisture content at which the material<br />
became muddy. Should samples be prepared in the laboratory for testing without<br />
first preparing a moisture curve, then low levels of moisture should be added to the<br />
sample and slowly increased until the operator is satisfied that the material is not<br />
muddy but adequately wet.<br />
4.6 When the sample prepared is to be used in the laboratory and the first four layers<br />
have been compacted, add sufficient material to layer five so that that the final<br />
height of the sample is 300mm or slightly higher. This is checked by viewing the<br />
final position of the sleeve relative to the 300mm marked of point on the guide rod,<br />
a tolerance of 2mm either side of 300mm is allowed. The sleeve may finish either<br />
on the mark, slightly above the mark or blow the mark. For each of the finishing<br />
positions a description of the procedure to be followed is given in a), b) and c).<br />
a) If the sleeve finishes on the 300mm mark after compacting layer 5, the<br />
sample is removed as previously described.<br />
b) If the sleeve finishes above the 300mm mark after compacting layer 5 a<br />
steel straight edge is used to cut of the piece of the sample extending out<br />
of the mould. Material is then sieved through a 4.75mm sieve on top of the<br />
sample. The vibratory hammer is the lowered and the sieved material is<br />
compacted till the sleeve reached the 300mm mark. The sample is then<br />
removed as previously described.<br />
c) If the sleeve finishes below the 300mm mark after compacting layer 5, the<br />
surface is scarified and three scoops of material are added. The added<br />
material is then compacted for the same duration as layer five and checked<br />
using a) and b) of note 4.6.<br />
4.7 Should 7 ply shutter board not be obtainable then a wooden base with material<br />
properties as close to those of the 7 ply shutter board should be used.<br />
4.8 The compaction specifications for site compaction need to be revisited as<br />
compaction data from sites become available.<br />
174
5 DRAWINGS AND PHOTOGRAPHS<br />
Positioning of<br />
dead weight<br />
Rubber<br />
fitting<br />
Sleeve<br />
127<br />
113<br />
Sleeve<br />
112<br />
870<br />
64<br />
50<br />
Figure L.110: Schematic drawing of the Mounting head for the Bosch GSH 11E®<br />
Mounting<br />
head<br />
10kg<br />
Surcharge<br />
Vertical<br />
guide rod<br />
Rubber<br />
Fitting<br />
Sleeve<br />
Figure L.111: Left view of Mounting head<br />
Figure L.112: Front view of Mounting head<br />
175
6 Summary of vibratory hammer compaction procedure<br />
Outlined in this summary is the sequential procedure of the vibratory hammer.<br />
Step 1<br />
When material is obtained that is to be compacted in the laboratory, the first step is to perform<br />
a grading on the material. Following the grading, samples for individual specimens are<br />
reconstituted from the grading results.<br />
Step 2<br />
The first set of samples reconstituted is samples with a mass of 7kg that are used to perform a<br />
moisture sensitivity analysis using Mod AASHTO compaction (TMH 1: Method A7). Two moisture<br />
sensitivity analyses are performed. The first is an analysis on the untreated material, i.e.<br />
material only having moisture added to it and not having under gone bitumen stabilization. The<br />
OMC of the untreated material (OMC-U) is obtained from this the first analysis (Figure L.113).<br />
MDD<br />
Moisture Sensitivity curve -<br />
Untreated Material: Mod AASHTO<br />
Dry Density<br />
(kg/m3)<br />
OMC-U<br />
Moisture Content (%)<br />
Figure L.113: Moisture Cure:<br />
Mod AASHTO- Untreated<br />
The second analysis is a moisture sensitivity analysis on the BSM i.e. the material after it has<br />
under gone bitumen stabilization. This analysis is performed using the OMC-U to determine the<br />
moisture content of each sample. A fraction of the OMC-U is added to the material prior to<br />
bitumen stabilization that will provide the target moisture content once the material has under<br />
gone bitumen stabilization. The fractions of OMC-U start at 60% increasing in increments of 10<br />
until 110%. From this analysis the OMC of the BSM material is obtained (Figure L.114).<br />
176
Moisture Sensitivity curve - BSM:<br />
Mod AASHTO<br />
MDD<br />
Dry Desnity<br />
(kg/m3)<br />
OMC-BSM<br />
Moisture Content (%)<br />
Figure L.114: Moisture Cure:<br />
Mod AASHTO- BSM<br />
Step 3<br />
The second set of samples reconstituted is samples with a mass of 14kg. These are used for to<br />
perform the moisture sensitivity analysis for the vibratory hammer. At least 5 samples should be<br />
reconstituted.<br />
Cement or lime is first added to the material; should the mix being prepared require these<br />
stabilizers. Moisture is then added to the material in varying amounts across the samples. The<br />
moisture added starts at 2% moisture for sample 1 increasing in increments of 2% until a<br />
content of 10 or 12% for the final sample. The material is then allowed to stand for ± 60<br />
minutes. The bitumen stabilizer (Emulsion or Foamed) is then added after the 60 minute time<br />
period. The material is once again allowed to stand for ± 60 minutes to allow for the breaking<br />
of the bitumen.<br />
Step 4<br />
The mould and vibratory hammer are prepared as outlined in 2.2.1 of the procedure.<br />
Step 5<br />
Each sample is compacted individually to produce a specimen for a specific sample. Specimens<br />
are compacted in five layers. Material from the specific sample is placed into the mould using a<br />
material scoop. Three scoops of material per layer are placed into the mould and each layer is<br />
compacted for a set period of time (Table L.29).<br />
Step 6<br />
177
Prior to removing each specimen from the mould the final height of the specimen is measured.<br />
The specimen is then removed and the final mass is measured. The remaining material from<br />
the sample is used to perform a moisture content test for that specimen. The Dry Density of<br />
each sample is then calculated.<br />
Step 7<br />
The moisture curve for the vibratory hammer is plotted. This is done by plotting the Dry Density<br />
of each specimen against its own moisture content. All specimens are plotted on the same set<br />
of axis. The Maximum Dry Density and OMC of the vibratory hammer are then read off the<br />
curve (Figure L.115).<br />
Moisture Sensitivity curve - BSM:<br />
vibratory hammer<br />
MDD<br />
Dry Density<br />
(kg/m3)<br />
OMC-vib<br />
Moisture Content (%)<br />
Figure L.115: Moisture Cure:<br />
vibratory hammer- BSM<br />
Step 8<br />
The Maximum Dry Density for the vibratory hammer is then used to specify the target level of<br />
compaction for site (Subsection 2.3 of this procedure).<br />
Step 9<br />
The OMC of the vibratory hammer (OMC-vib) is then compared to the OMC of the Mod AASHTO<br />
compaction for the specific mix. The lower OMC of the two is then selected for site compaction.<br />
See the figures below.<br />
Figures L.113 to L.115 show that the OMC of the vibratory hammer is typically lower than the<br />
Mod AASHTO OMC. The BSM-emulsion however may provide a curve which has an OMC-vib<br />
higher than the Mod AASHTO OMC. Therefore it becomes necessary to compare the moisture<br />
curves of the vibratory hammer and Mod AASHTO compaction methods as the lower OMC is<br />
used for site specification.<br />
178
Step 10<br />
Should specimens be prepared in the laboratory for testing purposes then specimens are<br />
compacted at 100% of OMC-vib.<br />
179
REFERENCES<br />
Muthen, KM, 1998, Contract <strong>Report</strong> CR-98/077, CSIR<br />
Hanekom, R, 2007, University of Stellenbosch, Thesis V08, Compaction of Cold <strong>Mix</strong>es using the Kango<br />
Hammer Method<br />
Prochaska, A.B., and Drnevich, V.P., (2005), “One-Point Vibrating Hammer Compaction Test for Granular<br />
Soils,” Proceedings, GeoFrontiers Conference, ASCE, Austin, TX, January, 25 p.<br />
BS EN 12697-32:2003, 2004, <strong>Bituminous</strong> mixtures-Test methods for hot mix asphalt Part 32: Laboratory<br />
compaction of bituminous mixtures by vibratory compactor, University of Nottingham, Uncontrolled Copy, ©<br />
British Standards<br />
Thenoux, G, Jamet, A, Encina, C, 2004, A Study and Recommendations of a <strong>Mix</strong> <strong>Design</strong> Procedure Using<br />
Gyratory Compactor for Foamed Asphalt Recycled Material, School of Engineering Universidad Católica de<br />
Chile<br />
Jönsson, M, Partl, MN, Flisch, A, 2002, Comparison of Different Compaction Methods Using X-ray Computer<br />
Tomography, EMPA<br />
Van de Ven, M, et al, , Gautrans, 1997, ITT <strong>Report</strong> 18.1-1997 Investigation into the Feasibility of Scaling<br />
Granular <strong>Materials</strong> for use with the MMLS Trial Tests on G1, Waterbound and ETB, Institute for Transport<br />
Technology<br />
Theyse, HL, 2003, Confidential CSIR Contract <strong>Report</strong> CR-2003/23 First Level Analysis <strong>Report</strong>: HVS Testing of<br />
the Foamed-treated crushed stone base on the N7/1 near Cape Town,<br />
Theyse, HL, 2004, Restricted CSIR Contract <strong>Report</strong> CR-2004/38 The Compaction Potential of Foamed- and<br />
Emulsified Bitumen Treated Material, Pretoria<br />
ASTM Standard D7382, 2007, “Standard Test Methods for Determination of Maximum Dry Unit Weight and<br />
Water Content Range for Effective Compaction of Granular Soils Using a Vibrating Hammer,” ASTM<br />
International, West Conshohocken, PA, www.astm.org.<br />
TNZ B/02, 2005, “Specifications for Construction of Unbound Granular Pavement Layers”, Transit New<br />
Zealand<br />
NZS 4402, 1986,”Test 4.3.1 New Zealand vibrating hammer compaction test”, New Zealand Standards,<br />
Wellington,<br />
180
Draft TRH 4, 1996, “Structural <strong>Design</strong> of Flexible Pavements for Interurban and Rural Roads”, Pretoria,<br />
South Africa,<br />
CSRA, 1987, Standard Specifications for Road and Bridge Works 1987, Committee of State Road Authorities,<br />
Pretoria<br />
Sabita, 1993, GEMS-The design and use of granular emulsion mixes, Sabita, Roggebaai, South Africa<br />
MH 1, 1986, “STANDARD METHODS OF TESTING ROAD CONSTRUCTION MATERIAL”, National Institute for<br />
Transport and Road Research, Pretoria, South Africa<br />
Web Sites<br />
Miller group & Associate authors, 2004, http://www.millergroup.ca/pavement/emulsion_mixes.html, July 22,<br />
2008 (11:28 AM)<br />
Patent Storm, http://www.patentstorm.us/patents/6451885-description.html, July 22, 2008 (11:29 AM)<br />
181