Updating Bituminous Stabilized Materials Guidelines Mix Design Report Phase II
Curing Protocol: Improvement - Asphalt Academy
Curing Protocol: Improvement - Asphalt Academy

You also want an ePaper? Increase the reach of your titles
YUMPU automatically turns print PDFs into web optimized ePapers that Google loves.
APPENDIX G<br />
Technical Memorandum<br />
<strong>Updating</strong> <strong>Bituminous</strong> <strong>Stabilized</strong> <strong>Materials</strong> <strong>Guidelines</strong>: <strong>Mix</strong><br />
<strong>Design</strong> <strong>Report</strong>, <strong>Phase</strong> <strong>II</strong><br />
Task 7: Curing Protocol: Improvement<br />
AUTHORS:<br />
Final <strong>Report</strong>: Sept 2008<br />
KJ Jenkins<br />
PK Moloto<br />
1
1. INTRODUCTION<br />
In 2002, the Asphalt Academy published an Interim Technical Guideline (TG2) titled “The <strong>Design</strong> and Use of<br />
Foamed bitumen Treated <strong>Materials</strong>”. TG2 guideline currently includes mechanistic empirical structural<br />
design models for foamed bitumen treated materials for use in the South African Mechanistic-Empirical<br />
<strong>Design</strong> Method (SAMEDM). Consequently, various projects have been initiated to develop similar design<br />
models for incorporation into an equivalent guideline document on emulsified bitumen treated materials.<br />
Thus far, the South African Bitumen Association (Sabita) and the Gauteng Department of Transport and<br />
Public Works (GDPTRW) have contributed significantly to improvement of TG2 Foamix Material Guideline.<br />
Further contributions have also aimed at addressing shortcomings of the current mix design and pavement<br />
design methods for bitumen stabilized materials.<br />
The research conducted in this study forms part of phase <strong>II</strong> process of the Bitumen Stabilised Material<br />
Guideline improvement initiative. The initiative aims to address areas of concern in the cold mix design<br />
procedures for foamed and emulsified bitumen treated materials. The following shortcomings as outlined in<br />
the <strong>Phase</strong> <strong>II</strong> process, need investigation:<br />
• The lack of a suitable laboratory curing method that is adequately linked to field curing.<br />
• The use of UCS and ITS tests for mix design and classification as applicable to foamed bitumen.<br />
• The need for appropriate tests for assessing mix properties and performance, such as flexibility, shear<br />
strength and durability.<br />
The CIPR pavement design process involves testing of representative specimens of foamed and emulsified<br />
treated materials as means to evaluate pavement performance over time. To adequately acquire<br />
representative specimens, it is necessary to condition the materials in a process called curing.<br />
Although curing procedures have been adopted in many countries on different continents, the protocols are<br />
varied and an accepted procedure is currently not available. The lack of representation is due to complex<br />
process of curing simulation, as emphasized by the following challenges:<br />
• The complex composition and types of cold mixes to be conditioned in terms of:<br />
o Binder type and content<br />
o Active filler type and content<br />
o Aggregate grading and type (porosity, parent rock, petrography)<br />
o Binder dispersion within the mix<br />
o Moisture content after compaction<br />
o Voids in the mix and particle orientation (linked to compaction method)<br />
• Climate in the area of application (temperature, evaporation and relative humidity conditions)<br />
• Mechanical properties<br />
• Time duration since construction that is being simulated<br />
• Service environment: Traffic effects and position of cold mix layer in the pavement structure<br />
In line with the abovementioned challenges, the proposed research presented in this study aims to develop a<br />
suitable accelerated curing protocol for bitumen stabilized materials intended for application in industrial<br />
laboratories across South Africa.<br />
1.1. Scope of Work<br />
2
Recent research and publications have primarily focused on ways of refining and improving the curing<br />
protocols for cold mixes. Despite valuable attempts, most focus has primarily been devoted to either foamed<br />
or emulsion mixes, but rarely to developing a unified approach for both types of cold mixes.<br />
For this reason, as a result of not having a unified curing approach for both types of cold mixes, comparative<br />
data for accelerated curing techniques on different types of cold mix is currently not available. Moreover, the<br />
current non standardised curing protocols as adopted in South Africa make it difficult to compare results of<br />
performance tests carried out on bitumen stabilized materials.<br />
Furthermore, although additional research is needed, considering the environmental conditions required for<br />
an emulsion to “break” (flocculate, coalesce and densify) and then cure, relative to foamed bitumen (more<br />
simply water repulsion), it is unlikely that a single curing process will have the desired effect on both.<br />
During the initial stages of the research, it was important to establish a system of criteria for evaluation and<br />
validation of revised accelerated laboratory curing protocol. The following three phases played a significant<br />
role in guiding the investigation process:<br />
<strong>Phase</strong> I: Formulation and Validation of Project Scope & Testing Criteria<br />
There’s general concern in the South African industry regarding how long laboratory specimens need to be<br />
cured prior to performing laboratory testing protocols. Generally, most researchers regard ambient curing of<br />
3 days or even 7 to 28 days as safest option for simulating field curing.<br />
Kekwick (2004) highlighted the following findings emerging from an investigation that evaluated current<br />
curing practices:<br />
• There’s currently no conformity either nationally or internationally on laboratory practices<br />
• Realistic characterisation of bitumen stabilised materials demands that laboratory processes must<br />
closely reflect field conditions, especially regarding timing of mixing process, compaction of<br />
specimens and laboratory curing<br />
• Field properties for any given mix will vary due to differences in environmental/climatic factors which<br />
influence the development of binder matrix.<br />
Kekwick (2004) further emphasised that no standard laboratory curing method, in which time period,<br />
temperature and/or humidity are prescribed, will give consistent correlation with key field properties.<br />
Kekwick therefore recommended that curing under ambient temperature and humidity conditions day and<br />
night, but without direct exposure to sun or rain be adopted for most reliable comparison of laboratory and<br />
field properties.<br />
Kekwick (2005) also proposed that materials stiffness as interpreted by the tangent modulus from a stressstrain<br />
response measured in a modified CBR-type compression test be considered instead of ITS or UCS<br />
testing for the monitoring of curing process on the enhancement of material performance over time.<br />
Following the above, it became apparent to investigate the effects of ambient curing on material<br />
performance over time. Moreover, the effects of short and long term curing were studied, with an emphasis<br />
on moisture monitoring, the time it takes for various materials to yield equilibrium moisture content (EMC)<br />
and tangent modulus performance of these materials.<br />
The following influences/factors and/or areas of concern when dealing with curing of bitumen stabilised<br />
materials are addressed in this study:<br />
• Ambient curing: Temperature and relative humidity conditions<br />
3
• Long term effects on material curing and tangent modulus performance<br />
• Different materials considerations<br />
• Foam and emulsion binder types<br />
• The use of active fillers and its influences on curing rate<br />
• Specimen size considerations<br />
In conclusion, factors arising from <strong>Phase</strong> I which needed to be incorporated in the final laboratory curing<br />
protocol were validated. Furthermore, the adopted resilient modulus testing protocol for monitoring<br />
accelerated curing effects was initiated for both <strong>Phase</strong> <strong>II</strong> and <strong>Phase</strong> <strong>II</strong>I of the research methodology.<br />
<strong>Phase</strong> <strong>II</strong>: Field Monitoring and Validation<br />
The newly constructed CIPR BSM-emulsion section on the N7 carriage highway from Cape Town towards<br />
Malmesbury served as project for field monitoring. The monitoring process involved both the construction<br />
phase and analysis/service period of up to 7 months.<br />
The following key factors were monitored and investigated:<br />
• Temperature and relative humidity conditions in the CIPR layer at variable depth positions<br />
• Moisture content behaviour over 7 months using extracted samples<br />
• Is situ stiffness performance during construction and service period<br />
In situ resilient modulus performance and its correlation to field compaction was thoroughly researched.<br />
Laboratory stiffness performance criteria and compaction methodology were established. Furthermore,<br />
findings arising from monitoring field performance were further used to validate curing of bitumen stabilised<br />
materials in <strong>Phase</strong> <strong>II</strong>I.<br />
<strong>Phase</strong> <strong>II</strong>I: Laboratory Investigation and Improvement<br />
Formulation of test matrix and performance criteria as validated from both <strong>Phase</strong>s I and <strong>II</strong> followed a<br />
comprehensive laboratory investigation. This led to the following factors being investigated:<br />
• Laboratory stiffness and moisture performance linked to field trends<br />
• Influence of curing temperature on resilient stiffness and moisture content<br />
• Application and influences of different active fillers on curing of bitumen stabilised materials<br />
• Boundaries of application for foam & emulsion mixes in the revised accelerated curing protocol<br />
Subsequent to the widespread investigations from <strong>Phase</strong> <strong>II</strong>I, conclusive results were put together with the<br />
revised accelerated curing protocol being fabricated.<br />
Findings pertaining to the investigation throughout the different phases will be discussed in detail in<br />
proceeding chapters.<br />
In this research project, the following limitations are applicable:<br />
• The full scale on site curing was limited to Western Cape’s climatic environment<br />
• The N7 CIPR pavement was treated with emulsion binder and cement (active filler)<br />
• Construction of the CIPR layer involved ambient exposure of up to 14 days for the purpose of<br />
moisture extraction prior to construction of hot mix asphalt.<br />
• In terms of timing of field construction, the construction process took place from February (Summer)<br />
to May (Autumn) 2007, whilst analysis and monitoring of service period continued into November<br />
(Spring) 2007.<br />
• The curing experimentation was primarily limited by N7 G2 hornfels graded crushed rock material.<br />
4
In line with scope of work relative to this thesis as per phase <strong>II</strong> process of the Bitumen Stabilised Material<br />
Guideline improvement initiative, the following key factors were taken into consideration during curing of<br />
bitumen stabilised materials and the underlined phases:<br />
(a) Moisture<br />
In South Africa equilibrium moisture content (EMC) in bitumen stabilised materials after several years in the<br />
field can be estimated given certain material properties and climatic parameters. Moisture content in the mix<br />
during curing can be controlled by sealing specimens or curing at a set relative humidity. Moreover,<br />
emulsion mixes hold significantly more moisture than foamed bitumen and are less hydrophobic during the<br />
initial stages than foamed bitumen.<br />
(b) Temperature<br />
Temperature is an important parameter as it influences curing rate, binder ageing and binder dispersion in<br />
the mix, amongst other factors. Generally, curing temperatures above the Ring and Ball softening point<br />
should be avoided, as this temperature causes the binder to flow which can alter mix properties adversely<br />
and may result in unrepresentative ageing of the binder.<br />
(c) Active Filler<br />
Hydration time, and hence curing time as well as high temperatures have different effects on bitumen<br />
stabilised materials that have active filler content as a variable. Emulsion treated mixes with cement as a<br />
variable require a longer ambient cure time than mixes with no cement.<br />
(d) Mechanical Properties<br />
Dynamic properties of bitumen stabilised materials are important for defining the performance of these<br />
mixes. Stiffness values of the mix provide the most representative benchmark for validating how<br />
representative the accelerated curing has been and whether the mix duly represents the field equivalent.<br />
In order to capture the influence of the abovementioned variables on accelerated cured mixes, the following<br />
options as outlined in phase <strong>II</strong> process of the Bitumen Stabilised Material Guideline improvement initiative<br />
needed to be incorporated towards standardizing the curing protocol:<br />
• Implementation of standard procedure possibly with fixed temperature and curing times as means to<br />
obtain empirically comparable mixes for classification or ranking purposes (after mechanical testing).<br />
• Implementation of standard temperature with different exposure times for moisture loss, so that<br />
representative equilibrium moisture content (EMC) can be aimed for after curing, followed by mechanical<br />
testing.<br />
• The Resilient Modulus should be selected as key parameter by which the appropriateness of cured<br />
material is measured.<br />
• Although a standard curing protocol may have empiricism built into the procedure, “reasonable<br />
appropriateness” should be strived for. Standardisation of the procedure should be a priority.<br />
1.2. Objectives<br />
5
The objectives of the accelerated curing protocol as per phase <strong>II</strong> process of the Bitumen Stabilised Material<br />
Guideline can be split into two main components, namely, Improvement and Validation of the amended<br />
curing protocol. The following deliverables apply to both components:<br />
Curing: Task 7 - Improvement<br />
1. Investigate potential curing protocols already identified as providing equivalent moisture content in terms<br />
of resilient modulus reflective of field stiffness.<br />
2. Identify boundaries of applicability (if any) regarding curing protocol for foamed and emulsion binder<br />
type BSMs.<br />
Curing: Task 8 - Validation<br />
1. Observe the change in field moisture in the BSM layer with time<br />
2. Observe the change in field stiffness in the BSM layer with time<br />
3. Try to relate both field moisture and stiffness trends<br />
4. Devise and validate accelerated laboratory curing procedure in terms of field resilient modulus<br />
5. Develop a unified curing protocol for both foam and emulsion mixes<br />
The main concluding objective was to develop a unified curing protocol for both foamed and emulsion mixes.<br />
Moreover, one of the main objectives was to improve current accelerated curing protocols already identified<br />
as providing equivalent moisture content (EMC) in terms of laboratory resilient modulus reflective of field<br />
stiffness and moisture trends. The undertaken research has addressed objectives as outlined above and<br />
detailed findings have been incorporated in proceeding chapters. Conclusions have been drawn and further<br />
research recommendations have been presented.<br />
6
2. LITERATURE REVIEW<br />
This chapter explores some of the few critical findings relative to curing as published by various known<br />
researchers around the world. Most of the presented findings will assist in addressing the objectives of the<br />
research study and the espousal of research methodology.<br />
In pursuit to address the curing challenge, a range of aspects pertaining to the curing process have been<br />
thoroughly explored. Due to the vast amount of challenges on curing of bitumen stabilized materials, focus<br />
has been applied to aspects that are widely accepted as important parameters to investigate when<br />
addressing curing.<br />
In view of the adopted research methodology, this chapter strives to achieve the following objectives:<br />
• Provide an understanding on the appropriateness and application of laboratory mechanical tests used in<br />
the curing evaluation of bitumen stabilized materials<br />
• Explore the influence of active filler types on moisture behaviour and stiffness performance over variable<br />
temperatures and time<br />
• Gain understanding on the application of seismic pavement devices used for monitoring in-situ stiffness.<br />
Furthermore, the appendix section of the thesis will provide assistance in gaining extensive understanding of<br />
the presented literature. References will also be provided to refer readers to more detailed research<br />
supportive of the presented information.<br />
2.1. Historical Overview and Recent Curing Developments<br />
Following recent research, findings have shown that bitumen stabilized materials do not acquire their full<br />
strength after compaction until a large percentage of moisture content is lost in the mix. As a result, curing<br />
is a process whereby bitumen stabilized materials gain strength over time accompanied by a reduction in the<br />
moisture content.<br />
Current practices for accelerated laboratory curing are extremely vast and tend to vary significantly between<br />
diverse institutions. Subsequently, the following three distinct periods exist in the development of<br />
accelerated curing protocols:<br />
Early Curing Procedures (Pre-2000)<br />
Bowering (1970) stated that laboratory specimens only develop full strength after a large percentage of the<br />
mixing moisture has been lost. The biggest challenge in simulating field cure is the complexities involved in<br />
modelling laboratory curing of a specific material in a particular environment. The later challenge led to the<br />
development of different curing protocols by various researchers as providing equivalent field curing. A<br />
summary of these accelerated curing protocols are summarized in Table 0.1 below:<br />
7
Table G.1: Different Curing Methods utilised for Foamed <strong>Mix</strong>es (Jenkins, 2000)<br />
Curing Method Equivalent Field Cure Reference<br />
3 days @ 60ºC + 3 days @ 24ºC Unspecified Bowering (1970)<br />
3 days @ 60ºC Construction period + early field life Bowering and Martin<br />
(1976)<br />
3 days @ 60ºC Between 23 & 200 days from Vane Shear Acott (1980)<br />
Tests<br />
1 day in mould Short term Ruckel et al. (1983)<br />
1 day in mould +1 day at 40ºC Between 7 and 14 days (Intermediate) Ruckel et al. (1983)<br />
1 day in mould +3 days at 40ºC 30 days (Long term) Ruckel et al. (1983)<br />
1 day @ 38ºC 7 days Asphalt Institute (1992)<br />
10 days in air + 50 hours @ 60ºC Unspecified Van Wijk and Wood (1983)<br />
3 days @ ambient temp. + 4 days vacuum Unspecified Little et al. (1983)<br />
dessicat.<br />
3 days @ 23ºC Unspecified Roberts et al. (1984)<br />
3 days @ 60ºC Unspecified Lancaster et al. (1994)<br />
3 days @ 60ºC 1 year Maccarrone et al. (1994)<br />
Note: 1. Specimens are cured in an unsealed state in the oven, unless otherwise stated.<br />
2. Brennen et al. (1981) developed the procedure to first cure the foamed specimens in the<br />
mould for 24 hours during the most fragile period.<br />
3. Vacuum desiccation methods are in line with the Asphalt Institute design procedure (PCD-1)<br />
and require further investigation.”<br />
The vast amount of curing protocol developed by various researchers pre-2000 made it extremely difficult to<br />
develop uniform standards of practice for the purpose of generating sound representative data of tested<br />
cured materials from different researchers for comparison reasons.<br />
In the aim to address the problem, Sabita (1993) proposed the use of 3 days at 60ºC for granular emulsion<br />
mixes in order to simulate long term field cure of granular materials. In the same period Marais and Tait<br />
(1989) recognised that the material properties of emulsion mixes changed seasonally with significant<br />
variation in the first 6 months to 2 years.<br />
The most significant contributions relative to accelerated curing were made by Lee in 1981 when he<br />
highlighted the following key points:<br />
(a) A recommendation that due to the effect of curing on the strength development of foamed mixes, mix<br />
design of foamed mixes should be locally based, using information obtained from trial sections.<br />
(b) Both curing temperature and the presence or absence of a mould during curing have a direct impact on<br />
moisture content of the specimen, which invariable affects mix behaviour, particularly the Marshall<br />
Stability values.<br />
Lee highlighted the importance of moisture considerations when selecting a curing procedure. Most<br />
researchers and mix designers in the period up to the year 2000 had ignored the importance of moisture<br />
content of cold mix during curing simulations. Residual moisture contents of less than 0.5% after oven<br />
curing at 60ºC were common.<br />
Lee’s findings mainly highlighted the need to link laboratory curing procedure with a mix property.<br />
Consequently, the effects of curing are material property dependent.<br />
8
Adjusted Curing Procedures (1999 to 2004)<br />
The 1999 to 2004 era marked an improvement towards curing procedures. The noticeable curing<br />
improvements were mainly driven by CIPR projects around South Africa. Following Lee’s findings, an<br />
improvement towards curing temperatures of cold recycled mixes followed, with temperatures of 60ºC being<br />
considered too high. The 60ºC curing temperature is above the softening point temperature of the base<br />
binder and may cause visual redistribution and dispersion of the bitumen.<br />
Subsequently, the most noticeable improvement followed when a target moisture content equivalent to field<br />
equilibrium moisture content (EMC) of the cold mix after curing for a specified period was established<br />
(Jenkins, 2000).<br />
A summary of the revised curing protocols is presented in Table 0.2.<br />
Table G.2: Amended Curing Procedures for Cold <strong>Mix</strong>es from 1999 to 2004<br />
Curing Method Equivalent Field Cure Reference<br />
24 hrs @ ambient + 48 hrs @ 40ºC (OMC8%)<br />
(1 year field cure?)<br />
7 days @ ambient & 28 days @ ambient Emulsion + cement<br />
Sabita (1999)<br />
Emulsion + no cement<br />
24hrs @ ambient in mould + 3 days @ 40ºC (sealed) 6 months field cure (foam) Asphalt Academy (2002)<br />
24 hrs @ 40ºC (sealed) + 48 hrs @ 40ºC ambient Medium term cure (foam and Robroch (2002)<br />
(unsealed)<br />
emulsion)<br />
24 hrs @ ambient 25ºC (unsealed) + 48 hrs @ 40ºC<br />
(sealed)<br />
Long term foamed mix cure (1<br />
to 2 years)<br />
Houston and Long<br />
(2004)<br />
24 hrs @ ambient (unsealed) + 48 hrs @ 40ºC Medium term cure (foam and Wirtgen (2004)<br />
(sealed) + 3 hrs cooling @ ambient (unsealed) emulsion)<br />
20 hrs @ 30ºC (unsealed) + 2x24 hrs @ 40ºC<br />
(sealed – change bag midway)<br />
Medium term cure (foam and<br />
emulsion)<br />
Stellenbosch University<br />
(2004)<br />
As observed in Table 0.2, curing temperatures of 40ºC were commonly used as means to retain field<br />
moisture conditions at the end of curing. Although the TG2 protocol resulted in making the cured specimens<br />
too moist as a result of sealing briquettes completely, several researchers adjusted the TG2 approach<br />
following 2002.<br />
The influence of active fillers was incorporated in the Sabita (1999) guideline were stipulation were made for<br />
non elevated temperature curing. In the case of using cement for emulsion mixes, a 7 day cure at ambient<br />
temperature was proposed whilst for no cement mixes a 28 day ambient temperature cure was suggested.<br />
Quest for Unified Curing Method (2005+)<br />
Following recent trends in various curing protocols, the need for unified curing protocol method became<br />
increasingly apparent. The developments towards a unified curing protocol to date have been mainly<br />
pursued by Malubila (2005) and Kekwick (2005). As part of his thesis, Malubila evaluated many of the new<br />
curing protocols for foamed mixes developed subsequent to TG2 including those listed in Table 0.2. Also,<br />
Malubila re-evaluated the prediction models for equilibrium moisture content (EMC) of foamed mixes based<br />
on material properties of optimum moisture content (OMC), binder content (BC) and climate. Malubila<br />
carried out field tests on pavements incorporating these materials across South Africa and one case in<br />
Zambia. The following findings emerged from Malubila’s research:<br />
9
• The development of separate EMC prediction models for foamed bitumen mixes produced from<br />
either coarse gravels or sands, each with good correlation coefficients.<br />
• The curing protocol method proposed by Houston and Long (2004) as outlined in Table 0.2 provides<br />
the best correlation of specimen moisture content with field moisture content after several years.<br />
• The UCS values obtained from specimen tested after accelerated curing are in the same order as<br />
UCS for field cores after several years, although significant variability exists.<br />
Findings also highlighted that the most evident shortcoming of the TG2 guideline is the solely strength<br />
approach based classification system for foamed mixes using ITS and UCS results. Kekwick (2005) proposed<br />
that the materials stiffness as interpreted by the tangent modulus from a stress-strain response measured in<br />
a modified CBR-type compression test be considered instead of ITS or UCS testing. Kekwick also suggested<br />
that curing time at ambient temperature that yields laboratory stiffness comparable to the resilient modulus<br />
used in the mechanistic design be established.<br />
As a result, an acceptable curing period would imply that a reasonable design modulus has been selected for<br />
the cold mix in question.<br />
Recent Curing Developments<br />
In Europe, both Brown and Needham (2000) particularly investigated the influence of cement in emulsion<br />
mixes. Findings from their research concluded that, although cement dramatically increases mix stiffness, it<br />
does not necessarily repel moisture from the mix.<br />
The OPTEL project in Europe (Potti et al, 2002) which deals with “Optimisation of slow setting cationic<br />
bituminous emulsions for construction and maintenance of roads” has initiated a quest for rational methods<br />
to improve mix design methods.<br />
The OPTEL project investigated procedures to improve the reliability of cold mix evaluation. This led to<br />
findings supporting a range of curing protocols with different combinations of temperatures (18ºC or 50ºC)<br />
and relative humidity conditions (10% or 50%). Although a conclusive unified curing protocol could not be<br />
established from the project, one conclusion emphasized that the most effective way to accelerate water<br />
reduction in a specimen without significantly altering material mix properties is achieved through humidity<br />
reduction rather than an increase in temperature. The later was supported by similar trends in adjustment of<br />
curing protocols by South African practitioners.<br />
Colas mix design procedure curing procedure distinguishes between fresh and cured cold mix. The curing<br />
protocol uses different application times of temperature (18ºC or 35ºC) and relative humidity conditions<br />
(20% or 50%). Serfass et al. (2004) designate that in moderate regions a curing procedure of 14 days at<br />
35ºC and 20% relative humidity simulates a period of 2 to 3 years of field curing. Serfass et al. (2003) also<br />
highlighted the importance of temperature by showing its effects on the ultimate mix stiffness. Serfass later<br />
concluded that equivalent modulus values are considered to be a more accurate reflection of the influence of<br />
curing.<br />
Saleh (2004) also emphasized the international trends towards the use of resilient modulus as a key material<br />
parameter. He further used ITT stiffness to expose the influence of curing and moisture content on the<br />
change in mix properties, as well as to validate the selection of design binder content for the mix.<br />
2.2. Mechanisms of Curing<br />
Mechanisms of curing relate to well defined factors governing curing of bitumen stabilised materials. As<br />
noted in this portion of literature review, most factors driving curing are usually material specific and<br />
environmentally linked.<br />
10
Consequently, mechanisms and scientific laws governing curing of bitumen stabilised materials have been<br />
extensively explored with an emphasis on specific materials properties and environmental effects. As a<br />
result, only principal factors governing curing as confirmed by most researchers have been investigated.<br />
Moreover, conclusions have been drawn regarding factors to be cognisant of when devising laboratory curing<br />
protocol. Also, guidelines extracted from this section have helped configure simulation of laboratory curing<br />
environments reflective of field conditions.<br />
2.2.1 The Definition of Curing<br />
Curing of cold bituminous materials is a process whereby the mixed and compacted material discharges<br />
water through evaporation, particle charge repulsion or pore-pressure induced flow paths, Jenkins (2000).<br />
Malubila (2005) explored the effects of regional evaporation on material curing. Malubila (2005) also devised<br />
models which can be used to predict material’s equilibrium moisture content given the optimum moisture<br />
content of the material, binder content and Weinert’s N value of the climatic region under investigation.<br />
Findings from various researches emphasize the need to link the definition of curing to environmental effects<br />
and material properties. In this portion of literature, various environmental factors driving curing of bitumen<br />
stabilised materials have been explored. Although material science may explore factors such as particle<br />
charge repulsion or pore-pressure induced flow paths, the response of these mechanisms to the environment<br />
explain why materials cure in the first place.<br />
Moreover, further explorations of scientific mechanisms and environmental effects lead to firm understanding<br />
of why certain materials cure faster than others. The above mentioned aspects have been thoroughly<br />
explored and various researchers contributing to the underlined findings have been acknowledged.<br />
2.2.2 Factors Leading to Curing<br />
Factors leading to curing are specific scientific influences that coerce materials to cure. These are scientific<br />
mechanisms which invariably influence the rate of curing and moisture behaviour within the mix.<br />
Subsequent to the investigation process, the following key factors have been explored:<br />
2.2.2.1. High Pore Water Pressures<br />
Laboratory and field compaction alike of bitumen stabilized materials are generally the cause of development<br />
of high pore water pressures in the compacted mix. In the field, areas with high water tables generally lead<br />
to development of high pore water pressures during compaction. The build up of such high pore water<br />
pressures regions often causes water to migrate to the surface of the recycled layer.<br />
Taking a closer look at laboratory compaction for instance, pore water pressures developed during<br />
compaction cannot fully dissipate because of confinement by steel moulds. The accumulation of pore water<br />
pressures as function of compaction time is common laboratory science, and in some instances of high<br />
moisture contents during compaction, water tends to seep through the bottom of steel mould.<br />
As mentioned before, the interaction of higher pore water pressures in the compacted material leads to<br />
water seeping out through voids in the mix during interactions with the outside environment. The result of<br />
this interaction often forces water to escape due to differences in outside atmospheric pressures and internal<br />
pore water pressures. The migration of water from higher pore water pressures regions in the mix to lower<br />
atmospheric pressure zones towards the surface of the compacted material leads to surface curing.<br />
11
2.2.2.2. Water Expulsion<br />
Water expulsion is the physical release of compaction water from the mix during compaction. Furthermore,<br />
water expulsion is a consequence of high pore water pressures developing in the compacted material due to<br />
high compaction forces or energy.<br />
.<br />
Compaction of bitumen stabilized materials reduces volume of air/voids in the mixture through the<br />
application of external forces. The expulsion of air and consequently compaction water enables the mix to<br />
occupy less volume, thereby increasing the density of the mass. This occurrence is often accomplished by<br />
high energy compactors which provide the necessary external forces.<br />
The expulsion of water through air voids/channels in the compacted mix continues even after compaction<br />
due to migration of high pore water pressures as discussed above. Water expulsion is one of the additional<br />
factors driving curing of bitumen stabilized materials.<br />
2.2.2.3. Evaporation<br />
Evaporation is the process by which molecules in a liquid state spontaneously become gaseous or transform<br />
into water vapour. Consequently, evaporation guides curing of bitumen stabilized materials due to moisture<br />
behaviour in the compacted mix as influenced by pore water pressures and water expulsion characteristics.<br />
In South Africa a climatic index called Weinert N-value can be used to estimate mean annual evaporation of<br />
regions under analysis. Weinert N-value is a climatic index on evaporation which is based on the warmest<br />
month of the year and annual rainfall.<br />
During the initial stages of curing, water evaporates at the exposed surface of compacted mix, leading to<br />
surface interaction with the surrounding environment. Depending on evaporation characteristics of the<br />
surrounding environment, curing of bitumen stabilized materials will take place at faster or slower rates.<br />
Evaporation also contributes to moisture behaviour in compacted pavements over both the short and long<br />
term analysis. Malubila (2005) investigated the effects of environmental evaporation on field equilibrium<br />
moisture contents (EMC) of foam mixes. Malubila (2005) derived models to predict field EMC given the<br />
material’s OMC, binder content and Weinert’s N-value of the region under investigation. Malubila’s findings<br />
supported evaporation as a fundamental factor towards determining residual moisture contents in the field<br />
over the long term.<br />
12
2.3. Factors Influencing Curing<br />
Factors influencing curing are widely material specific and tend to vary depending on external factors such as<br />
binder type and various mixing properties. These factors are usually influenced by the material’s response to<br />
external factors such compaction and topography (gradation).<br />
Aspects driving these factors have been thoroughly explored in the following sections:<br />
2.3.1 Climate and the Environment<br />
Climatic regions can best be described by the well known Weinert’s N value climate index. Curing of bitumen<br />
stabilized materials depends heavily on the environment. South Africa’s climate varies from extremely dry to<br />
subtropical humid with either summer or winter rainfall. These widely different conditions have been<br />
accommodated in the Weinert’s N value climate index.<br />
Weinert’s N value is ratio of evaporation during the warmest month (Ej) to mean annual precipitation (Pa).<br />
The following equation explains this:<br />
N<br />
= 12 E j<br />
P a<br />
The following regions in table 2.3 summarize different climatic regions in South Africa:<br />
Table G.3: South Africa’s Weinert N Value Climate Index<br />
Environment/Climate Wet Moderate Dry<br />
Weinert’s N value N
TG2 Broad Conceptual <strong>Guidelines</strong> for Suitability of Aggregates for Treatment with<br />
Foamed Bitumen<br />
Upper Limit (Unsuitable: Too Fine)<br />
Ideal (Suitable)<br />
Poly. (Ideal (Suitable))<br />
Lower Limit (Unsuitable: Too Coarse)<br />
Poly. (Upper Limit (Unsuitable: Too Fine))<br />
Power (Lower Limit (Unsuitable: Too Coarse))<br />
100%<br />
90%<br />
80%<br />
Zone B: Unsuitable-Too Fine<br />
Zone A: Suitable-Ideal<br />
70%<br />
60%<br />
50%<br />
40%<br />
30%<br />
20%<br />
Cumulative Percentage Passing<br />
10%<br />
Zone C: Unsuitable-Too Coarse<br />
0%<br />
0.10 1.00 10.00 100.00<br />
Particle Size (mm)<br />
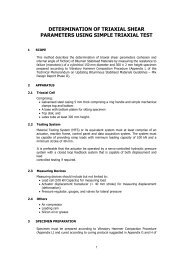
Figure G.1 <strong>Guidelines</strong> for suitability of aggregates for treatment with Foam Bitumen<br />
(Asphalt Academy, 2002)<br />
The grading envelopes presented in Figure 0.1 can be refined by targeting a grading that provides the lowest<br />
Voids in the Mineral Aggregate (VMA). The Cooper grading relationship according to TG2 is ideal for<br />
achieving the most desirable foamed bitumen mixes with lower VMA, as it provides an allowance for variation<br />
in the filler content. The following Cooper relationship illustrates this:<br />
P = (100 – F)(d n – 0.075 n )<br />
(D n – 0.075 n )<br />
Where<br />
d<br />
P<br />
D<br />
F<br />
n<br />
+ F<br />
= selected sieve size (mm)<br />
= percentage by mass passing a sieve of size d mm<br />
= maximum aggregate size (mm)<br />
= percentage filler content (inert and active)<br />
= variable dependent on aggregate packing characteristics<br />
The Cooper relationship provides flexibility with the filler content and under normal practice, a value of n =<br />
0.45 is utilized to achieve the minimum VMA. Given the n-value, the required percentage of particles passing<br />
(P) on a selected sieve size (d) can be determined, provided both percentage filler content (F) and maximum<br />
aggregate size (D) is known.<br />
14
According to TG2, minimization of the VMA is particularly important for the fraction of mineral aggregate<br />
smaller than 2.36 mm, as bitumen droplets disperse within these fractions. Consequently, finer aggregates<br />
smaller than 2.36 mm carry the most binder in foamed bitumen mixes.<br />
In terms of grading influences on curing of bitumen stabilized materials, maintaining lowest Voids in the<br />
Mineral Aggregate (VMA) would be ideal for simulation of field conditions. By applying findings in Figure 0.1,<br />
a minimum requirement of 5% of filler content (fines passing through 0.075 mm sieves) is necessary for<br />
production of good foam mixes.<br />
Furthermore, although the grading envelope in Figure 0.1 applies more significantly to foamed treated mixes,<br />
emulsion treated mixes work equally well under the TG2 grading envelope guideline, with the exception of<br />
filler content (fines passing through 0.075 mm sieves) not being the main role players in carrying bitumen<br />
emulsion within the mix. In the case of bitumen emulsion, although obtaining field grading with significant<br />
filler content in the laboratory would be representative, coating of larger particles with bitumen emulsion<br />
during mixing is more apparent than in the case of foam stabilized mixes.<br />
2.3.3 Compaction Energy and Voids in the Compacted Material<br />
Air void distribution within the mix is a function of many factors such as mix composition, compaction method<br />
and aggregate properties. The relative compaction method/energy appropriate to yield the desirable field<br />
properties is equally important. Moreover, the influence of compaction energy and the resulting air void<br />
content in bitumen stabilized materials is of utmost importance to curing behaviour in the mix.<br />
Compaction has a direct influence on aggregate orientation and final structure as reflected in the volumetric<br />
properties of the mixture. Typically, field compaction of RAP material yields 12% to 15% air void content.<br />
This is generally achieved by high energy steel drum rollers, often with high energy oscillations or vibrations.<br />
As a result, voids percentage in the mix is a function of compaction energy which in turn is linked to applied<br />
method.<br />
In the endeavour to replicate field compaction in the laboratory, understanding of field compaction is<br />
imperative. Typically, the largest steel drum vibratory roller compactor currently in use weighs close to 18-20<br />
tones, with an axial length of about 2 m. Assuming a contact length of 100 mm in the roller direction, a<br />
typical drum applies contact stress of about 400 kPa in static conditions and higher stresses with vibrations.<br />
Research shows that a vibratory roller compactor typically applies 100 KPa in the first static breakdown pass<br />
to well over 1000 KPa as contact volume is reduced in the recycled layer.<br />
In terms of dynamics of application, compaction by the roller compactor usually occurs at 10 meters behind<br />
the recycler at speeds of 4 km/h (1.1 m/s). The 100 mm contact by steel roller drums is typically in contact<br />
with surface area of the recycled layer for about 0.2 seconds in each pass. In the field, the steel compactor<br />
typically vibrates at about 20 Hz with 8 passes yielding a total time of 1.6 seconds per contact area. Initial<br />
passes during compaction are normally carried out with a high amplitude/low frequency setting while final<br />
compaction is achieved by carrying out further passes with a high frequency/low amplitude setting. This<br />
process typically yields 96% to 100% Modified AASHTO compaction.<br />
In terms of voids in the mix, Shuler et al (1992) compared vibratory compaction of asphalt mixes with<br />
Marshall, Kneading, and Gyratory compaction procedures to determine differences between each method<br />
with respect to density and voids characteristics. The results are published in Figure 0.2 below:<br />
15
0 5 10 15 20 25 30 35<br />
Comparison of Vibratory and Conventional Compators<br />
14%<br />
Marshall Hammer<br />
50Hz Electromagnetic Testing Machine<br />
Texas Gyratory Compactor modified for 1deg & 6 Rev/min<br />
50Hz Vibratory Demolition Hammer<br />
Hveem Kneading Compactor<br />
12%<br />
10%<br />
Air Voids (%)<br />
8%<br />
6%<br />
4%<br />
2%<br />
0%<br />
35 50 75<br />
100 150 150<br />
No of Blows<br />
Mould Diameter (mm)<br />
small large (100 mm) 100 150 150 mm Dia<br />
Foot base<br />
Mould Diameter 200 Rev/Gyr<br />
Figure G.2 Comparison of Vibratory and Conventional Compactors (Shuler et al, 1992)<br />
Findings in Figure 0.2 suggest vibratory compaction as consistent compaction method for asphalt concrete.<br />
Although Shuler focused on hot mix asphalt, recent research has confirmed the use of vibratory compaction<br />
as most suitable compaction procedure for bitumen stabilized materials.<br />
Recent published have also focused on influences of compaction methods on mechanical properties. Hunter<br />
et al, (2004) published a paper on influences of compaction methods on asphalt mixture internal structure<br />
and mechanical properties. Both gyratory, vibratory and slab-roller compaction methods were studied.<br />
Findings by Hunter et al, gave different results compared to Shuler at al. On the contrary, Hunter found out<br />
laboratory tests revealed slab–roller compacted specimens to have the least variance, followed closely by<br />
gyratory compacted specimens. Laboratory results revealed that vibratory samples were too difficult to<br />
compare due to differences in the mean air voids content. Table 0.4 illustrates this.<br />
16
Table G.4: Number of samples required for a range of accuracies and confidence<br />
intervals<br />
Mean<br />
Number of Samples Required<br />
Stiffness 80% Confidence Level 80% Confidence Level<br />
Compaction Mean<br />
Air Voids<br />
±10%<br />
±5%<br />
±10%<br />
Method (%) (MPa) Accuracy Accuracy Accuracy<br />
Gyratory 3.05 7906 4 6 6 12<br />
Vibratory 6.03 6762 4 9 7 19<br />
Slab-Roller 2.99 7321 3 6 6 12<br />
±5%<br />
Accuracy<br />
Although findings in this portion of research has focused primarily on hot mix asphalt as a result of lack of<br />
appropriate research regarding compaction of bitumen stabilized materials, most researchers agree that<br />
vibratory laboratory compaction of cold mixes best simulates field compaction by high energy rollers. Both<br />
methods use high compaction energy per loading area, loading time and frequency vibrations. Moreover,<br />
particle distributions and material settling during compaction by both techniques resemble similar behaviour.<br />
In conclusion, applying vibratory compaction as appropriate laboratory technique will best simulate field<br />
conditions with reasonable air voids content in the mixes and will furthermore give impeccable meaning to<br />
laboratory curing.<br />
2.4. Influence of Lime and Cement on Bitumen <strong>Stabilized</strong> <strong>Materials</strong><br />
In South Africa, the two most commonly used active fillers in foam and emulsion treated materials is cement<br />
and lime. Cement and lime are known for their promotion of reaction during mixing accompanied by<br />
chemical change within a short space of time. Both cement and lime are generally used for different<br />
purposes in the construction industry and their application can vary significantly.<br />
2.4.1 UCS and ITS Strength Tests<br />
A number of attempts have been made around the world in the endeavour to classify bitumen stabilized<br />
materials using the Unconfined Compressive Strength (UCS) and Indirect Tensile Strength (ITS) tests<br />
according to TG2 guideline for foamed stabilised materials. In this section, the work of Matthew Houston,<br />
Fenella Long and Bondietti is acknowledged.<br />
In the attempt to investigate classification of bitumen stabilized materials according to TG2, the following<br />
three critical regions and materials around the world were explored:<br />
MR439<br />
• Calcareous sand<br />
• Dorbank (Red calcarenite, duricrust)<br />
• -13.3mm crusher dust<br />
17
Zambia<br />
• Weathered basalt<br />
• Reclaimed cement stabilised Kalahari sands (red and silty)<br />
• Kalahari silty sand<br />
Greece<br />
• RAP<br />
• Graded crushed limestone<br />
• Reclaimed cement stabilised graded crushed limestone<br />
•<br />
• Investigations were done on 100x100mm and 150x150mm diameter briquettes. In addition, both<br />
cement and lime active fillers were used as part of the test matrix. The following foam and cement/lime<br />
ranges were applicable:<br />
• Foam : 2 - 4.5%<br />
• Cement : 1 - 1.5%<br />
• Lime : 1 - 2.0%<br />
In terms of mixing ratio compositions, cement to foam ratios were kept at less that 0.75 whilst lime to foam<br />
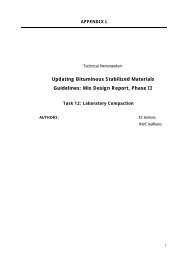
ratios were maintained at less than 0.66. Both UCS and ITS results are presented below in Figure 0.3.<br />
Figure G.3 Correlations between different ITS and UCS test protocols on foamed BSM<br />
(Houston et al.)<br />
The results presented in Figure 0.3 highlight the linear relationship between UCS and ITS tests of foamed<br />
bitumen stabilised materials. The close linear relationship between UCS and ITS tests have posed the<br />
question whether the tests are appropriate to determine flexibility of bitumen stabilised materials (Houston et<br />
al. and Bondietti et al.). It was found by both researchers that a linear relation with good level of confidence<br />
exists between the ITS and UCS tests over a range of bitumen and cement content ratios.<br />
18
In view of the findings highlighted by both Houston and Bondietti, the following conclusions followed from<br />
the investigation study on classification of foamed bitumen stabilised materials:<br />
• An ITS or UCS test alone on 150mm briquettes at equilibrium moisture content is a good indicator of the<br />
materials class and determination of optimum binder content. However, performing a second UCS or ITS<br />
test will not lead to more accurate classification of foamed bitumen treated materials (Houston et al.).<br />
Similar findings are reported by Bondietti et al. for emulsion treated materials.<br />
• Both Houston and Bondietti concluded that it is not necessary to perform both ITS and UCS tests for<br />
design purposes.<br />
• Houston et al. further concluded that with the current TG2 classification system an FB3 material will<br />
seldom be determined and that if a material falls into this category it is more likely to be the result of<br />
incorrect test results than the actual material parameters.<br />
Findings in this section have mainly highlighted the use of UCS and ITS tests as being inappropriate to<br />
providing reliable and accurate measure of flexibility of materials treated with different lime and cement foam<br />
ratios.<br />
The inability of UCS and ITS tests to capture flexibility emphasise the need for a more fundamental<br />
mechanical test that provides reasonable measure of sensitivity to flexibility of bitumen stabilised materials.<br />
Houston and Bondietti have mainly highlighted the inadequacies of TG2 classification system. The later has<br />
posed a challenge to rethink and research new classification parameters for bitumen stabilized materials.<br />
2.4.2 Resilient Modulus Strength Tests<br />
In view of the limitations of UCS and ITS tests, dynamic testing has been found to differentiate better<br />
between levels of performance of cold mix materials. This further emphasizes that Resilient Modulus be<br />
selected as the key parameter by which representative cured materials be measured.<br />
The effects of curing on stiffness performance are dynamic. Loizos et al. investigated the effects of curing on<br />
newly constructed foam stabilised semi rigid pavement in Athens. The monitoring process involved in-situ<br />
stiffness analysis over a five year period. Performance monitoring of the CIPR foam stabilised pavement was<br />
achieved by using the following Non Destructive Tests (NDT):<br />
• Falling Weight Deflectometer (FWD)<br />
• Ground Penetrating Radar (GPR)<br />
• Laser Profile (LP)<br />
• Laboratory Tests (Coring of samples)<br />
19
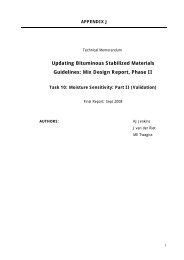
A schematic view of the existing and newly recycled pavements is presented in Figure 0.4.<br />
80 – 100 mm Asphalt layer<br />
90mm Asphalt base Surface<br />
Coarse<br />
220 CBM layer<br />
250 CIPR layer<br />
Foam Stabilised Base<br />
180 mm CBM layer<br />
(Granular)<br />
Crushed Stone<br />
Drainage Layer<br />
Subgrade<br />
Existing Semi Rigid<br />
Pavement<br />
Remaining CBM layer<br />
(Granular)<br />
Crushed Stone<br />
Drainage Layer<br />
Subgrade<br />
CIPR Foamed Semi<br />
Rigid Pavement<br />
Figure G.4 Existing and recycled pavement structures, Athens (A. Loizos et al., 2007)<br />
The recycled semi rigid foam stabilised pavement is a combination of the old CBM layer and RAP materials.<br />
Monitoring of the CIPR layer over time showed an increase in stiffness as a result of curing. Figure 0.5<br />
demonstrates the highlighted findings.<br />
Figure G.5 In-Situ foam mix Resilient Modulus using FWD analysis, Athens (A. Loizos et<br />
al., 2007)<br />
20
The observed increase in stiffness of foam stabilised pavement demonstrates the powerful effects of field<br />
curing. Moreover, stiffness of the foam treated base seems to stabilize after 6 months to 1 year period,<br />
although gradual growth is still apparent even after 4 years. This further emphasizes the dynamic effects of<br />
long term curing in the field. Consequently, since curing has such a dynamic effect on field stiffness,<br />
monitoring of stiffness as key parameter to validate laboratory curing protocol is imperative.<br />
Furthermore, Loizos et al. made the following conclusions following the foam CIPR project in Athens:<br />
• There is an improvement to the overall pavement structural stiffness over time<br />
• Stabilization of structural stiffness after 6 months of heavy traffic is apparent<br />
• Recycled foam stabilised material in the semi-rigid pavement is more stiff in relation with the flexible<br />
pavement<br />
• The back calculated foam moduli were higher than the relative ones obtained from ITSM tests in<br />
cores<br />
• Monitoring after 6 months of traffic and onwards shows that the average back calculated foam<br />
modulus values were higher than the related set for pavement design<br />
Loizos has established resilient modulus as a dynamic parameter to capture the curing effects of bitumen<br />
stabilised materials. This further supports shared views by various research institutions, as it is currently<br />
known that dynamic tests are more sensitive to changes in mix properties than monotonic tests.<br />
It is further concluded that the research methodology adopted in this thesis should accept resilient modulus<br />
as a key parameter in the validation of accelerated curing protocol.<br />
21
3. METHODOLOGY<br />
This chapter addresses how the investigation process was carried out and scientific findings which qualify the<br />
adopted methodology have been thoroughly discussed.<br />
Methodology as guided by the outlined phases in chapter 1 followed comprehensive field and laboratory<br />
investigations. The investigation process primarily focused on factors which impact on material curing,<br />
mechanisms of field and laboratory stiffness performance linked to curing behaviour and the adopted<br />
decision criteria for curing validation.<br />
Moreover, the implemented mix design techniques and testing protocols have been validated by the<br />
supportive literature review as presented in chapter 2 of the thesis.<br />
3.1. Methodology Overview and Solution Flowchart<br />
Experimentation of curing and validation thereof involved the three discussed phases, namely, Preliminary<br />
Investigation & Project Scope formulation, Laboratory Experimentation & Improvement and Field Monitoring<br />
& Validation.<br />
Although the preliminary phase focussed on definition of project scope as validated by published work, both<br />
laboratory experimentation and field monitoring were done simultaneously, with an emphasis on<br />
investigating boundaries of application for both foamed and emulsion mixes.<br />
The main challenge towards formulation/improvement of accelerated curing laboratory protocol was the<br />
aspect of reconciling published work with field performance of selected CIPR project. This was further<br />
challenged by laboratory experimentation which had to combine both field performance and published work<br />
into a single entity that gave meaning to the proposed final accelerated curing laboratory protocol.<br />
A solution system in a form of flowchart was proposed to help guide the investigation process and to also<br />
bring clarity to aspects that needed investigation and incorporation into the final solution. Furthermore, the<br />
proposed solution flowcharts served as improvement benchmark to validate the proposed solution against<br />
published work and the corresponding field performance of the CIPR project.<br />
The following flowchart in Figure 0.6 describes how the investigation process was conducted and monitored,<br />
whilst emphasis was given to the reconciliation of field and laboratory moisture stiffness trends:<br />
22
PRELIMINARY PHASE<br />
Formulation and Validation of Project Scope & Testing Criteria<br />
as supported by:<br />
• Published Literature<br />
• Laboratory Experimentation/Results<br />
Interpretation and formulation of the way forward<br />
FIELD MONITORING & VALIDATION<br />
Identification and Selection of Cold In Place Recycling Project<br />
and field monitoring of:<br />
• Temperature and Relative Humidity distribution in the<br />
CIPR layer<br />
• Moisture & Stiffness Trends<br />
LABORATORY INVESTIGATION & CURING<br />
IMPROVEMENT<br />
Laboratory investigation of foamed and emulsion treated mixes<br />
behaviour relative to:<br />
• Variable Curing Temperatures and Humidity Conditions<br />
• Moisture trends & the relative impact on Stiffness<br />
Performance with active filler as an additional variable<br />
RECONCILIATION OF FIELD & LABORATORY TRENDS<br />
Comparison of Field and Laboratory Trends with the aim to accurately<br />
interpret results and give meaningful insight in terms of reconciliation of:<br />
• Moisture trends and the relative impact on Stiffness Performance<br />
• Curing temperatures and influences of active filler types on both<br />
Emulsion and Foam <strong>Mix</strong>es<br />
FINAL INVESTIGATION & ACCELERATED LABORATORY<br />
CURING PROTOCOL PROPOSAL<br />
Investigation into boundaries of application for foam and emulsion mixes in<br />
terms of:<br />
• Moisture behaviour relative to time of exposure to Curing Temperature<br />
• Stiffness Performance relative to active filler types and moisture trends<br />
Testing of Outcomes<br />
Validation with<br />
Field Trends<br />
VALIDATION OF FINAL ACCELERATED LABORATORY<br />
CURING PROTOCOL<br />
Conclusion of Laboratory experimentation and validation of proposed<br />
curing protocol by effectively performing the following:<br />
• System’s check/validation with Field Results<br />
• Cohesion and Friction Angle properties of cured specimens<br />
• Conclusions and Recommendations<br />
Figure G.6 Methodology Overview and Solution Flowchart<br />
23
3.2. Preliminary Curing Experimentation<br />
Preliminary laboratory tests focused on curing experimentation with the aim to correlate published literature<br />
to the derived project scope/deliverables.<br />
Following findings by Keckwick (2004), it was necessary to investigate the effects of long term ambient<br />
curing on material performance. Moreover, the influence of long term curing over tangent modulus<br />
performance was thoroughly investigated.<br />
Different materials have also been investigated to try and understand whether a single curing protocol would<br />
apply to all material types. Moreover, both foamed and emulsion binder types were used, with active filler as<br />
an additional variable.<br />
Findings from preliminary phase have helped define project scope and conditions for curing experimentation.<br />
Also, the need for dynamic fundamental test for evaluation of material properties has been addressed.<br />
3.2.1 Proposed Tests Matrix<br />
In order to address accelerated laboratory curing protocol, it was necessary to investigate all material types<br />
associated with cold mix technology. In terms of investigated materials, crushed rock, sands and gravels<br />
were explored with an emphasis on curing rates, the time it takes for each material to reach EMC and<br />
tangent modulus performance of these materials.<br />
The following table summarizes preliminary laboratory test matrix:<br />
Table G.5: Proposed preliminary laboratory test matrix<br />
Binder Content Active Filler: CEM (%) Specimen Size Number<br />
Material Type Foam Emulsion (%) 1 0 150x100 150x250 Sample<br />
Graded Crushed Rock X X 1.8 X X X X 8 x Day 1, 7, 2<br />
Ferricrete Gravel X X 1.8 X X X X 8 x Day 1, 7, 2<br />
Sand X X 1.8 X X X X 8 x Day 1, 7, 2<br />
Total 96<br />
As observed from Table 0.5, both foamed and emulsion binder types were used and cement was also used<br />
as active filler. Both 150x100 and 150x250 mm sample sizes were manufactured in order to measure the<br />
effects of sample size on material curing.<br />
Furthermore, the use of different material types served as benchmark to validate whether a single curing<br />
protocol would be representative for all material types and whether or not each material type would require<br />
specific curing protocol. Although one of the main objectives of this study was to unify the accelerated<br />
curing protocol, it was also necessary to qualify this approach by real laboratory results. Furthermore, it was<br />
anticipated that the CIPR project would assume a gross emulsion content in the vicinity of 3%. For this<br />
reason, binder content of 1.8% seemed reasonable during the preliminary testing phase.<br />
24
3.2.2 Implemented <strong>Materials</strong> Properties<br />
Material properties were analyzed using standard modified ASHTO compaction. From the results in Table<br />
0.6, Ferricrete gravel showed the highest material OMC value, while Crushed Rock showed the highest MDD.<br />
Overall, all materials reached compaction during mixing and in the case of emulsion mixes, an extra 1% of<br />
moisture was included to aid with breaking of emulsion and to also help reach compaction, especially in the<br />
case of Crushed Rock due to its lower OMC value.<br />
Table G.6: Preliminary laboratory material properties<br />
Material Type<br />
Classification<br />
MDD<br />
(kg/m3) OMC (%)<br />
Graded Crushed<br />
Rock G2 to G3 2398 5.71<br />
Ferricrete Gravel G4 2179 9.88<br />
Sand G5 2067 6.4<br />
Grading envelopes shown in Figure 3.2 qualify all materials for acceptable foamed mixes according to TG2.<br />
Although Crushed Rock lacked fines, laboratory mixes proved to be acceptable. The sand material also<br />
provided a BSM of normal quality for foamed mixes. Ferricrete Gravel gave the best foamed mix properties<br />
as witnessed by coating of all fines in the pugmill mixer.<br />
Preliminary Laboratory Tests: Material Grading Properties<br />
Crushed Rock Gravel Sand<br />
100%<br />
90%<br />
80%<br />
70%<br />
60%<br />
50%<br />
40%<br />
30%<br />
20%<br />
10%<br />
0%<br />
0.01 0.10 1.00 10.00 100.00<br />
Particle Size (mm)<br />
Percentage Passing<br />
Figure G.7 Preliminary tests material grading curves<br />
25
3.2.3 Long Term Curing Conditions<br />
Curing conditions were mainly dictated by availability of climate chamber rooms at Stellenbosch University.<br />
Samples were cured for approximately 12 months, with an overlap into the 13th month. Also, the following<br />
curing conditions were used:<br />
Table Error! No text of specified style in document..7: Preliminary tests long term curing<br />
conditions<br />
<strong>Materials</strong><br />
Temperature<br />
( ◦ C)<br />
Relative Humidity<br />
(%)<br />
Duration<br />
(Months)<br />
General<br />
Conditions<br />
Crushed Rock, Gravel and Sand 23 ± 1 60 ±5 12 Unsealed<br />
Implemented climate chamber showed an average temperature fluctuation of 1ºC while relative humidity<br />
meter fluctuated with 5%. This resulted in temperature tolerances of 22ºC - 24ºC and relative humidity<br />
readings of 55% - 65%.<br />
Figure 0.8 illustrates the different specimen sizes and nature of the curing environment. Samples were<br />
exposed to ambient conditions and careful attention was given to proper handling of the specimens during<br />
weighing of mass for moisture analysis. Plates were used to mount samples to avoid small particles being<br />
lost during the handling process.<br />
Figure Error! No text of specified style in document..8 Preliminary tests long term curing of<br />
crushed rock, ferricrete gravel & sand samples<br />
The use of relative humidity conditions in addition to temperature curing has been widely used by various<br />
researchers as published in literature review of Chapter 2. Such an approach makes sense as site conditions<br />
have both temperature and relative humidity distributions within the CIPR layer.<br />
In the preliminary phase of this research, it became apparent to investigate the effects of such curing<br />
conditions over material performance. Moreover, longer curing durations were used to simulate field curing<br />
subject to similar environments whilst EMC of each material type was closely monitored.<br />
3.2.4 Proposed Testing Protocol<br />
In the literature review in Chapter 2, Keckwick (2004) suggested that material stiffness as interpreted by the<br />
tangent modulus from a stress strain response measured in a modified CBR-type compression test be<br />
considered for evaluation of the curing technique.<br />
Figure 0.9 shown below illustrates the differentiation between tangent and secant modulus, as derived from<br />
stress and strain response graph for monotonic triaxial testing.<br />
26
σ a<br />
σ max<br />
E tan<br />
E sec<br />
ε f<br />
ε<br />
Figure G.9 Monotonic Etan and Esec modulus analysis (Ebels, 2007)<br />
The following conditions in Table 0.8 were used to conduct the monotonic tests:<br />
Table Error! No text of specified style in document..8: Preliminary monotonic triaxial test<br />
conditions<br />
Specimen Dimension<br />
(mm)<br />
<strong>Materials</strong> Height Diameter<br />
Compaction<br />
Method<br />
Monotonic<br />
Strain Confinement<br />
Rate (min -1 ) Pressure (KPa)<br />
Crushed Rock, Gravel and Sand 250 150 Mod Proctor 2.10% 100<br />
For simplicity reasons, it was decided to conduct all tests at confinement pressures of 100 kPa. Also, only<br />
specimen sizes of 250x150 mm were used as per limitations by Stellenbosch University’s MTS (Material<br />
Testing System) protocol. Also, limitations for testing 150x100 mm specimens were further implicated by the<br />
load cell dimensions.<br />
The 2.1 % strain rate follows a test protocol adopted by Stellenbosch University. Normally, lower strain rates<br />
have been adopted for triaxial testing of soil specimens, whilst higher strain rates as in the case of<br />
Stellenbosch University have been applied to more stiff bound materials.<br />
27
Figure 0.10 below displays the MTS (Material Testing System) unit which was used to carry out the testing<br />
protocol.<br />
Figure G.10 Preliminary tests MTS testing protocol<br />
Monotonic testing entails a destructive test which loads the briquettes until failure is reached. From this<br />
process, a stress strain response graph can be plotted, yielding tangent modulus and strain at failure.<br />
Figure 0.11 depicts monotonic crushing of specimen under MTS loading. Since the load is known and<br />
displacement in the vertical direction is recorded during material deformation, strain can be estimated by<br />
monitoring the change in specimen’s height.<br />
Figure G.11 Applied load versus vertical strain during preliminary testing using MTS<br />
testing protocol<br />
Stress can be calculated from the loading force over specimen’s area (150 mm diameter). By calculating<br />
stress and strain, the following stress strain response graph can be plotted. Furthermore, by evaluating the<br />
tangent modulus over the linear elastic region of the graph, both tangent and secant modulus can be<br />
estimated. Figure 0.12 illustrates this process.<br />
Figure G.12 Applied stress versus vertical strain during preliminary testing using MTS<br />
testing protocol<br />
Monotonic testing of materials was evaluated for day 1, day 7 and day 28 durations. The 1 year samples<br />
were only used for moisture analysis and dynamic loading resilient tests. This meant that a number of 24<br />
specimens x 4 analysis periods had to be made. Although repeatability may be questioned as briquettes<br />
were crushed per testing, this exercise was aimed at reaching course conclusion regarding general trends<br />
which evolved from tangent modulus performance relative to laboratory curing.<br />
3.2.5 Results and Findings<br />
Results from the preliminary phase have confirmed trends observed by various researchers and provided<br />
absolute values. The investigation process initially focused on moisture behaviour of 150x100 and 150x250<br />
mm specimens for all material types. Emphasis was given to emulsion binder mixes, due to high fluid<br />
contents at compaction as opposed to foam mixes. During formulation of project scope, it became apparent<br />
to focus on specimens with high initial fluid contents to study the effects of long term curing on moisture<br />
behaviour. Also, emulsion mixes with cement as active filler were considered to assist in investigating the<br />
effects of long term tangent modulus performance over 12 months.<br />
Once aspects of sample size impact on material curing were concluded for all material types, further<br />
investigation focused on material moisture behaviour and Etan modulus performance relative to long term<br />
curing. Only specimen sizes of 150x250 mm were considered due to limitations by Stellenbosch University’s<br />
28
MTS testing protocol. Both emulsion and foam binder types were implemented for all material types with<br />
active filler as an additional variable. Furthermore, trends evolving from the preliminary phase helped<br />
confirm test criteria and curing valuation for the revised accelerated laboratory curing protocol.<br />
3.2.5.1. Moisture Behaviour of 150x100 and 150x250 mm Emulsion Specimens<br />
In terms of moisture behaviour of 150x100 and 150x250 mm specimen sizes, Figure 0.13 below depicts<br />
moisture trends of emulsion mixes with cement as active filler over 12 months. The dashed lines represent<br />
150x100 mm specimens whilst the solid lines represent the 150x250 specimens. The blue lines represent<br />
sand material, while the green lines represent graded crushed rock with the red lines representing ferricrete<br />
gravel. All material and the different sizes were treated with 1% cement.<br />
% OMC versus Number of Days: 150x250 mm versus 150x100 mm Emulsion <strong>Mix</strong>es<br />
Crushed Rock: 150x250-Cem<br />
Sand: 150x250-Cem<br />
Gravel:150x100-Cem<br />
Power (Crushed Rock: 150x250-Cem)<br />
Power (Sand: 150x250-Cem)<br />
Power (Sand: 150x100-Cem)<br />
Gravel: 150x250-Cem<br />
Crushed Rock:150x100-Cem<br />
Sand: 150x100-Cem<br />
Power (Gravel: 150x250-Cem)<br />
Power (Gravel:150x100-Cem)<br />
Power (Crushed Rock:150x100-Cem)<br />
100%<br />
90%<br />
80%<br />
% OMC<br />
70%<br />
60%<br />
50%<br />
40%<br />
30%<br />
20%<br />
0 50 100 150 200 250 300 350 400<br />
Number of Curing Days<br />
Figure G.13 Moisture behaviour of 150x100 & 150x250 mm emulsion cement treated<br />
specimens<br />
Generally, the gravel material seems to lose moisture at a more accelerated rate than crushed rock and sand<br />
materials. Also, all materials seem to approach EMC after approximately 10 to 12 months. This trends<br />
correlates to 3 to 5 years of field behaviour. Moreover, specimen sizes seem to have little effect on curing<br />
rates for all material types. This implies that either 150x100 or 150x250 mm specimens may be used for<br />
moisture analysis. The most important observation is that under the same curing conditions, all materials<br />
29
seem to approach 30-40% OMC of EMC range. This could mean that a single curing protocol may be<br />
appropriate for all material types, given that 10% EMC fluctuations between all material types is considered<br />
acceptable.<br />
3.2.5.2. Moisture Behaviour of 150x250 mm Emulsion and Foam Specimens<br />
For simplicity reasons, it was decided to plot both foam and emulsion moisture trends separately due to the<br />
unlikely event of capturing similar moisture trends for both foam and emulsion mixes for a given material<br />
type. Moreover, both cement treated and non cement treated materials trends were compared. Emphasis<br />
was devoted to typical final %OMC values of the same material type treated with both foam and emulsion<br />
binder types.<br />
Foam Binder Moisture Trends<br />
All foam treated materials were compacted at 80% OMC with the vibratory Kango Hammer ® compaction<br />
technique. Moisture was monitored for 31 days by observing the change in specimen’s weight over the<br />
analysis period. The dashed trend lines in Figure 0.14 represent specimens with no active filler whilst solid<br />
trend lines represent specimens treated with cement as active filler.<br />
The pink lines represent Ferricrete gravel and the blue lines represent crushed rock whilst the green lines<br />
represent sand materials in Figure 0.14 shown below.<br />
% OMC versus Number of Days: Foam <strong>Mix</strong>es<br />
% OMC<br />
Crushed Rock: Cem Gravel: Cem Sand: Cem<br />
Crushed Rock Gravel Sand<br />
Power (Crushed Rock: Cem) Power (Gravel: Cem) Power (Sand: Cem)<br />
Power (Gravel) Power (Sand) Power (Crushed Rock)<br />
80%<br />
70%<br />
60%<br />
50%<br />
40%<br />
30%<br />
20%<br />
10%<br />
0%<br />
0 5 10 15 20 25 30 35<br />
Number of Curing Days<br />
Figure G.14 Moisture behaviour of 150x250 mm foam treated specimens<br />
30
It appears that for all materials treated with foam binder, specimens treated with cement as active filler<br />
(solid lines) retain more moisture over time. BSM-foam mixes generally release water at a much accelerated<br />
rate than emulsion mixes, as curing of foam mixes is simply a process of water repulsion. Most researchers<br />
have found foamed mixes to be highly hydrophobic at the initial stages of curing. This leads to foam mixes<br />
losing moisture at a rapid rate during initial stages of curing than emulsion mixes.<br />
The inclusion of cement in foam mixes seems to lock in moisture over time whilst specimens without cement<br />
seem to loose moisture at a much rapid rate. Moreover, the difference in curing rates between cement<br />
treated and non cement treated specimens is not negligible, with an average of 5% difference on the final<br />
%OMC values with the exception of 10% difference in the case of gravel materials.<br />
Cement treated specimens appear to yield 20-30% OMC after 31 days whilst non cement treated specimens<br />
seem to yield 10-25% OMC. Consequently, in the case of foam mixes the revised curing protocol may have<br />
to cater for cement treated and non cement treated specimens.<br />
Emulsion Binder Moisture Trends<br />
All emulsion mixes were compacted with 1% additional moisture to the material’s OMC value in order to aid<br />
with compaction and breaking of emulsion. As a result, compaction moisture varied between 80 to 95%<br />
OMC, with the exclusion of emulsion binder lubrication. Also, compaction was achieved with vibratory Kango<br />
Hammer ® compaction.<br />
As in the case of foam mixes, the solid trend lines represent cement treated specimens whilst the dashed<br />
trend lines represent specimens with no active filler content. Figure 0.15 shown below illustrates moisture<br />
trends of emulsion mixes over 12 months:<br />
31
% OMC versus Number of Days: Emulsion <strong>Mix</strong>es<br />
Crushed Rock: Cem Gravel: Cem Sand: Cem<br />
Crushed Rock Gravel Sand<br />
Power (Crushed Rock: Cem) Power (Gravel: Cem) Power (Sand: Cem)<br />
Power (Gravel) Power (Sand) Power (Crushed Rock)<br />
100%<br />
90%<br />
80%<br />
% OMC<br />
70%<br />
60%<br />
50%<br />
40%<br />
30%<br />
20%<br />
0 50 100 150 200 250 300 350 400<br />
Number of Curing Days<br />
Figure G.15 Moisture behaviour of 150x250 mm emulsion treated specimens<br />
Emulsion mixes are less hydrophobic during the initial stages of curing. Figure 0.15 confirms this<br />
phenomenon as moisture is lost at a much less rapid rate than foam mixes.<br />
BSM-emulsion mixes are unique in a sense that there seems to be no large differences between cement<br />
treated and non cement treated specimens. The biggest exception occurs with crushed rock, with cement<br />
treated specimens losing moisture more rapidly than non cement treated specimens. The recorded<br />
difference is almost 20% of final %OMC value. The noticeable difference supports research as cement<br />
treated emulsion mixes are expected to cure at a faster curing rate than non cement treated mixes.<br />
Generally, cement treated specimens appear to stabilize at 30-40% OMC after 12 months for the given<br />
conditions (65% relative humidity and 23 ºC) whilst non cement treated specimens seem to yield 30-50%<br />
OMC. The inclusion of cement seems to assist with the breaking of emulsion at the initial phase, a factor<br />
which accelerates curing whilst the non cement treated specimens seem to break the emulsion at a much<br />
slower rate. However, this observed trend seems extreme and applies only to graded crushed rock material.<br />
Furthermore, there seems to be close correlation of trends between cement treated and non cement treated<br />
specimens for both gravels and sands.<br />
Without going into details as to why certain material respond differently to curing conditions, it may be<br />
necessary to reserve certain amount of tolerances when revising the curing protocol.<br />
Cleary, the observed trends are material specific especially when factors such as compaction and voids in the<br />
mix are negligible. Both gravels and sands seem to have similar trends, whilst crushed rock is different in all<br />
aspects. The inconsistencies in the observed trends pose a serious challenge in revising the curing protocol.<br />
32
It may be that a revised rough curing protocol may be envisaged, with an emphasis on acceptable<br />
tolerances.<br />
3.2.5.3. Emulsion and Foam <strong>Mix</strong>es Tangent Modulus Performance<br />
Tangent modulus performance for all material and binder types was evaluated for 28 days of curing<br />
conditions. All tested materials were crushed under the MTS machine and crushed samples were used for<br />
moisture analysis. A summary of results have been summarized in Table 0.9 shown below:<br />
Table G.9: Summary of tangent modulus performance for both BSM-foam and emulsion<br />
mixes<br />
Binder Binder Specimen Active Filler<br />
Etan Modulus Performance Over<br />
time (MPa)<br />
Material Type Type Content (%) Size (mm) Cement (%) 1 Day 7 Days 28 Days<br />
Graded Crushed Rock Foam 1.8 150x250 1 198 245 332<br />
Ferrecrete Gravel Foam 1.8 150x250 1 200 257 299<br />
Sand Foam 1.8 150x250 1 183 240 285<br />
Graded Crushed Rock Foam 1.8 150x250 0 130 210 270<br />
Ferrecrete Gravel Foam 1.8 150x250 0 137 170 250<br />
Sand Foam 1.8 150x250 0 150 197 264<br />
Graded Crushed Rock Emulsion 1.8 150x250 1 206 225 292<br />
Ferrecrete Gravel Emulsion 1.8 150x250 1 167 201 255<br />
Sand Emulsion 1.8 150x250 1 153 179 210<br />
Graded Crushed Rock Emulsion 1.8 150x250 0 94 180 230<br />
Ferrecrete Gravel Emulsion 1.8 150x250 0 130 156 189<br />
Sand Emulsion 1.8 150x250 0 117 153 189<br />
Graphs representing tangent modulus performance over curing period for both emulsion and foamed mixes<br />
have been plotted separately. Trend lines have been plotted to differentiate material performance relative to<br />
curing period and ultimately moisture trends. It is further stressed that results merely represent general<br />
trends to help define project scope and curing evaluation criteria.<br />
Foam Binder Tangent Modulus Trends<br />
The solid lines presented in Figure 0.16 represent cement treated materials whilst dashed lines represent non<br />
cement treated materials. The blue lines represent crushed rock material and the pink lines represent<br />
Ferricrete gravel whilst the green lines represent the sand material.<br />
33
Preliminary Monotonic Tests: Foam <strong>Mix</strong>es<br />
Crushed Rock: Cem Gravel: Cem Sand: Cem<br />
Crushed Rock: No A/F Gravel: No A/F Sand: No A/F<br />
Log. (Gravel: Cem) Log. (Crushed Rock: Cem) Log. (Sand: Cem)<br />
Log. (Crushed Rock: No A/F) Log. (Gravel: No A/F) Log. (Sand: No A/F)<br />
350<br />
Etan Modulus (MPa)<br />
300<br />
250<br />
200<br />
150<br />
100<br />
0 5 10 15 20 25 30<br />
Days<br />
Figure G.16 Tangent modulus performance of BSM-foam mixes versus curing period<br />
There is a general increase in tangent modulus performance over curing period. The increase in tangent<br />
modulus performance is directly attributed by the decrease in moisture contents due to curing. Generally,<br />
tangent modulus seems to flatten out with time, yielding equilibrium. Research of cold mix performance has<br />
shown increase in material stiffness over curing time, (Loizos et al, 2007).<br />
Cement treated materials seem to outperform non cement treated materials in terms of Resilient Modulus<br />
achieved. Generally, crushed rock offers the best stiffness, a factor attributed to the material’s high cohesion<br />
and friction angle properties. Gravels seem to come second in rank in terms of material strength.<br />
Emulsion Binder Tangent Modulus Trends<br />
Similar trends for emulsion mixes have also been identified. All solid lines in Figure 0.17 represent cement<br />
treated materials. The brown lines represent crushed rock and the orange lines represent the gravel<br />
material, whilst the dark grey lines represent the sand material.<br />
34
Preliminary Monotonic Tests: Emulsion <strong>Mix</strong>es<br />
Crushed Rock: Cem Gravel: Cem Sand: Cem<br />
Crushed Rock: No A/F Gravel: No A/F Sand: No A/F<br />
Log. (Gravel: Cem) Log. (Crushed Rock: Cem) Log. (Sand: Cem)<br />
Log. (Crushed Rock: No A/F) Log. (Gravel: No A/F) Log. (Sand: No A/F)<br />
330<br />
Etan Modulus (MPa)<br />
280<br />
230<br />
180<br />
130<br />
80<br />
0 5 10 15 20 25 30<br />
Days<br />
Figure G.17 Tangent modulus performance of BSM-emulsion mixes versus curing<br />
period<br />
From the observed results, cement treated specimens have higher tangent modulus values than non cement<br />
treated specimens (dashed lines). Once again, the crushed rock material gave the best tangent modulus<br />
performance over the curing period. Both non cement treated gravel and sand specimens seem to have the<br />
same tangent modulus characteristics over the long term.<br />
The most important observation is tangent modulus performance increase with reductions in moisture<br />
contents. This implies that materials stiffness is indirectly related to moisture content. Also, although the<br />
effects of cement may be negligible in terms of moisture behaviour for emulsion mixes, the inclusion of<br />
cement has a profound effect on material tangent modulus performance.<br />
3.2.6 Discussions and Closure<br />
Following the preliminary phase and accompanying supportive literature including findings from laboratory<br />
trials, conclusions were reached regarding formulation of project scope and curing assessment criteria in<br />
terms of the following:<br />
Material Type and Grading<br />
35
In order to simplify accelerated curing protocol investigation, it may be necessary to base all tests on an<br />
acceptable single type of material to help eliminate interpretation of complex behaviour which is usually<br />
material specific. The use of selected single material should help generate reliable trends that may be used<br />
to answer some of key challenges facing curing.<br />
Controlled laboratory grading may be necessary to help eliminate variability of the results, especially in the<br />
case of stiffness performance. Generating consistency in the observed trends should help monitor the<br />
revised curing protocol more closely.<br />
The choices of material type should satisfy TG2 grading parameters and should contain adequate fines. Also,<br />
the chosen material should respond reasonably well in terms of mixing properties for both foam and<br />
emulsion binder types<br />
Moisture<br />
The chosen material should ideally be mixed and compacted at the same moisture content for both foam and<br />
emulsion mixes. This should help with comparisons regarding moisture curing relative to time for both foam<br />
and emulsion binder types.<br />
There may be strong need to control moisture content and relative humidity conditions during curing of<br />
specimens. This process may be best controlled by sealing of specimens with plastic bags.<br />
Curing Temperature<br />
In order to avoid ageing of the binder, it may be necessary to cure samples at temperatures below the Ring<br />
and Ball softening point of bitumen. Temperatures as low as 22 ◦ C - 24 ◦ C may not be conducive to facilitate<br />
accelerated laboratory curing.<br />
Preliminary tests have confirmed this aspect. On average, it took 7 to 14 days for emulsion mixes to reach<br />
50% OMC. The industry may find it difficult to produce test specimens at this rate. It may therefore be<br />
necessary to cure at slightly higher temperatures to speed up the process.<br />
Active Filler<br />
From the preliminary results and the supportive research, both gravels and sands have confirmed the<br />
inclusion of cement during emulsion mixing as factor to slow down curing. The opposite was true for non<br />
cement treated mixes, with specimens curing at a much faster rate.<br />
Cement has a profound impact on material performance and the related moisture trends need further<br />
investigation. The inclusion of cement during mixing and its effects on material strength and moisture trends<br />
will have to be incorporated in the revised curing protocol.<br />
Mechanical Properties<br />
Findings by various researchers have shown that dynamic material tests are more sensitive to mix properties<br />
than monotonic tests. Material stiffness performance is known to provide the most representative<br />
benchmark for validating how representative the accelerated curing has been and whether specimens<br />
represent field conditions. It was therefore decided to opt for non destructive dynamic loading stiffness tests<br />
for the assessment of curing of specimens. This implies that same specimens can be cured over time and<br />
36
tested at specific intervals for stiffness performance. Testing same specimens over time should help create<br />
reliability and repeatability of results. This should help derive reliable trends needed for curing evaluation.<br />
In conclusion, the much observed rapid curing of foam mixes has led to higher tangent modulus performance<br />
over time than emulsion mixes. It may also be that the tested materials responded best to foam binder than<br />
emulsion binder. Nonetheless, the much anticipated increase in tangent modulus values relative to curing<br />
has confirmed findings of Loizos et al, (2007).<br />
Following findings from the preliminary phase, it was decided that curing of specimens be assessed using<br />
non destructive dynamic loading resilient tests. In terms of active filler, it was decided that both cement and<br />
lime be used to measure the impact on moisture and stiffness trends. Furthermore, it was decided that both<br />
foam and emulsion binder types need to be accommodated to assess boundaries of applicability for both<br />
binder types.<br />
3.3. Laboratory Investigation and Improvement<br />
This part of the laboratory investigation was designed predominantly to simulate field moisture and stiffness<br />
trends. The investigation process focused on assessing the evolution of material stiffness by prolonging<br />
accelerated curing of specimens (in the laboratory) beyond the equivalent of 5 years of field curing. The<br />
motivation for this approach was to establish equilibrium regions for both moisture and stiffness, where their<br />
trends with time would reach a plateau.<br />
By estimating equilibrium conditions for moisture and stiffness trends, the impact of different curing<br />
temperatures can be studied. Conditioning of specimens involved the use of set temperatures to assist in the<br />
study the effects of temperature on curing without controlling the external relative humidity environment.<br />
For this reason, specimens were cured in an unsealed state for the duration of the analysis period.<br />
Consequently, the influence of temperature conditions on both moisture and stiffness trends could be studied<br />
effectively, with an emphasis on the establishment of equilibrium zones of material performance.<br />
Furthermore, results were used to define curing protocol solutions for both emulsion and foam binder mixes,<br />
as close monitoring and correlations between laboratory and field environments were maintained.<br />
3.3.1 Test Matrix<br />
A tests matrix was established for both emulsion and foam binder mixes. Two curing temperatures were<br />
considered following field temperature measurements from the installed temperature and humidity buttons.<br />
Furthermore, findings by various researchers also played a role in selecting appropriate curing temperatures.<br />
It was decided that both 30 ºC and 40 ºC would represent field temperatures for the N7 crushed Hornfels<br />
material following findings by temperature buttons. Since the motive of the curing investigation is primarily<br />
focused on accelerating field curing, it was further decided that typical ambient temperatures of 25 ºC would<br />
prolong the curing process. Tests results from the preliminary section of the research showed that emulsion<br />
mixes took an average of 7 days to reach 50% of OMC. Furthermore, due to requirements by the industry<br />
i.e. minimizing the time needed to carry out laboratory protocols, it was decided that the use of higher curing<br />
temperatures, but remaining below Ring and Ball Softening Point values, would yield shorter curing<br />
durations.<br />
37
Furthermore, both lime and cement need to be considered as active fillers for both emulsion and foam binder mixes. Lime and cement active<br />
fillers were investigated as they tend to promote moisture consumption and migration in BSMs. Both lime and cement are ideal for use as active<br />
fillers due their chemical change characteristics within short space of time during the mixing process. Figure 0.18 shown below illustrates the<br />
adopted test matrix for laboratory curing investigation and improvement process.<br />
N7 Crushed Hornfels Rock<br />
Emulsion<br />
Foam<br />
30 ◦ C<br />
40 ◦ C<br />
40 ◦ C<br />
30 ◦ C<br />
Lime<br />
Cement<br />
Lime<br />
Cement<br />
No Active Filler<br />
No Active Filler<br />
Lime<br />
Cement<br />
Lime<br />
Cement<br />
No Active Filler<br />
No Active Filler<br />
Figure G.18 Laboratory tests matrix for curing investigation and improvement<br />
38
Following the test matrix in Figure 0.18 a summary of test matrix parameters is presented in Table 0.10 shown below. Three specimens were<br />
made per each set of data points to help generate reliability of results.<br />
Table G.10: Summary of laboratory tests matrix parameters for curing investigation and improvement<br />
Material<br />
Type<br />
N7 Crushed Hornfels Material<br />
Binder Type BC Draft Oven Temperature Humidity Conditions 1% Active Filler Moisture & Stiffness Assessment IntervalsNo. of Briquett<br />
Emulsion 2.0% 30 ◦ C Lime 3<br />
Emulsion 2.0% 30 ◦ C Unsealed Cement Day 0 Day 1 Day 2 Day 3 Day 7 3<br />
Emulsion 2.0% 30 ◦ C No Active Filler 3<br />
Emulsion 2.0% 40 ◦ C Lime 3<br />
Emulsion 2.0% 40 ◦ C Unsealed Cement Day 0 Day 1 Day 2 Day 3 Day 7 3<br />
Emulsion 2.0% 40 ◦ C No Active Filler 3<br />
Foam 2.0% 30 ◦ C Lime 3<br />
Foam 2.0% 30 ◦ C Unsealed Cement Day 0 Day 1 Day 2 Day 3 Day 7 3<br />
Foam 2.0% 30 ◦ C No Active Filler 3<br />
Foam 2.0% 40 ◦ C Lime 3<br />
Foam 2.0% 40 ◦ C Unsealed Cement Day 0 Day 1 Day 2 Day 3 Day 7 3<br />
Foam 2.0% 40 ◦ C No Active Filler 3<br />
Total Number of Briquettes 36<br />
39
3.3.2 Controlled Grading<br />
In order to acquire reasonable trends during experimentation, it is necessary to manage variability of the<br />
results. Variability in stiffness performance values can be greatly reduced by maintaining controlled grading<br />
during mixing. Controlled grading should help generate repeatability of results and therefore increase<br />
reliability.<br />
Table 0.11 illustrates wet grading sieve analysis of N7 crushed hornfels rock material. The observed sieve<br />
analysis has been used to simulate target grading for laboratory mixes.<br />
Table G.11: Summary of N7 crushed hornfels rock wet grading analysis<br />
N7 CRUSHED HORNFELS ROCK<br />
Sieve Size (mm) Mass Retained on Sieve% Retained on Sieve% Passing through Sieve<br />
19.00 0.0 0.0% 100.0%<br />
13.20 172.5 6.9% 93.1%<br />
9.50 306.7 12.3% 80.8%<br />
6.70 412.2 16.5% 64.3%<br />
4.75 296.5 11.9% 52.5%<br />
2.36 400.0 16.0% 36.5%<br />
1.18 264.6 10.6% 25.9%<br />
0.600 149.9 6.0% 19.9%<br />
0.300 104.8 4.2% 15.7%<br />
0.150 85.9 3.4% 12.3%<br />
0.075 35.7 1.4% 10.9%<br />
PAN 271.2 10.85% 0.0%<br />
otal 2500.0 100.00%<br />
40
The target grading curve in Figure 0.19 below served as bench mark for laboratory mixes. In the laboratory,<br />
four sieving fractions were implemented for controlled grading of produced specimens.<br />
N7 Graded Crushed Stone (G2) Grading<br />
Wet Grading Curve<br />
100%<br />
90%<br />
80%<br />
70%<br />
60%<br />
50%<br />
40%<br />
30%<br />
20%<br />
10%<br />
0%<br />
0.01 0.10 1.00 10.00 100.00<br />
Particle Sieze (mm)<br />
% - Passing<br />
Figure G.19 Target grading curve of N7 crushed Hornfels rock material for laboratory<br />
mixes<br />
The implemented four sieving fractions have been summarised in Table 0.12 shown below. The mass<br />
fractions retained on specific sieves have been derived from target grading envelope shown in Figure 3.28.<br />
Table Error! No text of specified style in document..12: Summary of grading fractions used to<br />
maintain target laboratory grading<br />
Total mass per briquette (g) 12000<br />
Grading Distribution Fractions<br />
Mass Fractions retained on sieve Mass Fractions per Briquette (g)<br />
Material retained on 13.2 mm sieve 6.9% 828<br />
Material retained on 4.75 mm sieve 40.6% 4874<br />
Material retained on 2.36 mm sieve 16.0% 1920<br />
Material passing through 2.36 mm sieve (fines) 36.5% 4378<br />
100.0%<br />
During laboratory mixing of specimens, typical 150x250 mm moulds required not more than 12 kg of dry<br />
aggregate mass. Consequently, each specimen grading was based on 12 kg of dry aggregate mass.<br />
Implementation of controlled grading technique ensured consistency in mixing properties of produced<br />
briquettes. Moreover, controlled grading maintained that all produced briquettes were identical in terms of<br />
grading properties.<br />
3.3.3 Emulsion and Foam Binder <strong>Mix</strong>ing Properties<br />
Laboratory investigation focused on both emulsion and foam binder mixes. Following test matrix in Table<br />
0.10, a total of 18 briquettes were treated with emulsified binder whilst the remaining 18 briquettes were<br />
treated with foam binder.<br />
The following processes describe how mixes were produced in the laboratory:<br />
41
BSM-Emulsion<br />
Making of emulsion mixes involved the use of laboratory pugmill. All graded 12 kg mass samples were<br />
stored in buckets and later mixed in the pugmill. Briquettes were mixed with active filler in the pugmill prior<br />
to adding mixing water. All mixes were treated with 1% extra moisture to compensate for moisture loss<br />
during the breaking of emulsion before compaction.<br />
Coincidently, the 1% extra moisture maintained that all emulsion briquettes be mixed at 80% OMC similar to<br />
foam mixes. <strong>Mix</strong>ing of emulsion and foam mixes at the same %OMC was ideal as comparisons in moisture<br />
trends behaviour were on the same scale.<br />
After the addition of mixing water, emulsion fluid was added to make up optimum fluid content in the mixes.<br />
Furthermore, mixes were allowed to rest for an hour prior to compaction to assist with the breaking of<br />
emulsion binder.<br />
Figure 3.29 shown below illustrates laboratory pugmill mixers implemented for mixing of emulsion briquettes.<br />
Figure G.20 Laboratory pugmill mixer<br />
Once emulsion briquettes were produced, mixed materials were stored in sealed bags during breaking of<br />
emulsion. Upon compaction of mixes, cement and lime treated materials were compacted first to minimize<br />
rapid loss of compaction moisture.<br />
Figure 0.21 shown below illustrates color and texture of produced emulsion mixes. Typically, emulsion mixes<br />
have a rich brown color, with larger aggregates resembling coating by emulsion binder.<br />
Figure G.21 Laboratory emulsion binder mixes<br />
42
Furthermore, Table 0.13 presented below illustrates summary of produced briquettes and related laboratory mixing properties.<br />
Table G.13: Summary of emulsion treated briquettes and laboratory mixing properties<br />
Specimens Oven Curing Relative Humidity Binder Type Active Filler Compaction Height Compaction<br />
Mod.<br />
Vibratory<br />
Temperature Conditions Mass (g) (mm) Moisture Compaction<br />
Briquette 1 30 ◦ C Unsealed Emulsion 1% Lime 9778.8 250 3.73% 99.8%<br />
Briquette 2 30 ◦ C Unsealed Emulsion 1% Lime 9792.1 250 3.68% 100.0%<br />
Briquette 3 30 ◦ C Unsealed Emulsion 1% Lime 9897.8 250 3.70% 101.1%<br />
Briquette 1 30 ◦ C Unsealed Emulsion 1% Cement 9912.2 250 3.72% 101.2%<br />
Briquette 2 30 ◦ C Unsealed Emulsion 1% Cement 9879.1 250 3.71% 100.9%<br />
Briquette 3 30 ◦ C Unsealed Emulsion 1% Cement 9948.2 250 3.70% 101.6%<br />
Briquette 1 30 ◦ C Unsealed Emulsion No Active Filler 9984 250 3.70% 101.9%<br />
Briquette 2 30 ◦ C Unsealed Emulsion No Active Filler 9887.6 250 3.76% 100.9%<br />
Briquette 3 30 ◦ C Unsealed Emulsion No Active Filler 9922.2 250 3.88% 101.1%<br />
Briquette 1 40 ◦ C Unsealed Emulsion 1% Lime 9787.3 250 3.76% 99.9%<br />
Briquette 2 40 ◦ C Unsealed Emulsion 1% Lime 9881.3 250 3.64% 100.9%<br />
Briquette 3 40 ◦ C Unsealed Emulsion 1% Lime 9880.2 250 3.70% 100.9%<br />
Briquette 1 40 ◦ C Unsealed Emulsion 1% Cement 9822.1 250 3.78% 100.2%<br />
Briquette 2 40 ◦ C Unsealed Emulsion 1% Cement 9874.5 250 3.64% 100.9%<br />
Briquette 3 40 ◦ C Unsealed Emulsion 1% Cement 9877.1 250 3.76% 100.8%<br />
Briquette 1 40 ◦ C Unsealed Emulsion No Active Filler 9902.2 250 3.85% 100.9%<br />
Briquette 2 40 ◦ C Unsealed Emulsion No Active Filler 9804.3 250 4.08% 99.7%<br />
Briquette 3 40 ◦ C Unsealed Emulsion No Active Filler 9912.5 250 4.02% 100.9%<br />
43
BSM-Foam<br />
Manufacturing of foamed mixes followed similar processes described under production of emulsion mixes.<br />
During initial stages of making foam mixes, all 12 kg aggregate samples were mixed with active filler prior to<br />
addition of mixing water using laboratory pugmill mixer shown in Figure3.29. Once aggregates were mixed<br />
with active filler and mixing water, plastic bags were used to contain the wet mixed samples.<br />
The proceeding phase involved treatment of wet aggregates with foam binder in the WLB10 pugmill mixer.<br />
Figure 0.22 below shows schematic view of laboratory WLB10 pugmill mixer.<br />
Figure G.22 Laboratory WLB10 pugmill mixer<br />
The pugmill mixer was attached to the WLB10 foam plant machine shown in figure 0.23 below. Once quality<br />
of foam binder was satisfactory according to foaming index as discussed in literature review chapter,<br />
production of mixes would commence.<br />
Figure G.23 Laboratory WLB10 foam plant machine<br />
Table 0.14 shown below illustrates foaming properties used to manufacture foam treated briquettes for<br />
laboratory tests. The measured consistency on foaming quality emphasizes good laboratory control on<br />
production of mixes.<br />
Table G.14: Laboratory foam expansion test properties<br />
30 ◦ C<br />
Foam Expansion Tests Briquettes<br />
40 ◦ C<br />
Briquettes<br />
Date 8-Nov-2007 16-Nov-2007<br />
Water Pressure 5 bar 5 bar<br />
Air Pressure 4 bar 4 bar<br />
Bitumen Temperature 176-177 ◦ C 164 ◦ C<br />
Bitumen Grade 80/100 80/100<br />
Calculated Bitumen Flow 120 g/s 121 g/s<br />
Water Flow: 2.75-3% Bit Flow 3.33 - 3.60 g/s 3.33 -3 .63 g/s<br />
Bucket Temperature 50-60 ◦ C 60 ◦ C<br />
Foam (g) 500 grams 500 grams<br />
Foam Spay Time 4.17 sec 4.13 sec<br />
Measure Expansion 15 15<br />
Recorded Half Life 28 sec 30 sec<br />
Foam Index 500 sec 500 sec<br />
Quality of Foam Good Good<br />
As noted, both 30 ºC and 40 ºC briquettes were produced on different occasions due to tight laboratory<br />
schedules. Furthermore, quality control measures were used to maintain production of high quality foam<br />
mixes. In some instances, cold aggregates were warmed in draft ovens for 30 minutes at 25 ºC in sealed<br />
bags to help maintain production of good quality foam mixes.<br />
44
Aggregate temperature was monitored during production of foam mixes. A temperature laser gauge was<br />
implemented for the monitoring of aggregate and bitumen temperatures. Once aggregates were coated with<br />
foam binder, compaction followed immediately. Figure 3.33 shown below illustrates texture of produced<br />
foam mixes.<br />
Figure G.24 Laboratory foam binder mixes<br />
Evidently, foam mixes are much lighter in colour texture than emulsion mixes. Furthermore, there seems to<br />
be more coating of fines than larger aggregates. Summary of produced foam mixes is presented in Table<br />
0.15 shown below.<br />
45
Table G.15: Summary of foam treated briquettes and laboratory mixing properties<br />
Specimens Oven Curing Relative Humidity Binder Type Active Filler<br />
Aggregate<br />
<strong>Mix</strong>ing Compaction Height Compaction Mod. AASHTO<br />
Temperature Conditions Temperature Mass (g) (mm) Moisture Compaction<br />
Briquette 1 30 ◦ C Unsealed Foam 1% Lime 19 ◦ C 9817.4 250 3.52% 100.4%<br />
Briquette 2 30 ◦ C Unsealed Foam 1% Lime 20 ◦ C 9951.5 250 3.54% 101.8%<br />
Briquette 3 30 ◦ C Unsealed Foam 1% Lime 19 ◦ C 9873.2 250 3.41% 101.1%<br />
Briquette 1 30 ◦ C Unsealed Foam 1% Cement 19 ◦ C 9819.3 250 3.58% 100.4%<br />
Briquette 2 30 ◦ C Unsealed Foam 1% Cement 18 ◦ C 9822.5 250 3.57% 100.4%<br />
Briquette 3 30 ◦ C Unsealed Foam 1% Cement 20 ◦ C 9802.8 250 3.49% 100.3%<br />
Briquette 1 30 ◦ C Unsealed Foam No Active Filler 19 ◦ C 9809.5 250 3.65% 100.2%<br />
Briquette 2 30 ◦ C Unsealed Foam No Active Filler 20 ◦ C 9700 250 3.47% 99.3%<br />
Briquette 3 30 ◦ C Unsealed Foam No Active Filler 19 ◦ C 9768.6 250 3.43% 100.0%<br />
Briquette 1 40 ◦ C Unsealed Foam 1% Lime 21 ◦ C 9796.4 250 3.53% 100.2%<br />
Briquette 2 40 ◦ C Unsealed Foam 1% Lime 21 ◦ C 9810.2 250 3.57% 100.3%<br />
Briquette 3 40 ◦ C Unsealed Foam 1% Lime 20 ◦ C 9819.2 250 3.38% 100.6%<br />
Briquette 1 40 ◦ C Unsealed Foam 1% Cement 20 ◦ C 9814.2 250 3.67% 100.2%<br />
Briquette 2 40 ◦ C Unsealed Foam 1% Cement 21 ◦ C 9829.2 250 3.76% 100.3%<br />
Briquette 3 40 ◦ C Unsealed Foam 1% Cement 20 ◦ C 9810.9 250 3.89% 100.0%<br />
Briquette 1 40 ◦ C Unsealed Foam No Active Filler 20 ◦ C 9822.8 250 3.55% 100.4%<br />
Briquette 2 40 ◦ C Unsealed Foam No Active Filler 20 ◦ C 9831.6 250 3.48% 100.6%<br />
Briquette 3 40 ◦ C Unsealed Foam No Active Filler 21 ◦ C 9894.2 250 3.89% 100.8%<br />
46
3.3.4 Controlled Vibratory Compaction<br />
Controlled laboratory vibratory compaction of specimens was achieved using vibratory Kango Hammer . It<br />
was decided that field compaction would be accurately simulated with vibratory compaction. Although roller<br />
compaction would be ideal, manufacturing of rectangular beds were not feasible due to laboratory stiffness<br />
testing protocol.<br />
In order to simulate the action of heavy steel rollers in the field, the Kango Hammer ® was loaded with a 10<br />
kg surcharge to exert extra compaction weight. The vibrations from Kango Hammer ® also seemed to assist<br />
with proper particle packing during compaction, see Task 12. Vibrations coupled with weight seemed to<br />
allow for best material settling and with minimum voids in the compacted mixes.<br />
Figure 0.25 shown below depicts the implemented laboratory kango hammer compaction setup.<br />
Figure G.25 Laboratory vibratory compaction protocol using kango hammer (Kelfkens,<br />
2007)<br />
Split mould sizes of 150x250 mm were used for the manufacturing of laboratory mixes. From trial tests, five<br />
layers resembled the best compaction results. During compaction of a single layer, time was monitored for<br />
the layer under analysis to reach 100% Mod. AASHTO compaction or 50 mm thickness.<br />
The completed and compacted 50 mm material layers were scarified in top 5 mm with small chisel to loosen<br />
up material for the next layer. The chisel was aimed at an angle with minimum force to avoid damage to the<br />
compacted layers. Once the top material was loose, compaction of proceeding layers was achievable.<br />
Furthermore, all materials were compacted at 80% of OMC. At these moisture levels, compaction of N7<br />
Hornfels crushed rock material proved to be of good standard. Moreover, the 80%of OMC moisture proved<br />
ideal as compaction of samples at much higher moisture levels yielded dispersion of binder in the mix during<br />
vibrations, as witnessed by binder seeping out at the base of the moulds during compaction. 70% of OMC<br />
appears slightly dry for foamed BSMs. Evidently, the 80% of OMC seemed to yield better compaction for all<br />
binder types with minimum variability, see Task 12.<br />
During compaction of specimens, the non constant compaction time per layer proved difficult to generate<br />
consistency in compacted materials. Figure 0.26 illustrates the complex compaction behaviour of analysed<br />
samples.<br />
Figure G.26 Time to yield 100% Mod. AASHTO compaction versus layer thickness<br />
(Kelfkens, 2007)<br />
In order to control compaction, monitoring of layer thickness proved more reliable than monitoring of<br />
compaction time. Consequently, compaction was controlled by monitoring of layer thickness. The required<br />
mass per each 50 mm of specimen’s height was estimated for both emulsion and foam binder mixes. Table<br />
0.16 shows how compaction was controlled for emulsion mixes.<br />
47
Table G.16: Controlled emulsion mix compaction of N7 crushed hornfels rock material<br />
100% Mod. AASHTO Compaction For Emulsion <strong>Mix</strong>es<br />
Emulsion content 3.30%<br />
Binder content 1.98%<br />
Compaction moisture + 1% extra moisture 3.14%<br />
%OMC 81%<br />
Specimen height (mm) 250<br />
Height per layer (mm) 50<br />
Max dry density (kg/m 3 ) 2138<br />
Max wet density (kg/m 3 ) 2205<br />
Required mass of specimen per 50 mm layer (g) 1948<br />
Furthermore, due to differences in fluid mixing contents for both emulsion and foam binder mixes, different<br />
compaction properties were used for foam mixes. Table 0.17 illustrates the slight differences in required<br />
mass per 50 mm of foam binder briquettes.<br />
Table G.17: Controlled foam mix compaction of N7 crushed Hornfels rock material<br />
100% Mod. AASHTO Compaction For Foam <strong>Mix</strong>es<br />
Binder content 1.98%<br />
Compaction moisture 4.10%<br />
%OMC 80%<br />
Specimen height (mm) 250<br />
Height per layer (mm) 50<br />
Max dry density (kg/m3) 2138<br />
Max wet density (kg/m3) 2226<br />
Required mass of specimen per 50 mm layer (g) 1966<br />
3.3.5 Oven Curing Environments<br />
For simulation of field temperature conditions as observed from field temperature trends, it was decided that<br />
draft ovens would best represent field curing conditions. Draft ovens are ideal for curing of laboratory<br />
samples due to uniform temperature conditions within volume of ovens.<br />
Most industrial laboratories do not have relative humidity gauges installed in their draft ovens. Relative<br />
humidity conditions can best be simulated by sealing of specimens with solid moisture bags. Sealing of<br />
samples with solid moisture bags typically generates 100% relative humidity conditions around the<br />
briquette’s surface.<br />
Figure 0.27 shows the nature of curing environments implemented for laboratory samples<br />
Figure G.27 Laboratory oven curing environments<br />
Temperature of ovens during the curing process was monitored using a manual temperature gauge. The<br />
implemented manual temperature gauge has a tolerance of ±1ºC.<br />
48
Specimens were labelled to help distinguish between the different mixes. Furthermore, specimens were<br />
placed on top of 200 mm diameter boards for the protection of specimens against raveling and also to avoid<br />
thermo-conductivity at the bottom of the briquettes, especially in the case of implementing steel plates.<br />
3.3.6 Development of Short Dynamic Resilient Test Parameters using<br />
Monotonic Testing<br />
In order to accurately measure material stiffness relative to fabricated laboratory curing environments, it<br />
was necessary to first determine failure modes for the material under investigation.<br />
The above led to monotonic testing of the N7 graded crushed rock. Failure modes in the form of stress at<br />
failure and the appropriate stress ratios were developed. Also, the fabricated curing protocol required the<br />
measuring of stiffness trends relative to oven cure. This meant that MTS test parameters had to be<br />
developed for curing of specimens from day 0 onward.<br />
The curing guide specified under TG2 guideline was used for curing of specimens for the purpose of<br />
determining monotonic test parameters equivalent to 6 months field cure. The devised test parameters were<br />
used to evaluate day 0 up to day 7 stiffness properties of accelerated cured samples in the laboratory.<br />
Table G.18: TG2 Curing Guideline<br />
Accelerated Laboratory Curing Procedure for BSM<br />
20 hours at 30°C : Unsealed Replace wet plastic bags 2x specimen volume Simulated Field Conditions<br />
48 hours at 40°C : Sealed with dry ones at every 24 hours interval 6 Months<br />
Under the TG2 guideline, N7 briquettes were cured and then tested for monotonic failure modes parameters.<br />
The following table shows the adopted test matrix used for monotonic testing:<br />
Table G.19: Monotonic Test Matrix: Laboratory<br />
Residual Binder Active Filler Active Filler<br />
Material<br />
Binder Type Content<br />
Type<br />
Content<br />
2% Cement 1%<br />
Bitumen<br />
2% Lime 1%<br />
Emulsion 2% No Active Filler 0%<br />
2% Cement 1%<br />
Foamed<br />
2% Lime 1%<br />
N7 Graded Crushed Rock Bitumen 2% No Active Filler 0%<br />
Total number Monotonic Tests (MTS)<br />
Spec<br />
Te<br />
49
Applied Load versus Strain: Foam Binder Briquttes<br />
Cement Briquette 1 Cement Briquette 2 Cement Briquette 3<br />
Applied Load [N]<br />
20000<br />
18000<br />
16000<br />
14000<br />
12000<br />
10000<br />
8000<br />
6000<br />
4000<br />
2000<br />
0<br />
Confinement<br />
stress: 100 KPa<br />
1.0 1.5 2.0 2.5 3.0 3.5 4.0 4.5 5.0 5.5 6.0 6.5 7.0<br />
Strain [%]<br />
Figure G.28 Monotonic Testing: Applied load versus Strain<br />
The above figure gave the same order of magnitude for briquettes treated with similar filler content and<br />
residual binder. The observed consistencies in the measured trends may be attributed to quality grading<br />
control measures as mentioned under the methodology section (See Table 0.12).<br />
The table outlined below explains the reasoning behind determining monotonic test parameters as<br />
implemented for the resilient test protocol following accelerated laboratory cured samples:<br />
Table G.20: Determination of Monotonic Test Parameters<br />
σ a,f<br />
SR[%] =<br />
σ 1 - σ 3<br />
σ + σ<br />
1<br />
= σ a , f + σ 3<br />
dw<br />
σ Test(MTS) =<br />
σ a,f - σ dw<br />
F max<br />
= σ Test(MTS) X A briquette area<br />
Set Point =<br />
- [Preload + Fmax]<br />
2<br />
Span = [Set Point] -v e + Preload +ve<br />
Where,<br />
SR[%]<br />
σ a,f<br />
σ 3<br />
σ dw<br />
σ 1<br />
σ Test(MTS)<br />
Fmax<br />
= Stress ratio<br />
= Applied stress at failure<br />
= Confinement stress<br />
= Stress as a result of MTS dead weight of the top loading plate & piston<br />
= Major principal stress<br />
= Maximum applied stress during short duration dynamic test<br />
= Maximum applied Load during short duration dynamic test<br />
50
Using the abovementioned techniques, testing of laboratory briquettes was achieved by loading specimens<br />
with have sine load (Fmax) under the MTS machine. The loading consists of a have sine load with a pre-load<br />
of 20 kPa applied at with frequency of 2 Hz.<br />
The load and displacement data was sampled at a frequency of 1000 Hz for duration of 5 seconds. Prior to<br />
the data sampling the specimen was subjected to 120 load cycles at each deviator stress ratio.<br />
The following graph illustrates the nature of monotonic testing as described above:<br />
Load Controlled Test (MTS): Load Cycle versus Time<br />
Fmax: Max Applied Load<br />
Applied Vertical<br />
Load [kN]<br />
Set Point<br />
Preload: Min Loading Load (20 kPa)<br />
2 Hz Haversine Applied Load<br />
Span<br />
Time [sec]<br />
Figure G.29 Monotonic Testing: Load cycle versus time<br />
51
Using monotonic failure modes as depicted in figure 0.28, the following monotonic test parameters were<br />
developed for the non destructive resilient test protocol:<br />
Table G.21: Determination of non destructive resilient test parameters<br />
SHORT DURATION DYNAMIC LOAD<br />
MONOTONIC TEST ANALYSIS OF FOAMED BINDER BRIQUETTES<br />
・ 3 Max Strain at ・ af σ ・ Etan Esec<br />
load Failure<br />
SR (%)<br />
[kPa] [kN] [%] [kPa] [kPa] [MPa] [MPa] [%] [kN] [kN] [kN] [kPa] [Hz]<br />
FOAMED BITUMEN MIXES<br />
TEST PARAMETERS<br />
Max Load Set Span σ3 Freq<br />
(Applied) Point<br />
1% Lime Treated Briquettes<br />
Briquette 1 100 19.8 1.09 1119.5 1221.4 102.3 111.6<br />
Briquette 2 100 19.5 1.24 1103.2 1205.2 89.0 97.2<br />
Briquette 3 100 22.8 1.06 1293.0 1394.9 122.4 132.0<br />
Average 100 20.7 1.13 1171.9 1273.8 104.6 113.6 25% 5.2 -2.8 2.4 100 2<br />
1% Cement Treated Briquettes<br />
Briquette 1 100 16.0 1.07 905.3 1007.3 84.6 94.1<br />
Briquette 2 100 16.8 1.11 948.7 1050.7 85.6 94.8<br />
Briquette 3 100 15.2 0.96 862.0 963.9 89.9 100.6<br />
Average 100 16.0 1.05 905.3 1007.3 86.7 96.5 25% 4.0 -2.2 1.8 100 2<br />
No Active Filler<br />
Briquette 1 100 16.7 1.30 946.0 1048.0 72.6 80.4<br />
Briquette 2 100 13.3 1.29 750.8 852.8 58.4 66.3<br />
Briquette 3 100 14.8 1.03 837.6 939.5 81.2 91.1<br />
Average 100 14.9 1.21 844.8 946.8 70.7 79.3 25% 3.7 -2.0 1.7 100 2<br />
BITUMEN EMULSION MIXES<br />
1% Lime Treated Briquettes<br />
Briquette 1 100 17.8 0.84 1005.6 1107.6 154.5 131.7<br />
Briquette 2 100 18.4 0.85 1043.6 1145.5 155.8 134.9<br />
Briquette 3 100 19.7 1.00 1114.1 1216.0 138.2 121.3<br />
Average 100 18.6 0.90 1054.4 1156.4 149.5 129.3 25% 4.6 -2.5 2.1 100 2<br />
1% Cement Treated Briquettes<br />
Briquette 1 100 15.1 1.26 853.8 955.8 123.4 75.7<br />
Briquette 2 100 13.3 1.01 750.8 852.8 98.6 84.7<br />
Briquette 3 100 11.8 1.01 669.5 771.5 102.4 76.3<br />
Average 100 13.4 1.09 758.1 860.0 108.1 78.9 25% 3.3 -1.8 1.5 100 2<br />
No Active Filler<br />
Briquette 1 100 12.1 0.93 685.8 787.7 104.9 84.7<br />
Briquette 2 100 10.2 0.89 577.4 679.3 90.4 76.1<br />
Briquette 3 100 9.4 1.48 534.0 635.9 81.1 43.1<br />
Average 100 10.6 1.10 599.0 701.0 92.1 68.0 25% 2.6 -1.5 1.1 100 2<br />
52
To date, a total of 252 non destructive resilient tests have been performed on laboratory samples. The<br />
following tables illustrated the number of tests undertaken:<br />
Table G.22: Number of repeat testing for the non destructive laboratory resilient test<br />
INNITIAL CURING PROTOCOL EXPERIMENTATION - IMPROVEMENT<br />
Confinement Briquettes Oven Curing Relative Test<br />
Stress: σ3 SR Binder Type (No) Temperature Humidity Frequency (N<br />
[kPa] [%] [°C] [%]<br />
Bitumen Emulsion 1 % Cem 3<br />
Bitumen Emulsion 1 % Lime 3<br />
Bitumen Emulsion No Filler 3 30 Unsealed Day 0,1, 2, 3,7<br />
Bitumen Emulsion 1 % Cem 3<br />
Bitumen Emulsion 1 % Lime 3<br />
Bitumen Emulsion No Filler 3 40 Unsealed Day 0,1, 2, 3,7<br />
Foamed Bitumen 1 % Cem 3<br />
Foamed Bitumen 1 % Lime 3<br />
Foamed Bitumen No Filler 3 30 Unsealed Day 0,1, 2, 3,7<br />
Foamed Bitumen 1 % Cem 3<br />
Foamed Bitumen 1 % Lime 3<br />
100 25% Foamed Bitumen No Filler 3 40 Unsealed Day 0,1, 2, 3,7<br />
FINAL CURING PROTOCOL EXPERIMENTATION - VALIDATION<br />
Bitumen Emulsion 1 % Cem 3<br />
Unsealed<br />
Bitumen Emulsion 1 % Lime 3<br />
&<br />
Bitumen Emulsion No Filler 3 30 & 40 Sealed Hrs 0,20,44,68<br />
Foamed Bitumen 1 % Cem 3<br />
Unsealed<br />
Foamed Bitumen 1 % Lime 3<br />
&<br />
100 25% Foamed Bitumen No Filler 3 30 & 40 Sealed Hrs 0,12,36,60<br />
Total number of MTS tests<br />
53
3.3.7 Short Duration Dynamic Resilient Test Method<br />
Laboratory specimens were tested using non destructive short duration dynamic testing. Short duration<br />
dynamic resilient test is a load controlled test with displacement being measured as the output. The MTS<br />
apparatus was implemented for all laboratory tests. Testing of specimens involved covering of specimens<br />
with latex membrane for confinement pressure applications. Specimens then followed short dynamic loading<br />
tests using the MTS setup shown below in Figure 0.28<br />
Figure G.30 Testing of briquettes using laboratory MTS setup<br />
The MTS setup has an internal LVDT (Lateral Vertical Displacement Transducer) that measures displacement<br />
of briquettes during dynamic loading. Trial measurements showed discrepancies captured by the MTS<br />
internal LVDT due to movements occurring between the loading plate and briquettes. The discrepancies in<br />
measured results were further perpetuated by movements occurring between bases of briquette’s base plate<br />
and the loading shaft.<br />
For these reasons, an external LVDT was mounted to capture briquette’s displacement in the vertical<br />
direction during dynamic loading. The external LVDT was able to capture briquette’s vertical displacement in<br />
the vertical direction independent of movements occurring between briquette’s base plates and the MTS<br />
loading shaft.<br />
During testing, fresh specimens were initially conditioned with 10 000 loading cycles prior to taking of<br />
displacement measurements. Load conditioning of specimens allows material particles to settle and therefore<br />
allow initial stiffness to stabilize.<br />
Due to nature of fresh materials, most specimens failed after 5000 load repetitions. Consequently, all<br />
specimens were conditioned at 2000 load repetitions to avoid failure. Once briquettes had been conditioned<br />
in their fresh state and displacement measurements taken, oven curing of briquettes followed. Briquettes<br />
which had been previously conditioned only required 120 load repetitions before future measurements were<br />
made.<br />
Typically, fresh specimens were tested within 8 hours from the time of compaction. Oven curing of<br />
specimens followed 4 hours after testing of briquettes. Furthermore, specimens were tested at 24 hour<br />
intervals. Specimens were also allowed to cool for an average of 3 hours once taken out of the oven curing<br />
environment before testing. Furthermore, all tests were conducted at room temperatures.<br />
Figure 0.29 illustrates a typical load signal vertical displacement measurement. Typical measurement takes 5<br />
minutes resulting in 10 cycles of measurements being captured.<br />
Figure G.31 External LVDT load signal vertical displacement measurement<br />
Once displacement is captured, vertical strain can be determined using the following equation:<br />
ε = ∆H<br />
H<br />
Where:<br />
H = Briquette’s Height<br />
54
ε<br />
= Vertical Strain<br />
Figure 0.30 shown below displays controlled dynamic loading signal applied on briquette’s surface area. The<br />
dynamic load is measured against time during loading of briquettes.<br />
Figure G.32 External LVDT load signal measurement<br />
Once dynamic load is captured, stress can be calculated as loading force per unit area. Figure 3.4 displays<br />
stress versus time as derived from dynamic load graph in Figure 0.31.<br />
Figure G.33 External LVDT load signal vertical stress measurement<br />
Dynamic resilient modulus can be calculated using the following equation:<br />
Mr<br />
Where:<br />
= σ/ε<br />
Mr<br />
σ<br />
ε<br />
: Resilient modulus<br />
: Applied vertical Stress<br />
: Applied vertical strain<br />
Resilient modulus was calculated for each peak shown in figure 0.31. Table 0.18shown below illustrates how<br />
vertical strain was calculated from the maximum and minimum peaks on the displacement graph. The<br />
estimated strain linked to vertical stress gave estimate to resilient modulus values.<br />
Table G.23: Stiffness analysis from cycle 1 of stress strain relationship graph<br />
Cycle From To<br />
1 0.000 0.575<br />
Load σd Ext LVDT<br />
[N] [kPa] [mm]<br />
minimum -4052.4 -229.3 0.0723<br />
maximum -632.3 -35.8 0.1641<br />
difference 3420.1 193.5 0.0918<br />
axial strain [mstrain] 367.19<br />
Stress [kPa] 193.5<br />
Cstress [kPa] 193.5<br />
Mr [MPa] 527<br />
55
Table 0.19 shown below illustrates average resilient modulus values per loading cycle. The briquette’s<br />
resilient modulus was taken as the average stiffness occurring within a single specific loading cycle.<br />
Table G.24: Average stiffness analysis all cycles<br />
Cycle Mr [MPa]<br />
1 527<br />
2 527<br />
3 527<br />
4 538<br />
5 525<br />
6 524<br />
7 527<br />
8 538<br />
Average Mr 529<br />
Results were processed using the computer setup shown below in figure 3.39. LVDT Measurements were<br />
recorded on the binary factor of ±2048 in the analogue conversion by the computer. Once measurements<br />
were taken, the spreadsheet program converted the measured displacements into the ±10.0 V scale.<br />
Furthermore, calibration of the external LVDT yield 10.0 V/4 mm in the vertical direction.<br />
The 10.0 V scale was converted to SI units using 20% an 100% scale conversion for the load and vertical<br />
displacement measurements.<br />
Figure G.34 Laboratory MTS computer setup<br />
56
4. RESULTS AND FINDINGS<br />
4.1. Laboratory Accelerated Curing Experimentation – Improvement<br />
This section contains laboratory moisture and stiffness trends obtained from the curing<br />
experimentation tests matrix outlined in the methodology section.<br />
Results have helped fabricate final accelerated laboratory curing protocol for both foam and<br />
emulsion binder mixes.<br />
4.1.1 Laboratory Resilient Modulus and Moisture Trends<br />
Foam <strong>Mix</strong>es<br />
Laboratory tests show that BSM-foam briquettes when compacted at 80% of OMC reach an average of 50%<br />
of OMC only after 10 – 15 hours of curing at both 30 and 40 ºC (unsealed). Solid lines represent 40 ºC<br />
samples and dashed lines represent 30 ºC samples, see actual data points in Figure 5.3. Results confirm that<br />
in the first 12 hours of curing, both 30 and 40 ºC (unsealed) cured samples treated with cement, lime and<br />
without active filler cure at the same rate. Both temperature and inclusion of active fillers as variables, play a<br />
role only after 12 hours of curing.<br />
As expected, 30 ºC cured samples retain more moisture with time when compared to 40 ºC cured samples.<br />
Overall, at the same curing temperatures, there seems to be little difference in moisture trends between<br />
active filler and non active filler treated samples.<br />
In the case of foam mixes, observed trends may be attributed by the fact that curing of foam samples is<br />
simply achieved by water repulsion whilst the inclusion of active filer does not seems to influence the process<br />
significantly, as in the case of emulsion mixes.<br />
57
% OMC of Unsealed Foam Binder Briquettes versus Number of Curing Days at 30<br />
and 40 Degrees<br />
1 % Lime Briquettes: 40 C 1 % Cement Briquettes: 40 C No Active Filler Briquettes: 40 C<br />
1% Lime Briquettes: 30 C 1% Cement Briquettes: 30 C No Active Filler Briquettes: 30 C<br />
% OMC<br />
90%<br />
80%<br />
70%<br />
60%<br />
50%<br />
40%<br />
30%<br />
20%<br />
10%<br />
0%<br />
0 1 2 3 4 5 6 7<br />
Number of Curing Days in Oven at 30 and 40 Degrees (Unsealed)<br />
Figure G.33 N7 Graded crushed rock-Foam <strong>Mix</strong> %OMC curve over 7 days of laboratory curing at 30 ◦ C<br />
(dashed lines) and 40 ◦ C (solid lines) – unsealed<br />
Due to similar moisture trends, stiffness trends were also identical across the spectrum. Figure 0.33<br />
illustrates percentage of OMC versus Resilient Modulus trends for both 30 and 40 ºC cured samples.<br />
58
Resilient Modulus of Foam Binder Briquettes (Mr) versus % OMC over 7 Day<br />
Curing<br />
40 Deg Lime 40 Deg Cement 40 Deg No Filler<br />
30 Deg Lime 30 Deg Cem 30 Deg No Filler<br />
1000<br />
900<br />
800<br />
700<br />
Mr (MPa)<br />
600<br />
500<br />
400<br />
300<br />
200<br />
100<br />
0<br />
0% 10% 20% 30% 40% 50% 60% 70% 80% 90% 100%<br />
% OMC over 7 Day Curing at 30 and 40 Degrees (Unsealed)<br />
Figure G.34 N7 Graded crushed rock-Foam <strong>Mix</strong> Resilient curve over 7 days (expressed as %OMC of<br />
laboratory curing at 30 ◦ C (dashed lines) and 40 ◦ C (solid lines) - unsealed<br />
Due to rapid curing taking place at 40 ºC (unsealed), the rapid loss of moisture yielded higher stiffness<br />
values with time. The most important observation in Figure 0.34 is that given time, samples treated with<br />
active filler will generally develop higher stiffness values than non active filler treated samples.<br />
59
Emulsion <strong>Mix</strong>es<br />
Laboratory tests show that emulsion briquettes when compacted at 80%of OMC reached an average of 50%<br />
OMC only after 20 – 24 hours of curing (unsealed) - Solid lines represent 40 ºC samples and dashed lines<br />
represent 30 ºC samples, see actual data points in Figure 0.35.<br />
Contrary to foam mixes, results confirm that both 30 and 40 ºC (unsealed) cured samples treated with<br />
cement, lime and without active filler do not cure at the same rate from the onset.<br />
Both temperature and inclusion of active fillers seem to play a role immediately after compaction of samples.<br />
% OMC of Unsealed Emulsion Binder Briquettes versus Number of Curing Days at 30 and<br />
40 Degrees<br />
90%<br />
80%<br />
70%<br />
60%<br />
1 % Lime Briquettes: 40 C 1 % Cement Briquettes: 40 C No Active Filler Briquettes: 40 C<br />
1% Lime Briquettes: 30 C 1% Cement Briquettes: 30 C No Active Filler Briquettes: 30 C<br />
% OMC<br />
50%<br />
40%<br />
30%<br />
20%<br />
10%<br />
0%<br />
0 1 2 3 4 5 6 7<br />
Number of Curing Days in Oven at 30 and 40 Degrees (Unsealed)<br />
Figure G.35 N7 Graded crushed rock-Emulsion <strong>Mix</strong> %OMC curve over 7 days of laboratory curing<br />
(unsealed) at 30 ◦ C (dashed lines) and 40 ◦ C (solid lines)<br />
Generally, lime treated mixes cure slower than both cement and non active filler samples at both 30 and 40<br />
ºC (unsealed). Cement treated samples seem to loose moisture at a much rapid rate.<br />
Contrary to foam mixes, temperature seems to have a profound impact on emulsion mixes. Figure 0.35<br />
shows that the average difference in final %OMC between 30 and 40 degrees cured samples is in the vicinity<br />
10%.<br />
The influences of different active fillers on moisture trends can be clearly witnessed by the impact on<br />
stiffness performance of samples in Figure 0.36.<br />
Generally, although 40 ºC samples cured at a much faster rate, the 30 ºC cured samples yielded higher<br />
stiffness values. Temperature effects on stiffness values associated with different active filler types seem to<br />
yield complex behaviour in the case of emulsion treated samples.<br />
60
Resilient Modulus of Emulsion Binder Briquettes (Mr) versus % OMC over 7 Day<br />
Curing<br />
40 Deg Lime 40 Deg Cement 40 Deg No Filler<br />
30 Deg Lime 30 Deg Cem 30 Deg No Filler<br />
Mr (MPa)<br />
800<br />
700<br />
600<br />
500<br />
400<br />
300<br />
200<br />
100<br />
0<br />
0% 10% 20% 30% 40% 50% 60% 70% 80% 90% 100%<br />
% OMC over 7 Day Curing at 30 and 40 Degrees (Unsealed)<br />
Figure G.36 N7 Graded crushed rock-Emulsion <strong>Mix</strong> Resilient curve over 7 days (expressed as % of OMC of<br />
laboratory curing (unsealed) at 30 ◦ C (dashed lines) and 40 ◦ C.<br />
61
5. SYNTHESIS<br />
5.1. Boundaries of Application for Foamed and Emulsion Binder Types<br />
Laboratory findings have clearly indicated that under similar curing environments, both foam and<br />
emulsion mixes cure at different rates. When subject to laboratory curing temperature and humidity<br />
conditions, foam samples begin the curing process almost immediately. On the other hand, the<br />
breaking of emulsion after compaction seems to slow down curing rate in the first few hours.<br />
The underlined differences have impacted the unified accelerated laboratory protocol initiative. The<br />
differences in behaviour of both foam and emulsion mixes have called for two separate curing<br />
protocols for both foam and emulsion binder mixes.<br />
5.2. Formulation of Accelerated Curing Protocol<br />
Formulation of accelerated laboratory protocol was achieved by reconciling field and laboratory<br />
trends in terms of moisture and material stiffness.<br />
Laboratory moisture trends reflective of field moisture trends were achieved by controlled laboratory<br />
curing environments in terms of temperature and relative humidity conditions.<br />
In terms of both field and laboratory stiffness trends, the use of PSPA device in the field versus<br />
laboratory analysis made it difficult to compare stiffness measurements in terms of absolute values<br />
because of the different conditions and methods of imparting a load and measuring response.<br />
Consequently, comparisons of the two environments were achieved by the observation of stiffness<br />
trends and not by the observation of absolute values.<br />
For this reason, stiffness trends rather than absolute value were used to assess accelerated<br />
laboratory curing protocol for both foam and emulsion binder mixes.<br />
62
5.2.1 Reconciliation of Field and Laboratory Moisture & Resilient Modulus Trends<br />
Field validation was mainly achieved by monitoring of field moisture and stiffness trends. As observed from<br />
Figure 0.37 %OMC deviated from 75% during construction to 55 %OMC after 7 months of service period.<br />
N7 %OMC versus Tim e (days)<br />
% OMC<br />
85%<br />
80%<br />
75%<br />
70%<br />
65%<br />
60%<br />
55%<br />
50%<br />
45%<br />
Figure Error! 0 No text of specified 50 style in document..37 100 N7 Graded 150 crushed rock %OMC 200 curve over 7250<br />
months of curing period<br />
Time (days)<br />
FIELD LABORATORY RECONCILIATION IN TERMS OF:<br />
• Moisture and Relative Humidity<br />
Initial decrease in field %OMC (14 days of ETB exposure to field conditions)<br />
The drop in field %OMC as observed from above figure was mainly due to outside temperatures of 20 ◦ C-<br />
30 ◦ C. Although relative humidity conditions were not physically measured in this period, it was decided that<br />
for laboratory applications, the initial phase of curing will have to rely solely on temperature curing to help<br />
decrease initial moisture from 80%OMC to 60%OMC as reflective of field behaviour.<br />
Based on field ETB layer exposure to outside temperatures of (20 ◦ C-30 ◦ C) and unsealed humidity conditions<br />
for the duration of 14 days, the following laboratory curing conditions for the initial curing phase were<br />
chosen:<br />
Temperature<br />
Relative Humidity<br />
Target<br />
Curing Time<br />
: 30 ◦ C<br />
: Unsealed<br />
: Decrease from 80%OMC to 60%OMC<br />
: Variable between Emulsion and Foam <strong>Mix</strong>es<br />
63
Prolonged decrease in field %OMC (6 months of curing after application of HMA)<br />
The second prolonged phase of field curing after application of HMA as observed from Figure 0.37 showed<br />
decrease of field moisture from 60%OMC to 55%OMC (6 months average). During this season, conditions<br />
inside ETB layer showed that humidity fluctuated between (70%: 100%) whilst temperature fluctuated<br />
between (10 ◦ C:38.5 ◦ C).<br />
For the purpose of laboratory application, it was decided that the prolonged curing phase be dominated by<br />
both relative humidity and temperature conditions as reflective of field conditions to help decrease %OMC<br />
form 60%OMC to 55%OMC as demonstrated by field trends in Figure 0.37.<br />
Based on field ETB layer being covered by HMA and subjected to ETB temperatures of (10 ◦ C-38.5 ◦ C) and<br />
sealed relative humidity conditions of (70%-100%) for the duration of 6 months, the following curing<br />
conditions for the prolonged curing phase were chosen:<br />
Temperature<br />
Relative Humidity<br />
Target<br />
Curing Time<br />
: 40 ◦ C<br />
: Sealed (100% Relative Humidity)<br />
: 55%OMC-50%OMC<br />
: Variable between Emulsion and Foam <strong>Mix</strong>es<br />
In terms of field stiffness performance, the inclusion of cement seems to increase field stiffness of good<br />
quality BSM- emulsion up to three times the original value within 7 months of field curing. Figure 0.38shown<br />
below illustrates this.<br />
N7 PSPA Mr Analysis over 7 Months<br />
4000<br />
Exp Regression Model Linear Model Pow er (Exp Regression Model)<br />
3500<br />
3000<br />
2500<br />
Mr (MPa)<br />
2000<br />
1500<br />
1000<br />
500<br />
0<br />
Figure.38 0 N7 Graded crushed 50rock centreline stiffness 100 performance during 1507 months of field curing 200 250<br />
Tim e (Days)<br />
64
Due to conflicting methods of acquiring stiffness measurements in both field and laboratory environments,<br />
the following conflicting factors played a role in the decision to relate both field and laboratory trends rather<br />
than absolute values:<br />
• Field terrain characteristics versus laboratory samples<br />
• Method of stiffness measurements: Laboratory Short Dynamic loading Analysis (MTS) versus High<br />
Frequency Wave Measurements in the field (PSPA)<br />
Field stiffness was monitored by the PSPA device whilst laboratory stiffness was monitored using non<br />
destructive tests on the MTS setup.<br />
The PSPA device uses high frequency wavelengths (20 MHz) in the ETB layer to measure material stiffness<br />
whilst the MTS setup measures material deflections under sine wave loading (2 Hz) to help generate material<br />
stiffness.<br />
Due to the different material testing devices and conflicting methods of stiffness acquisitions for both field<br />
and laboratory environments, it was decided that stiffness trends, rather than absolute values be used as<br />
benchmark for laboratory curing validation.<br />
5.3. Laboratory Implementation of Proposed Curing Protocol – Field Validation<br />
Following proposed draft curing protocol, final curing experiment was conducted to help validate<br />
accelerated laboratory curing protocol for both foam and emulsion binder types.<br />
Both moisture and stiffness trends were closely monitored to help reflect field moisture and<br />
stiffness trends. Furthermore, active filler was included to help address laboratory curing holistically.<br />
5.3.1 Active Filler Influences on Foam and Emulsion <strong>Mix</strong>es<br />
In terms of active filler influences on laboratory stiffness trends, the following observations were made:<br />
• Cement treated briquettes for both emulsion and foamed binder types outperformed both lime treated<br />
and non active filler briquettes.<br />
• For the case of emulsion binder types, both lime and non active filler briquettes resembled almost<br />
identical stiffness trends and values.<br />
• For the case of foamed binder types, lime treated briquettes fell just short of cement treated mixes,<br />
whilst non active filler briquettes gave the lowest stiffness values.<br />
The following tables and graphs explain the above mentioned facts:<br />
65
5.3.2 Final Curing Laboratory Protocol - Resilient Modulus and Moisture Trends<br />
Table G.20: Accelerated laboratory curing protocol for foamed bitumen mixes (Draft)<br />
Active Filler Type<br />
Accelerated Lab Curing Protocol for Foam Binder Briquettes<br />
After Compaction Unsealed for 12 hrs at 30 ◦ C Sealed for 24 hrs at 40 ◦ C Sealed for 24 hrs at 40<br />
Briquettes Moisture % OMCMr (MPa) Moisture % OMC Mr (MPa) Moisture % OMCMr (MPa) Moisture % OMC Mr (MP<br />
Briquette 1 3.50% 68.36% 491 3.01% 58.79% 500 2.92% 57.03% 603 2.84% 55.47% 620<br />
1% Lime Content Briquette 2 3.51% 68.57% 441 3.03% 59.18% 520 2.93% 57.23% 619 2.85% 55.66% 627<br />
Briquette 3 3.52% 68.75% 475 3.02% 58.98% 550 2.91% 56.84% 611 2.86% 55.86% 630<br />
Average 3.51% 68.56% 469 3.02% 58.98% 523 2.92% 57.03% 611 2.85% 55.66% 626<br />
Std Dev 0.01% 26 0.01% 25 0.01% 8 0.01% 5<br />
Cov 0.29% 5.44% 0.33% 4.81% 0.34% 1.31% 0.35% 0.82%<br />
Briquette 1 3.59% 70.16% 460 2.99% 58.36% 571 2.90% 56.64% 621 2.83% 55.27% 679<br />
1% Cement Content Briquette 2 3.70% 72.17% 473 3.05% 59.47% 547 2.95% 57.62% 584 2.85% 55.66% 666<br />
Briquette 3 3.29% 64.25% 443 2.70% 52.79% 543 2.60% 50.78% 595 2.52% 49.22% 652<br />
Average 3.53% 68.86% 459 2.91% 56.88% 554 2.82% 55.01% 600 2.73% 53.39% 652<br />
Std Dev 0.21% 15 0.18% 15 0.19% 19 0.19% 14<br />
Cov 5.98% 3.28% 6.29% 2.74% 6.72% 3.17% 6.77% 2.07%<br />
Briquette 1 3.40% 66.39% 391 2.58% 50.35% 475 2.51% 49.02% 539 2.43% 47.46% 535<br />
No Active Filler Briquette 2 3.47% 67.85% 381 2.77% 54.06% 439 2.68% 52.34% 564 2.61% 50.98% 585<br />
Briquette 3 3.59% 70.02% 424 2.95% 57.58% 465 2.87% 56.05% 475 2.78% 54.30% 540<br />
Average 3.49% 68.09% 399 2.76% 54.00% 460 2.69% 52.47% 526 2.61% 50.91% 553<br />
Std Dev 0.09% 23 0.19% 19 0.18% 46 0.18% 28<br />
Cov 2.68% 5.64% 6.69% 4.04% 6.70% 8.73% 6.71% 4.98%<br />
66
Table G.21: Accelerated laboratory curing protocol for bitumen emulsion mixes (Draft)<br />
Active Filler Type<br />
Accelerated Lab Curing Protocol for Emulsion Binder Briquettes<br />
After Compaction Unsealed for 20 hrs at 30 ◦ C Sealed for 24 hrs at 40 ◦ C Sealed for 24 hrs at 40 ◦ C<br />
Briquettes Moisture % OMC Mr (MPa) Moisture % OMC Mr (MPa) Moisture % OMC Mr (MPa) Moisture % OMC Mr (MPa)<br />
Briquette 1 3.62% 70.70% 383 2.83% 55.18% 450 2.72% 53.13% 2.64% 51.56% 539<br />
1% Lime Content Briquette 2 3.87% 75.59% 392 3.02% 58.92% 500 2.93% 57.23% 568 2.85% 55.66% 562<br />
Briquette 3 3.72% 72.66% 452 2.93% 57.17% 550 2.84% 55.47% 520 2.76% 53.91% 535<br />
Average 3.74% 72.98% 409 2.92% 57.09% 500 2.83% 55.27% 544 2.75% 53.71% 545<br />
Std Dev 0.13% 38 0.10% 50 0.11% 34 0.11% 15<br />
Cov 3.37% 9.17% 3.28% 10.00% 3.72% 6.24% 3.83% 2.67%<br />
Briquette 1 3.83% 74.80% 382 2.87% 56.07% 598 2.79% 54.49% 601 2.71% 52.93% 664<br />
1% Cement Content Briquette 2 3.78% 73.83% 384 2.82% 55.06% 540 2.73% 53.32% 638 2.65% 51.76% 640<br />
Briquette 3 3.80% 74.22% 461 2.91% 56.91% 561 2.83% 55.27% 563 2.74% 53.52% 664<br />
Average 3.80% 74.28% 409 2.87% 56.02% 566 2.78% 54.36% 601 2.70% 52.73% 664<br />
Std Dev 0.03% 45 0.05% 29 0.05% 38 0.05% 14<br />
Cov 0.66% 11.01% 1.66% 5.19% 1.81% 6.24% 1.70% 2.09%<br />
Briquette 1 3.80% 74.22% 375 2.66% 51.99% 498 2.57% 50.20% 544 2.49% 48.63% 539<br />
No Active Filler Briquette 2 3.82% 74.61% 376 2.77% 54.00% 511 2.68% 52.34% 568 2.60% 50.78% 562<br />
Briquette 3 3.86% 75.39% 375 3.04% 59.34% 517 2.95% 57.62% 520 2.87% 56.05% 535<br />
Average 3.83% 74.74% 375 2.82% 55.11% 509 2.73% 53.39% 544 2.65% 51.82% 545<br />
Std Dev 0.03% 1 0.19% 10 0.20% 24 0.20% 15<br />
Cov 0.80% 0.15% 6.89% 1.91% 7.15% 4.41% 7.37% 2.67%<br />
67
Accelerated Laboratory Curing Protocol for Emulsion <strong>Mix</strong>es<br />
Lime Cem No Active Filler<br />
Lime Regression Model Cem Regression Model No Filler Regression Model<br />
Pow er (Lime Regression Model) Pow er (Cem Regression Model) Pow er (No Filler Regression Model)<br />
700<br />
650<br />
74.28 %OMC<br />
72.98 %OMC<br />
74.74 %OMC<br />
56.02 %OMC<br />
57.09 %OMC<br />
55.11 %OMC<br />
54.36 %OMC<br />
55.27 %OMC<br />
53.39 %OMC<br />
52.73 %OMC<br />
53.71 %OMC<br />
51.82 %OMC<br />
600<br />
550<br />
Mr (MPa)<br />
500<br />
450<br />
400<br />
350<br />
Unsealed for 12<br />
hours at 30°C<br />
Sealed for 24 hours<br />
at 40°C<br />
Change of bags to release<br />
excess moisture<br />
Sealed for 24 hours<br />
at 40°C<br />
300<br />
0 2 4 6 8 1012141618202224262830323436384042444648505254565860626466687072<br />
Curing Time (Hrs)<br />
Figure G.39 Accelerated Lab Curing Protocol for Emulsion mixes (Draft)–Resilient Properties versus % OMC relative to curing hours<br />
68
Accelerated Laboratory Curing Protocol for Foam <strong>Mix</strong>es<br />
Lime Cem No Active Filler<br />
Lime Regression Model Cem Regression Model No Filler Regression Model<br />
Pow er (Lime Regression Model) Pow er (Cem Regression Model) Pow er (No Filler Regression Model)<br />
700<br />
650<br />
68.86 %OMC<br />
68.56 %OMC<br />
68%OMC<br />
56.88 %OMC<br />
58.98 %OMC<br />
54%OMC<br />
55.01 %OMC<br />
56.84 %OMC<br />
52.5%OMC<br />
53.39 %OMC<br />
55 86%OMC<br />
50.9%OMC<br />
600<br />
550<br />
Mr (MPa)<br />
500<br />
450<br />
400<br />
350<br />
Unsealed for 12<br />
hours at 30°C<br />
Sealed for 24<br />
hours at 40°C<br />
Change of bags to<br />
release excess moisture<br />
Sealed for 24<br />
hours at 40°C<br />
300<br />
0 2 4 6 8 10 12 14 16 18 20 22 24 26 28 30 32 34 36 38 40 42 44 46 48 50 52 54 56 58 60 62 64<br />
Curing Time (Hrs)<br />
Figure G.40 Accelerated Lab Curing Protocol for Foamed mixes (Draft)–Resilient Properties versus %OMC relative to curing hours<br />
69
Accelerated Laboratory Curing Protocol for Foam <strong>Mix</strong>es<br />
900<br />
800<br />
Lab: Cem Foam (MTS)<br />
Lab: Lime Foam (MTS)<br />
Lab: No Filler Foam (MTS)<br />
Field: Cem - Foam Section (CSIR-PSPA)<br />
Field Mr Data Reduced by Factor of 10<br />
Time Scale: 18 months has been superimposed over 60 hrs of lab<br />
700<br />
68.86 %OMC<br />
56.88 %OMC<br />
55.01 %OMC<br />
53.39 %OMC<br />
Mr (MPa)<br />
600<br />
68.56 %OMC<br />
68.09 %OMC<br />
58.98 %OMC<br />
54.00 %OMC<br />
56.84 %OMC<br />
52.47 %OMC<br />
55.86%OMC<br />
50.91 %OMC<br />
500<br />
400<br />
Unsealed for 12<br />
hours at 30°C<br />
Sealed for 24<br />
hours at 40°C<br />
Change of bags to release<br />
excess moisture<br />
Sealed for 24<br />
hours at 40°C<br />
300<br />
0 2 4 6 8 10 12 14 16 18 20 22 24 26 28 30 32 34 36 38 40 42 44 46 48 50 52 54 56 58 60 62 64<br />
Curing Time (Hrs)<br />
Figure G.41 Accelerated Lab Curing Protocol for Foamed mixes (Draft)–Resilient Properties versus %OMC relative to curing hours<br />
70
5.3.3 Discussion of Laboratory Trends<br />
Accelerated laboratory protocol was fabricated for both emulsion and foamed binder mixes. Furthermore,<br />
target moisture contents of 55%OMC were achieved, with the majority of specimens reflecting final<br />
moisture contents of 55%OMC-50%OMC.<br />
The variability in the results was mainly influenced by the application of active filler (cement and lime) in<br />
test briquettes. Active filler had strong effects on laboratory stiffness performance, whilst the influence on<br />
moisture trends was minimal but consistent.<br />
In terms of active filler influences on laboratory moisture contents, the following observations were made:<br />
• Firstly, both foamed and emulsion binder types treated with lime as active filler retained the highest<br />
moisture contents at the end of curing, for the same curing conditions as cement and non active filler<br />
treated briquettes.<br />
Foam binder briquettes treated with lime showed 13.97% moisture decrease in the first 12 hours<br />
when compared with cement treated and non active filler briquettes.<br />
For the case of emulsion binder briquettes types, lime treated briquettes showed 21.98% moisture<br />
decrease in the first 20 hours when compared with cement and non active filler treated briquettes.<br />
• Secondly, cement treated materials retained the second highest moisture contents for both foamed<br />
and emulsion binder types when subject to similar curing conditions as lime and non active filler<br />
briquettes<br />
Foam binder briquettes treated with cement showed 17.4% moisture decrease in the first 12 hours<br />
when compared with lime treated and non active filler briquettes.<br />
71
For the case of emulsion binder briquettes types, cement treated briquettes showed 24.59% moisture<br />
decrease in the first 20 hours when compared with lime and non active filler treated briquettes.<br />
• Thirdly, non active filler treated materials retained the lowest moisture contents for both foamed and<br />
emulsion binder types when subject to similar conditions as lime and cement treated briquettes.<br />
Foam binder briquettes with no active filler showed 20.69% moisture decrease in the first 12 hours<br />
when compared with lime and cement treated briquettes.<br />
For the case of emulsion binder briquettes types, no active filler briquettes showed 26.26% moisture<br />
decrease in the first 20 hours when compared with cement and lime treated briquettes.<br />
Generally observations showed that foam mixes cured at a much faster rate when compared to emulsion<br />
mixes under 30 degrees unsealed conditions. The breaking of emulsion in the initial curing phase seems<br />
to slow down moisture extraction.<br />
72
5.3.4 Discussion of Synthesis<br />
Accelerated Laboratory Curing Protocol for Foam <strong>Mix</strong>es<br />
900<br />
800<br />
Lab: Cem Foam (MTS)<br />
Lab: Lime Foam (MTS)<br />
Lab: No Filler Foam (MTS)<br />
Field: Cem - Foam Section (CSIR-PSPA)<br />
Field Mr Data Reduced by Factor of 10<br />
Time Scale: 18 months has been superimposed over 60 hrs of lab cure<br />
700<br />
68.86 %OMC<br />
56.88 %OMC<br />
55.01 %OMC<br />
Mr (MPa)<br />
600<br />
68.56 %OMC<br />
68.09 %OMC<br />
58.98 %OMC<br />
54.00 %OMC<br />
56.84 %OMC<br />
52.47 %OMC<br />
500<br />
400<br />
Unsealed for 12<br />
hours at 30°C<br />
Sealed for 24<br />
hours at 40°C<br />
Change of bags to release<br />
excess moisture<br />
Sealed for 24<br />
hours at 40°C<br />
300<br />
0 2 4 6 8 10121416182022242628303234363840424446485052545<br />
Curing Time (Hrs)<br />
Figure G.42 Accelerated Lab Curing Protocol for Foamed mixes (Draft)–Resilient Properties versus %OMC<br />
relative to curing hours<br />
• As observed from above Figure foam briquettes were cured for ±12 hours at 30 ◦ C unsealed. Stiffness<br />
was measured at both 0 hours and 12 hours.<br />
• Briquettes were then sealed at 40 ◦ C for a further 24 hours (Total hours: 36 hours). Bags were changed<br />
to help released moisture and stiffness measurements were also taken.<br />
• Briquettes were then sealed at 40 ◦ C for the last 24 hours (Total hours: 60 hours). At the end of 68<br />
hours, final stiffness measurements were taken. Also, final moisture samples were taken as well (oven<br />
dried samples).<br />
• For simplistic comparison reasons, CSIR foam section stiffness PSPA data was reduced by factor of 10.<br />
For comparison reasons, the curve was plotted on the same scale as laboratory trends in Figure 0.42.<br />
73
Note that the CSIR trend line should be compared to laboratory foam binder cement treated briquettes<br />
(red trend line).<br />
Evidently, both laboratory trends (red line) and field trends have been successfully reconciled.<br />
74
Accelerated Laboratory Curing Protocol for Emulsion <strong>Mix</strong>es<br />
Lime Cem No Active Filler<br />
Lime Regression Model Cem Regression Model No Filler Regression Model<br />
Pow er (Lime Regression Model) Pow er (Cem Regression Model) Pow er (No Filler Regression Model)<br />
700<br />
650<br />
600<br />
74.28 %OMC<br />
72.98 %OMC<br />
74.74<br />
%OMC<br />
56.02 %OMC<br />
57 09 %OMC<br />
55.11<br />
54.36 %OMC<br />
55.27 %OMC<br />
53.39 %OMC<br />
53 71 %OMC<br />
52.73 %OMC<br />
51.82<br />
550<br />
Mr (MPa)<br />
500<br />
450<br />
400<br />
350<br />
Unsealed for 20<br />
hours at 30°C<br />
Sealed for 24<br />
hours at 40°C<br />
Change of bags to<br />
release excess moisture<br />
Sealed for 24<br />
hours at 40°C<br />
300<br />
0 2 4 6 8 1012141618202224262830323436384042444648505254565860626466687072<br />
Curing Time (Hrs)<br />
75
• As observed from above Figure, emulsion briquettes were cured for ±20 hours at 30 ◦ C unsealed.<br />
Stiffness was measured at both 0 hours and 20 hours.<br />
• Briquettes were then sealed at 40 ◦ C for a further 24 hours (Total hours: 44 hours). Bags were changed<br />
to help released moisture and stiffness measurements were also taken.<br />
• Briquettes were then sealed at 40 ◦ C for the last 24 hours (Total hours: 68 hours). At the end of 68<br />
hours, final stiffness measurements were taken. Also, final moisture samples were taken as well (oven<br />
dried samples).<br />
5.3.5 Final Validated Accelerated Laboratory Curing Protocol<br />
During construction of the N7, construction spec for BSM requires that at least 50 %OMC to be achieved in<br />
the ETB layer (field) prior to application of HMA. To date, the top 100 mm of the ETB layer reached 45<br />
%OMC after 8 months.<br />
However, moisture samples were extracted at 230 mm depth to help measure actual moisture samples at<br />
these depths. Following the above, curing experimentation as outlined in chapter 5.3 has mainly served the<br />
lower 230 mm of the ETB layer.<br />
Following strict requirements by the industry, it was decided that final accelerated curing protocol need to<br />
produce laboratory samples resembling the top 100 mm of the cured ETB layer as reflective of field<br />
conditions.<br />
This intervention was taken following concerns by the industry that most fabricated laboratory protocols<br />
produced rather wet samples which resembled lower strength results under various strength tests.<br />
Following the above, laboratory samples were further cured to aim for the 45 %OMC as reflective of field<br />
conditions at the top layer of ETB (100 mm depth).<br />
Foamed Bitumen <strong>Mix</strong>es<br />
Accelerated Laboratory Curing Procedure For Foamed Bitumen <strong>Mix</strong>es<br />
Simulated Field<br />
Without Active Filler With Active Filler Laboratory Handling Curing Conditions<br />
20 hours at 30°C : 20 hours at 30°C :<br />
Cure in draft oven no later than<br />
Unsealed<br />
Unsealed<br />
2 hours after compaction<br />
Replace wet plastic bags (2x volume of<br />
specimen)<br />
48 hours at 40°C : Sealed 72 hours at 40°C : Sealed With dry ones at every 24 hours interval 12 Months<br />
Using the above curing protocol for foamed bitumen mixes and field benchmark of 45 %OMC, the following<br />
laboratory final moisture contents were achievable:<br />
Final Laboratory Moisture Contents – Without Filler<br />
Final Laboratory Moisture Contents – With Active Filler<br />
: 43.6%OMC<br />
: 45.6%OMC<br />
76
Bitumen Emulsion <strong>Mix</strong>es<br />
Accelerated Laboratory Curing Procedure For Bitumen Emulsion <strong>Mix</strong>es<br />
Without Active Filler With Active Filler Laboratory Handling<br />
26 hours at 30°C : 26 hours at 30°C :<br />
Cure in draft oven no later than<br />
Unsealed<br />
Unsealed<br />
Simulated Field<br />
Curing<br />
Conditions<br />
2 hours after compaction<br />
Replace wet plastic bags (2x volume of<br />
specimen)<br />
48 hours at 40°C : Sealed 72 hours at 40°C : Sealed With dry ones at every 24 hours interval 12 Months<br />
Using the above curing protocol for bitumen emulsion mixes and field benchmark of 45 %OMC, the<br />
laboratory final moisture contents were achievable:<br />
Final Laboratory Moisture Contents – Without Filler : 43.3%OMC<br />
Final Laboratory Moisture Contents – With Active Filler : 46.5%OMC<br />
77
6. REFERENCES<br />
Acott, S. M., 1980. The stabilisation of a sand by foamed bitumen – A laboratory and field performance<br />
study. Dissertation for Master of Science in Engineering. University of Natal.<br />
Arema committee-1sub committee no. 2-ballast, 1998. Suggested <strong>Guidelines</strong> for Hot <strong>Mix</strong> Asphalt (HMA)<br />
Underlayment.<br />
Asphalt Academy, 2002. TG 2: The design and use of foamed bitumen treated materials. Pretoria, South<br />
Africa, 2002.<br />
Asphalt Institute, 1992. A Basic Asphalt Emulsion Manual. Manual Series No 19, Second Edition. Lexington,<br />
USA. Pp 87<br />
Bondietti, M., Murphy, D., Jenkins, K. and Burger, A., 2004. Research on the stabilisation of two different<br />
materials using bitumen emulsion and cement. Proceedings of the 8th Conference on Asphalt Pavements for<br />
Southern Africa (CAPSA’04). Sun City, South Africa.<br />
Bowering, R. H. and Martin, C. L., 1976. Foamed Bitumen Production and Application of <strong>Mix</strong>tures evaluation<br />
and Performance of Pavements. Proceedings, Association of Asphalt Paving Technologists Volume 45. New<br />
Orleans, Louisiana. Pp 453-477.<br />
Bowering, R. H., 1970. Upgrading Marginal Road Building <strong>Materials</strong> with Foamed Asphalt. Highway<br />
Engineering in Australia. Mobil Oil of Australia, Melbourne South.<br />
Brown, S. F. and Needham, D., 2000. A study of Cement Modified Bitumen Emulsion <strong>Mix</strong>tures. Proceedings<br />
Association of Asphalt Pavement Technologist, Reno, Nevada Vol. 69, Pp 92-121.<br />
Brown, S. F. and Gibb, J. M. Effects of Compaction on Mechanical Properties of Asphalt <strong>Mix</strong>tures.<br />
Proceedings of the 7th Conference on Asphalt Pavements for Southern Africa, 1999.<br />
Houston, M. and Long, F. M., 2004. Correlations between different ITS and UCS test protocols for foamed<br />
bitumen treated materials. Proceedings of the 8th Conference on Asphalt Pavements for Southern Africa<br />
(CAPSA’04). Sun City, South Africa.<br />
Hunter, A. E, Airey, G. D, Collop, A. C. Influence of Compaction Method on Asphalt <strong>Mix</strong>ture Internal Structure<br />
and Mechanical Properties. 3rd Euroasphalt & Eurobitume Congress, Vienna, 2004.<br />
Jack N. Dybalski, 1981. A comparison of Properties of laboratory prepared Cold <strong>Mix</strong>es Emulsified and Hot<br />
<strong>Mix</strong>ed Asphalt <strong>Mix</strong>tures. Presented at the 9th Annual Meeting of the Asphalt Emulsion Manufacturers<br />
Association March 17-18 1982 Las Vegas, Nevada.<br />
Jenkins, K. J., 2000. <strong>Mix</strong> <strong>Design</strong> Considerations for Cold and Half-warm <strong>Bituminous</strong> <strong>Mix</strong>es with Emphasis on<br />
Foamed Bitumen. PhD Dissertation, University of Stellenbosch, South Africa.<br />
Kekwick, S. V., 2005. Best Practice: Bitumen-Emulsion and Foamed Bitumen <strong>Materials</strong> Laboratory Processing.<br />
South African Transport Convention SATC, Pretoria<br />
78
Kekwick, S. V., 2004. Accelerated Laboratory Curing of Bitumen-Emulsion and Foamed Treated Specimens:<br />
Review of Current Practice. South African Transport Convention SATC, Pretoria<br />
Lancaster, J., McArthur, L. and Warwick, R., 1994. VICROADS Experience with Foamed Bitumen Stabilisation.<br />
Proceedings 17th ARRB Conference Part 3. Australia. Pp 193-211<br />
Lee, D. Y., 1981. Treating Marginal Aggregates and Soils with Foamed Asphalt. Association of Asphalt Paving<br />
Technologists Volume 50. Pp 211-250<br />
Little, D. N., Button, J. W. and Epps, J. A., 1983. Structural Properties of Laboratory <strong>Mix</strong>tures Containing<br />
Foamed Asphalt and Marginal Aggregates. Transportation Research Record 911. Pp 104-113<br />
Loizos, A and Papavasiliou, V, 2007. Assessment of In-Situ CIPR Performance using the Foam Asphalt<br />
Technique. International Conference on Advanced Characterisation of Pavement and Soil Engineering<br />
<strong>Materials</strong>. Athens, Greece.<br />
Long, F. M. and Theyse, H. L., 2004, Mechanistic Empirical Structural <strong>Design</strong> Models for Foamed and<br />
Emulsified Bitumen Treated <strong>Materials</strong>. Proceedings of the 8th Conference on Asphalt Pavements for Southern<br />
Africa (CAPSA’04). Sun City, South Africa.<br />
Malubila, S. M., 2005. Curing of foamed bitumen mixes. M.Eng thesis University of Stellenbosch, South Africa.<br />
Maccarrone, S., 1994. Cold Asphalt as an Alternative to Hotmix. 9th AAPA International Asphalt Conference.<br />
Australia. Pp 19-24<br />
Maccarrone, S., Holleran G., Leonard, D. J. and Hey, S., 1994. Pavement Recycling using Foamed Bitumen.<br />
Proceedings 17th ARRb Conference Part 3. Australia. Pp 349-365<br />
Marais, C. P. and Tait, M. I., 1989. Pavements with Bitumen Emulsion Treated Bases: Proposed Material<br />
Specifications, <strong>Mix</strong> <strong>Design</strong> Criteria and Structural <strong>Design</strong> Procedures for southern African conditions. CAPSA<br />
’89, Swaziland<br />
Parsons R. L, Foster D. H, Cross A. S, 2001. Compaction and Settlement of Existing Embankment. University<br />
of Kansas, 2001.<br />
Poirier, J. E., Clarac, A., Ballie, M., and Thouret, D., 2004. Cold <strong>Mix</strong>es for Base and Wearing Courses. A<br />
survey of long term performance over eight years of use. Eurobitume and Euroasphalt Congress, Vienna,<br />
Paper 233.<br />
Potii, J. J., Lesueur, D. and Eckmann, B., 2002. Towards a rational mix design method for cold bituminous<br />
mixes. The Optel contribution. European Roads Review Special Issue, RGRA 2.<br />
Roberts, F. L., Engelbrecht, J. C. and Kennedy, T. W., 1984. Evaluation of Recycled <strong>Mix</strong>tures using Foamed<br />
Bitumen. Transportation Research Record 968. Pp 78-85.<br />
Ruckel, P. J., Acott, S. M. and Bowering, R. H., 1983. Foamed-Asphalt Paving <strong>Mix</strong>tures: Preparation of <strong>Design</strong><br />
<strong>Mix</strong>es and Treatment of Test Specimens. Transportation Research Record 911. Pp 88-95.<br />
Saleh, M. F., 2004. New Zealand Experience with Foamed Bitumen Stabilisation. Annual TRB Meeting,<br />
Washington USA.<br />
79
Serfass, J. P., Poirier, J. E., Henrat, J. P. and Carbonneau, X., 2003. Influence of Curing on Cold <strong>Mix</strong><br />
Mechanical Performance. Performance Testing and Evaluation of <strong>Bituminous</strong> <strong>Materials</strong> PTEBM’03, 6th<br />
International Rilem Symposium, Zurich, Switzerland<br />
Shuler T. S, Huber G. A. Effect of Aggregate Size and Other Factors on Refusal Density of Asphalt Concrete<br />
by Vibratory Compaction. Effects of Aggregates and Mineral Fillers on Asphalt <strong>Mix</strong>ture Performance, ASTM<br />
STP 1147, American Society for Testing and <strong>Materials</strong>, Philadelphia, 1992.<br />
Wirtgen, 2004. Wirtgen Cold Recycling Manual. Wirtgen Publication, Windhagen Germany.<br />
Van Wijk, A.. and Wood, L. E., 1983. Use of Foamed Asphalt in Recycling of an Asphalt Pavement.<br />
Transportation Research Record 911. Pp96-103<br />
APPENDIX<br />
80
81