Developing Reliable Online Polls Nick Sparrow ... - ICM Research
Developing Reliable Online Polls Nick Sparrow ... - ICM Research
Developing Reliable Online Polls Nick Sparrow ... - ICM Research

You also want an ePaper? Increase the reach of your titles
YUMPU automatically turns print PDFs into web optimized ePapers that Google loves.
MRS Silver Medal<br />
Winner: <strong>Nick</strong> <strong>Sparrow</strong><br />
<strong>Developing</strong> reliable online polls - IJMR vol 48, issue 6<br />
What the judges said:<br />
This paper raises important issues about the way in which online surveys are<br />
administered and the motivations of online respondents. It demonstrates some<br />
major differences between results of online and conventional surveys, and<br />
suggests that the mode of interview is a significant explanatory factor.<br />
The judges selected this paper as the Silver Medal winner, because of the<br />
importance of the issues it raises for the online research industry and the valuable<br />
insights it provides.<br />
<strong>Developing</strong> <strong>Reliable</strong> <strong>Online</strong> <strong>Polls</strong><br />
<strong>Nick</strong> <strong>Sparrow</strong><br />
Published:<br />
International Journal of Market <strong>Research</strong>
<strong>Nick</strong> <strong>Sparrow</strong> 1<br />
ABSTRACT<br />
Based on their success at predicting the outcome of elections opinion polls are used by<br />
the media, government and the political parties to measure public attitudes to a very<br />
wide range of other issues, helping to shape policy proposals and inform debate.<br />
Despite their importance within the political process, the media, political parties and<br />
pressure groups nevertheless want feedback from opinion polls quickly and cheaply.<br />
Large scale random probability surveys may provide the best quality data but fail<br />
miserably on speed and cost.<br />
Among practical survey methods the telephone has become the most commonly used<br />
mode of interview for general population opinion polls despite some doubts over<br />
response rates. <strong>Online</strong> polls have an increasing share of the market, despite the<br />
obvious drawbacks of relatively low internet penetration and the fact that they rely on<br />
panels of willing participants.<br />
This paper shows that while telephone polls produce answers that are similar to those<br />
obtained from large scale random surveys there are sharp differences in results<br />
obtained online. The paper shows that these differences cannot be removed by<br />
weighting by demographics, newspaper readership or by using attitudinal variables.<br />
The research does, however, uncover evidence of significant and disturbing mode<br />
effects. In particular, a growing army of professional online panel members seem to<br />
race through online surveys, giving responses that explain a good measure of the<br />
differences between online and telephone research. These findings suggest that the<br />
online research industry needs to devise methods to ensure online respondents<br />
carefully consider the answers they give and design questions and answer codes that<br />
do not inadvertently lead online respondents to certain answers.<br />
1 <strong>Nick</strong> <strong>Sparrow</strong> is Managing Director of <strong>ICM</strong> <strong>Research</strong> and has worked as an opinion pollster since<br />
1980 on behalf of The Guardian, BBC, Conservative party and others. He sat on the MRS<br />
committee investigating the failure of the polls in the 1992 election and was subsequently<br />
awarded the Silver Medal for a paper (see bibliography) explaining methods to improve the<br />
accuracy of polls which ultimately led to the most accurate predictions made by the polls in both<br />
the 1997 and 2001 elections.
RESEARCH METHOD<br />
In November 2005 <strong>ICM</strong> conducted two separate research studies, one on issues<br />
surrounding crime and punishment and the other including questions on taxation and<br />
government spending. In both cases the questions were asked simultaneously online<br />
and by telephone among samples of around 1,000 people. The results obtained have<br />
been weighted to be representative of all adults by a range of demographic and<br />
consumption variables and by recall of votes cast at the last election.<br />
The online survey was conducted among members of the <strong>ICM</strong> online panel<br />
(www.itsyourview.com) who were initially recruited via a mix of online advertising and<br />
active recruitment of respondents on other conventional surveys conducted by <strong>ICM</strong><br />
both by telephone and face-to-face. This mirrors the recruitment practices of other<br />
specialist online research organisations except that a rather higher proportion of <strong>ICM</strong><br />
respondents are actively recruited. For the telephone survey, random numbers were<br />
dialled using the British Telecom database of all numbers with a random number<br />
substituted for the last digit.<br />
In February 2006 250 people drawn from each of the original online surveys were recontacted<br />
by telephone and a selection of questions were asked again, allowing<br />
comparison between their original online responses and those collected from the same<br />
people by telephone.<br />
Sample details are provided in appendix 1<br />
SAMPLING<br />
Telephone research using random digit dialling results in successful interviews in 20-<br />
25% of households contacted. On each successful call efforts are made to interview<br />
men and either younger or older people as experience suggests the sample will<br />
otherwise contain too few such people. How can we be at all sure that this simple<br />
method, with so few quota controls will provide an accurate distribution of the attitudes<br />
of all adults across a range of topics?<br />
First, we can compare the un-weighted results obtained by this simple method with<br />
Census data updated by the latest National Readership Survey (NRS). Table 1 below<br />
shows that, on a range of demographic and lifestyle variables, telephone research<br />
conducted in this way provides a reasonable distribution of the adult population.
Table 1. Comparison of Unweighted telephone survey data with NRS<br />
Unweighted Census/NRS Unweighted Census/NRS<br />
Sex Tenure<br />
Male 44* 48 Own house 28* 32<br />
Female 56 52 Mortgage 36* 41<br />
Age Council/HA 17 15<br />
18-24 9 11 Other 18* 12<br />
25-34 16 17 Foreign Holidays in last 3 years<br />
35-44 21 20 Yes 61 62<br />
45-54 19 17 No 39 38<br />
55-64 15 15 Cars in Household<br />
65+ 20 20 0 22 20<br />
Class 1 45 43<br />
AB 29* 25 2 25 28<br />
C1 22* 29 3+ 8 8<br />
C2 18 21<br />
DE 31* 25 Terminal Education age<br />
Work Status Up to 15 23 24<br />
Work Full<br />
time<br />
41 44 16-18 46 48<br />
Part time<br />
work<br />
14* 11 19+ 25* 20<br />
Retired 25 25<br />
Other 20 20<br />
<strong>ICM</strong> Data taken from all telephone Omnibus surveys September-November 2005<br />
* = Statistically significant differences at 95% confidence level<br />
An internet panel recruited via advertisements placed on the internet tends is heavily<br />
biased towards younger, more affluent sections of the population. Special efforts have<br />
to be made to create demographic balance. Having such information on file means that<br />
a representative sample can be drawn from the database and asked to participate in an<br />
opinion poll. Results may be weighted in exactly the same way as a telephone poll.<br />
(For all analysis in this paper, weights applied are as set out in appendix 1 unless<br />
otherwise specified)<br />
The implicit assumption underlying any online or telephone poll might be that<br />
demographic balance is all that is required to ensure that answers to other attitudinal<br />
questions also reflect the views of all adults. To test this hypothesis <strong>ICM</strong> included<br />
attitudinal questions on the test surveys drawn from authoritative random probability<br />
surveys.<br />
The latest British Crime Survey suggests that 43% of adults are confident that the<br />
Criminal Justice System is effective in bringing people who commit crimes to justice.<br />
The equivalent figure derived from the telephone survey was 46% while the online<br />
survey suggests a figure of 29%.<br />
Two questions were included in the second test survey taken from the British Social<br />
Attitudes Survey. In the telephone research <strong>ICM</strong> found that 71% thought the gap<br />
between rich and poor people is too large, BSA found 73%. The online survey suggests<br />
a figure of 82%.<br />
A further question asked respondents to say how comfortably off they feel. Here there<br />
are differences between the telephone survey and BSA. On the telephone survey 29%<br />
agreed that they were “living comfortably on present income” while BSA found 40%.
However, the online survey suggests a much lower percentage, that only 16% of<br />
people feel they are living comfortably on present income.<br />
These comparisons mirror the findings of earlier research showing a reasonably close<br />
match between random probability surveys and telephone polls and where differences<br />
do exist, they are less than those observed in comparisons between online and random<br />
surveys. (see Curtice and <strong>Sparrow</strong> 2004)<br />
Clearly our online surveys, weighted to the demographic profile of all adults yield<br />
different results and tell a different story to the telephone research and other<br />
authoritative survey sources.
RESULTS<br />
A full list of the questions asked is shown in appendix 2. Tables 2 and 3 below show<br />
the headline findings, both in terms of the percentage agreeing with each question and<br />
the net scores (i.e percent agreeing less percent disagreeing). The tables show that on<br />
some questions the results are reasonably close while others are very different.<br />
Table 2. Telephone and <strong>Online</strong> results. Crime and punishment<br />
Phone <strong>Online</strong><br />
Percent Net score Percent Net score<br />
agree<br />
agree<br />
% % % %<br />
Q1. Worried 46 -8 52* 4<br />
Q2. Felt threatened in last<br />
year<br />
20 -60 32* -36<br />
Q3. Been a victim of assault 11 - 15* -<br />
Q3. Been a victim of Burglary 10 - 13* -<br />
Q3. Been a victim of car<br />
crime<br />
16 - 23* -<br />
Q4. Approve of guns for<br />
police<br />
46 -3 43 0<br />
Q5. Confident in Criminal<br />
justice system (BCS<br />
Question)<br />
46 -7 29* -40<br />
Q6. Courts too soft 70 69 84* 82<br />
Q7. Sentences should be<br />
served in full<br />
71 44 80* 62<br />
Q8. Life should mean life 79 67 84 78<br />
Q9. Capital punishment for<br />
child murders<br />
64 38 61 38<br />
Q9. … for Police murders 64 38 57* 33<br />
Q9. … for all murders 55 22 47* 16<br />
Q10. Agree with capital<br />
punishment, an eye for an<br />
eye<br />
46 -1 54* 21<br />
Q11. Death penalty is a<br />
deterrent<br />
38 -18 43* -1<br />
Q12. Muggers should be<br />
spared prison<br />
36 -14 16* -53<br />
Q13. Approve of tagging 57 20 38* -4<br />
6 Significant differences between online and telephone survey<br />
Bold (Q5) question also asked on British Crime Survey
Table 3. Telephone and <strong>Online</strong> results. Tax and spend<br />
Telephone <strong>Online</strong><br />
Percent Net Percent Net Score<br />
agree score agree<br />
% % % %<br />
Q1. Taxes higher in 5 years 78 73 77 75<br />
Q2 real improvements in<br />
NHS<br />
33 -28 24* -38<br />
Q3 Real improvements in<br />
schools<br />
35 -15 23* -34<br />
Q4. Govt could cut tax and<br />
improve services<br />
69 42 70 57<br />
Q5. If taxes cut economy<br />
will grow thereby benefiting<br />
public services<br />
57 19 52* 27<br />
Q6 Extend Government<br />
services<br />
49 33 44* 24<br />
Q7. Brown is prudent 41 -10 30* -22<br />
Q8. Gap between rich<br />
and poor too large (BSA<br />
question)<br />
71 65 82* 81<br />
Q9. Comfortable on<br />
current income (BSA<br />
question)<br />
29 1 16* 0<br />
Q10, Economic optimism 26 -1 23 -14<br />
6 Significant differences between online and telephone surveys.<br />
Bold (Q8 and 9) also asked on British Social Attitudes survey<br />
Comparison of the data shows up some obvious mode effects. On both the telephone<br />
and online surveys response codes were offered to respondents in the same order.<br />
However while don’t know and refuse alternatives appeared on screen they were not<br />
offered to those answering by telephone. As a result online respondents were, on<br />
average over twice as likely to click on a “don’t know” or “refuse” response. On<br />
average these two options were used by 3.6% of telephone respondents and 8.5% of<br />
online respondents. <strong>Online</strong> respondents were Also a little less likely to choose mid<br />
point options where offered. Neither of these factors adequately explain the differences<br />
observed between the two methods. If don’t knows are excluded from the base on<br />
both surveys the average discrepancy in results between online and telephone<br />
increases from 8.1% to 8.5%.<br />
These results may not surprise some online researchers who have long accepted that<br />
demographic weighting is insufficient to make an online poll match results obtained by<br />
other research methods. One solution, practiced by YouGov is weight by newspaper<br />
readership as an indicator of attitudes more generally. Another route has been to<br />
isolate key attitudinal variables across a range of issues and use these as weighting<br />
variables.
ADDITIONAL WEIGHTING<br />
NEWSPAPER READERSHIP<br />
In the “Tax and Spend” surveys <strong>ICM</strong> added a newspaper readership question to both<br />
the telephone and online survey. Both interview methods produce similar patterns of<br />
newspaper readership, are similar to those YouGov find and all are different to the data<br />
produced by NRS. This perhaps reflects the fact that NRS asks about all newspapers<br />
read “yesterday” for 2 minutes or more while the <strong>ICM</strong> and Yougov questions ask about<br />
first choice newspapers or paper read most often. For NRS the base on which the<br />
percentages are calculated is all newspapers read yesterday (i.e allowing for the fact<br />
that some people read more than one paper) whereas the base of the <strong>ICM</strong>/Yougov<br />
question is the total sample of people interviewed.<br />
Table 4. Newspaper readership<br />
YouGov<br />
Unweighted**<br />
Telephone <strong>ICM</strong><br />
<strong>Online</strong><br />
Weighted<br />
to NRS<br />
derived<br />
data**<br />
% % % %<br />
Express/Mail 28 22 22 16*<br />
Sun/Star 14 17 17 22*<br />
Mirror/Record 11 10 8 16*<br />
Guardian/Independent 7 8 8 4*<br />
FT/Times/Telegraph 11 13 13 9*<br />
Other 11 18 13 13*<br />
None 19 11 19 20*<br />
* Significant differences between NRS and all other surveys in columns above<br />
**YouGov unweighted data taken from poll for Daily Telegraph, Fieldwork 22 nd -24 th<br />
November 2005. Sample 2,616. Weights for this poll also used<br />
This data suggests that the difference we can observe between NRS on the one hand<br />
and telephone and online surveys on the other arises because the questions are<br />
fundamentally different, not because the samples are not representative by newspaper<br />
readership, and hence calls into question whether weighting to NRS estimates can be<br />
justified at all.<br />
In the <strong>ICM</strong> survey the addition of this weighting had a small effect on vote intentions,<br />
bringing the online survey estimates more into line with the telephone survey.<br />
However, as table 5 below shows, newspaper readership weighting had little effect on<br />
the answers to other questions.
Table 5. Effect of Newspaper readership weighting<br />
Telephone <strong>Online</strong> <strong>Online</strong> plus<br />
newspaper<br />
readership<br />
1 2 3<br />
% % %<br />
Q1. Taxes higher in 5<br />
years<br />
78 77 76<br />
Q2 real improvements in<br />
NHS<br />
33 24 24<br />
Q3 Real improvements in<br />
schools<br />
35 23 24<br />
Q4. Govt could cut tax<br />
and improve services<br />
69 70 70<br />
Q5. If taxes cut economy<br />
will grow thereby<br />
benefiting public services<br />
57 52 53<br />
Q6 Extend Government<br />
services<br />
49 44 45<br />
Q7. Brown is prudent 41 30 30<br />
Q8. Gap between rich and<br />
poor too large<br />
71 82 83<br />
Q9. Comfortable on<br />
current income<br />
29 16 16<br />
Q10, Economic optimism 26 23 22<br />
Average difference 6.9 6.8<br />
WEIGHTING BY ATTITUDINAL VARIABLES<br />
Attitudinal weighting is likely to be most effective if the variables selected are directly<br />
linked to the topic of the survey.<br />
Crime and punishment survey.<br />
<strong>ICM</strong> experimented with weighting the online sample to the results of the telephone<br />
sample on the issue of capital punishment (see column 3 table 6) and alternatively by<br />
matching the online sample to the telephone sample on the question of whether<br />
respondents had felt threatened in the last year (see column 4 table 6). The rationale<br />
for choosing these two variables was that one might expect the issue of capital<br />
punishment to be something on which respondents would have fairly fixed pre-existing<br />
attitudes and therefore have links to a wider variety of questions on the issue of crime<br />
and punishment. Alternatively we reasoned that fear of crime might be important in<br />
determining attitudes to crime more generally and to policing and sentencing policies.<br />
Disappointingly the results of these experiments shows that matching the data on<br />
capital punishment brings the results of other capital punishment questions further into<br />
line with the telephone sample but has little or no effect on any other variables.<br />
Similarly matching the results on fear of crime brings the results on other questions on<br />
fear of crime and experience of crime into line but has no positive effects on the rest of<br />
the data. It is possible that some other attitudinal variable or combination variable may<br />
be more effective in bringing the two data sets into line, although it seems unlikely<br />
given the relevance of the variables chosen to subject area. Still less likely is the<br />
possibility that there are some other attitudinal variables on other subjects that would
prove more effective than attitudes on these particular topics. These experiments<br />
suggest there is little correlation between the views people even within the confines of<br />
these topic areas and therefore little chance that attitudinal weighting will bring the two<br />
data sets into line.<br />
Table 6. Telephone and <strong>Online</strong> poll comparisons using different weighting<br />
schemes<br />
Phone <strong>Online</strong> <strong>Online</strong> +<br />
death<br />
penalty<br />
<strong>Online</strong> +<br />
felt<br />
threatened<br />
1 2 3 4<br />
% % % %<br />
Q1. Worried 46 52 53 47*<br />
Q2. Felt threatened in last<br />
year<br />
20 32 33 20<br />
Q3. Been a victim of assault 11 15 17 12*<br />
Q3. Been a victim of Burglary 10 13 14 11*<br />
Q3. Been a victim of car<br />
crime<br />
16 23 24 21*<br />
Q4. Approve of guns for<br />
police<br />
46 43 47 42<br />
Q5. Confident in Criminal<br />
justice system<br />
46 29 28 31<br />
Q6. Courts too soft 70 84 84 83<br />
Q7. Sentences should be<br />
served in full<br />
71 80 81 80<br />
Q8. Life should mean life 79 84 84 84<br />
Q9. Capital punishment for<br />
child murders<br />
64 61 64* 60<br />
Q9. … for Police murders 64 57 61* 57<br />
Q9. … for all murders 55 47 55 47<br />
Q10. Agree with capital<br />
punishment, an eye for an<br />
eye<br />
46 54 59 54<br />
Q11. Death penalty is a<br />
deterrent<br />
38 43 47 42<br />
Q12. Muggers should be<br />
spared prison<br />
36 16 17 16<br />
Q13. Approve of tagging 57 38 39 38<br />
* Significant convergence with telephone sample, excluding attitudinal weighting<br />
variable itself<br />
Tax and spending survey<br />
On the tax and spend surveys, in addition to demographic weights, <strong>ICM</strong> matched the<br />
stated income levels of those interviewed online to the telephone sample. Further, <strong>ICM</strong><br />
experimented with attitudinal weighting, first by weighting the online results of Q2<br />
(agree or disagree that extra spending on the NHS has resulted in real improvements)<br />
to the results obtained in the telephone survey. As an alternative <strong>ICM</strong> matched the<br />
results to Q8 (gap between those on high incomes and those on low incomes too large,<br />
about right or too small) obtained on the online survey to those obtained by telephone.<br />
Table 4 shows that neither of these additional weights has a measurable effect in<br />
bringing the online data into line with the telephone survey.
Table 7. Telephone and online comparisons using attitudinal weights<br />
Telephone <strong>Online</strong> <strong>Online</strong><br />
plus<br />
income<br />
levels and<br />
Q2<br />
<strong>Online</strong><br />
plus<br />
income<br />
levels<br />
and Q8<br />
1 2 3 4<br />
% % % %<br />
Q1. Taxes higher in 5<br />
years<br />
78 77 76 75<br />
Q2 real improvements in<br />
NHS<br />
33 24 33 24<br />
Q3 Real improvements in<br />
schools<br />
35 23 25 23<br />
Q4. Govt could cut tax<br />
and improve services<br />
69 70 70 69<br />
Q5. If taxes cut economy<br />
will grow thereby<br />
benefiting public services<br />
57 52 51 49<br />
Q6 Extend Government<br />
services<br />
49 44 46 45<br />
Q7. Brown is prudent 41 30 32 31<br />
Q8. Gap between rich and<br />
poor too large<br />
71 (BSA 73) 82 82 70<br />
Q9. Comfortable on<br />
current income<br />
29 (BSA 40) 16 16 18<br />
Q10, Economic optimism 26 23 23 24<br />
Total difference 6.9 6.2 6.6<br />
No significant convergence of online to telephone survey as a result of attitudinal<br />
weighting
The main difficulty with the data is that the relationships one might expect to lie within<br />
the data sets do not exist. For example we find on the telephone survey that 73% of<br />
those who thought prison sentences should be served in full disapprove of muggers<br />
being spared a term in prison. <strong>Online</strong> only 52% fall into the same category. For<br />
attitudinal weighting to work we would require much more consistency is such<br />
relationships than we have found.<br />
Of course, these attitudinal weights have been devised with the benefit of having two<br />
complete data sets. In practice researchers would have to decide beforehand which<br />
variables are likely to be important and guess that those weighting variables will be<br />
correlated with all other questions in a survey.<br />
From these experiments it would seem unlikely that the use of other attitudinal<br />
variables even less closely connected with Crime, Punishment, taxation and spending<br />
would be more effective in bringing the two data sets into line.<br />
WHY?<br />
Results obtained from opinion polls are widely known to be sensitive to precise question<br />
wording and to question order. (see Bourdieu 1979, Zaller 1992, Herbst 1993 and<br />
Lewis 2001) It follows that results could also be sensitive to the mode by which the<br />
interview is obtained, the universe from which samples are drawn and any effects<br />
arising from the use of a panel of respondents paid for their participation in surveys.<br />
Could any of these factors explain the differences between telephone and online polls?<br />
1) The online population<br />
<strong>ICM</strong> have extracted from the telephone sample those with access to the internet and<br />
weighted those respondents to be representative of all adults. Having done so we get<br />
results that are very similar to those obtained from the whole telephone sample (i.e<br />
including non internet accessible respondents). The fact that only 65% or so of the<br />
population have access to the internet access is not itself, a factor that distorts<br />
responses to attitudinal questions. (see appendix 3)<br />
2) Mode effects<br />
To test for mode effects, <strong>ICM</strong> recontacted 500 people who had originally answered the<br />
questions online, 250 from each of the two test surveys. The recall interviews were<br />
conducted in February 2006, three months after the original interviews. Selected<br />
questions were repeated yielding the results in table 8 below. The results are<br />
astounding as they suggest that for many (although not all) questions a large element<br />
of the discrepancy between the online and telephone methods can be ascribed to mode<br />
effects. In table 8 columns 1 and 2 show the demographically weighted data from the<br />
original surveys conducted in 2005. Column 3 shows the original unweighted online<br />
responses from 250 people recontacted in February 2006 and column 4 shows their<br />
responses on the telephone obtained in February 2006.<br />
The data might be taken as proof that people give more socially acceptable responses<br />
when asked by an interviewer but say what they really think on-screen. People may,<br />
for example have far less confidence in the criminal justice system than they are<br />
prepared to divulge to an interviewer. But this does not explain the differences<br />
observed on more straightforward questions about the respondent’s own recent<br />
experiences such as whether they have felt threatened in the last year. Why should<br />
the results to that question asked by telephone be almost half the level recorded by the<br />
same people online?
Table 8. Recall interviews<br />
<strong>Online</strong> Phone Original Phone<br />
<strong>Online</strong> recall<br />
Crime and<br />
punishment<br />
1 2 3 4<br />
% % % %<br />
Q2. Felt threatened in<br />
last year<br />
32 20 34 18*<br />
Q5. Confident in<br />
Criminal justice system<br />
29 46 25 41*<br />
Q6. Courts too soft 84 70 87 74*<br />
Q7. Sentences should<br />
be served in full<br />
80 71 84 72*<br />
Q9. Capital<br />
punishment for all<br />
murders<br />
47 55 45 32<br />
Q12. Muggers should<br />
be spared prison<br />
16 36 13 24*<br />
Q13. Approve of<br />
tagging<br />
Tax and spend<br />
38 57 36 48*<br />
Q2 real improvements<br />
in NHS<br />
24 33 24 25<br />
Q3 Real improvements<br />
in schools<br />
23 35 21 26*<br />
Q4. Govt could cut tax<br />
and improve services<br />
70 69 74 82<br />
Q6 Extend<br />
Government services<br />
44 49 46 54*<br />
Q7. Brown is prudent 30 41 29 31<br />
Q8. Gap between rich<br />
and poor too large<br />
82 71 82 80<br />
Q9. Comfortable on<br />
current income<br />
16 29 16 24*<br />
* Significant convergence of views on original online respondents<br />
to the views of original telephone survey when asked questions by<br />
telephone<br />
On 9 out of 14 questions in the table above, the results of the recall interviews suggest<br />
that it is the mode of interview, rather than nature or outlook of the people interviewed<br />
that accounts for a good measure of the differences between the original telephone and<br />
online responses. The fact that there is no significant convergence on 5 questions<br />
suggests that mode of interview is a significant but not the only factor contributing to<br />
the difference observed between online and telephone polls.<br />
A wealth of comparative testing in the US by Don Dillman and others suggests that self<br />
completion questionnaire layout itself has a significant impact on the answers given.<br />
Even small design changes in the layout of answer codes result in substantially different<br />
answers. This is particularly true of online surveys which afford almost limitless<br />
possibilities for screen design and layout.<br />
For example, those answering online are shown possible response codes on screen and<br />
click on the most appropriate response. Each response code includes a box to be
clicked alongside the typed answer code. Thus respondents may choose responses by<br />
reference to the words, and/or on the position of the chosen code between two<br />
extremes. Other research shows relatively large differences in answers given<br />
depending on factors such as the size of the boxes used for written answers, lines<br />
separating don’t know/ refuse answers from other etc.<br />
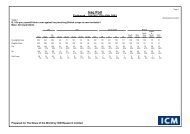
The research also finds discrepancies between the results obtained online and by<br />
telephone that arise out of the length of time respondents spend answering the<br />
questions. By telephone the survey took between 6 and 7 minutes to conduct with a<br />
very small number taking longer with people who had language or comprehension<br />
difficulties. For online interviews we recorded the total length of time each respondent<br />
spent answering the questions and have excluded those who suspended the interview<br />
and returned to it at a later time to complete the questions. The distribution is shown<br />
in chart 1 and includes only those with a broadband connection. On both surveys<br />
respondents took an average of 5.6-5-7 minutes to answer the questions online,<br />
around a minute less than those questioned by telephone. However, for the online<br />
surveys the chart shows a great degree of variation around the mean. <strong>Online</strong> 31%<br />
took less than 5 minutes to answer the crime and punishment questions and 44% took<br />
less than 5 minutes on the tax and spend questions.<br />
Length of time taken to complete on-<br />
line survey<br />
30<br />
25<br />
20<br />
15<br />
10<br />
5<br />
0<br />
1<br />
min<br />
3 4 5 6 7 8 9 10 11 12 13+<br />
Crime<br />
Tax<br />
If we compare the results obtained from the recall interviews with those originally given<br />
we see an average 10% shift in answers given by those who originally spent less than 4<br />
minutes answering the questions online, twice the shift observed among those who<br />
spent 6 minutes or more online.<br />
It could be argued that the length of time any respondent spends considering a<br />
question asked by telephone (or face to face) is regulated by the reading out process<br />
and by the length of time it would seem appropriate to any individual to consider their<br />
answer in this conversational environment. Long pauses for thought are unlikely as<br />
they will seem embarrassing or awkward. While some people obviously spend longer
online carefully considering their responses, it is also true that some answer very<br />
quickly and modify those responses to a much greater degree when asked the same<br />
questions again by telephone. Clearly differences between conventional research and<br />
online arising out of people considering their responses more carefully both explain<br />
differences and point to advantages for online options. But poor quality data may be<br />
obtained from people, perhaps motivated by the money they might earn, racing<br />
through online questions giving each little thought.<br />
Obviously any effects arising out of the way each question and answer code appears on<br />
screen is likely to be more noticeable among those who are expending as little time and<br />
energy as possible on the survey questions. Mode does indeed offer an explanation for<br />
the discrepancies between our two test surveys, but mode effects are clearly not<br />
limited only to the absence of an interviewer.<br />
3) Panel effects<br />
<strong>Research</strong> among people seeking to join the <strong>ICM</strong> online panel shows that just over half<br />
(52%) were motivated to join because they felt it would be an enjoyable way to earn<br />
money or enter prize draws In contrast 20% joined because they thought they would<br />
be interested in the topics covered and 19% enjoy answering questions. <strong>ICM</strong> found<br />
that 32% of people applying to join the panel already belong to 3 or more online<br />
panels. Just over half those aiming to join the <strong>ICM</strong> panel and belonging to other<br />
panels, reported that they were also registered with Ciao , 34% with YouGov and 30%<br />
with Lightspeed. The degree of overlap may however depend on where advertisements<br />
are placed for new members. <strong>Research</strong> by Comley of Virtual Surveys found three<br />
quarters of online panellists belong to three or more panels and 68% would like to<br />
complete on–line surveys at least “a few times a week”. Many of those in the industry<br />
concerned about panel conditioning and fatigue ignore the fact that for those looking to<br />
earn money from answering survey questions, it makes sense to use internet search<br />
engines to join several panels. The research suggest that a group of professional panel<br />
participants is emerging, who participate in online surveys for a number of different<br />
companies.<br />
Among those people who applied to join the <strong>ICM</strong> internet panel 72% said they would<br />
be more likely participate in surveys if the topic is of interest to them and, of course,<br />
online it is relatively easy to establish what each survey is about. In telephone surveys<br />
a more general introduction may be used (<strong>ICM</strong> say each survey is on subjects that<br />
affect all people), to avoid potential distortions arising because only interested people<br />
participate. Nevertheless when asked to choose between a more interesting survey<br />
that offers no reward and a less interesting survey with a £2 reward 80% opted for the<br />
latter, confirming that the desire to make money out of answering survey questions is<br />
the dominant motivation rather than a desire to register opinions.<br />
The possible emergence of a group of professional online panellists is somewhat<br />
worrying for the industry as these respondents may pick up tricks to ensure they<br />
complete more surveys and thereby earn more money. They may, for example work<br />
out that if they register as a relatively badly off pensioner, they will be asked to<br />
participate in more opinion polls, as most internet panels are short of such people.<br />
They may claim to own more products or use more services in the hope of being<br />
included in surveys aimed at particular ownership or user groups.<br />
Overall, the payment of incentives changes the relationship between the pollster and<br />
the respondents. An individual telephoned out of the blue and asked for their views do<br />
so simply to help us gauge the attitudes of voters generally. There is no other benefit
to them. An online panellist who wants to earn money is engaged in an exchange of<br />
time for money. In such a relationship the temptation is to expend as little time or<br />
mental energy as possible for the fee offered.<br />
Mode effect or panel effect?<br />
Some have argued that the absence of an interviewer means respondents can take<br />
their time thinking about their answers and will not feel inhibited in any way to record<br />
what they really think. The alternative hypothesis suggested by this research is that<br />
the presence of an interviewer regulates the length of time respondents can spend<br />
thinking about a question, as they cannot cut an interviewer short, and a long pause for<br />
reflection on the phone or face-to-face will seem awkward. Respondents are<br />
encouraged to concentrate on the question for the simple reason that may will not want<br />
to give answers the interviewer is likely to think are silly or inconsistent. <strong>Online</strong> there<br />
is no consequence for the respondent arising out of taking the most casual attitude to<br />
answering the questions. Each answer is accepted by the computer no matter what it<br />
is or how quickly it is entered and respondents are thanked at the end with the survey<br />
fee being added to their account. Rather than thinking more about how they feel on<br />
political and social issues the survey method encourages them to think less, and give<br />
knee jerk responses rather than more considered views. These tendencies are likely to<br />
be strongest among those motivated primarily by the chance to earn money or win<br />
prizes.<br />
IMPLICATIONS<br />
Comparisons between telephone and online polls represent a stern test of the<br />
methodologies. Voters in general may feel it would be time consuming for them to<br />
become informed on political and social issues and that any informed views they may<br />
develop would not make a jot of difference. Most therefore continue through life in a<br />
state of what Anthony Downs called “rational ignorance”, a semi-conscious choice not<br />
to expend energy on forming opinions that will make no difference to them or anyone<br />
else.<br />
Rational ignorance explains observations made by Mueller and others about opinion<br />
polls. Suddenly faced with probing questions on issues such as the operation of the<br />
criminal justice system and taxation and government spending, it may not be surprising<br />
to find some respondents “pontificating in a seemingly authoritative, if basically truthful<br />
manner on subjects about which they know nothing or to which they have never given<br />
any thought whatsoever" (Mueller 1973) In this context it is certainly possible to<br />
imagine that answers obtained from opinion polls are highly sensitive to the methods<br />
employed to gather the data.<br />
This paper nevertheless raises some important issues surrounding the way in which<br />
online surveys are administered and the motivations of those participating in online<br />
surveys.<br />
1) If the motivation of panel members is to earn money from participating in online<br />
surveys logic suggests respondents will expend as little energy as possible in<br />
order to earn the fee. We have found no evidence that leading online research<br />
companies deploy any method to regulate the time each respondent must spend<br />
on each question.<br />
2) A minimum quality standard should be to devise methods to ensure that panel<br />
members spend at least as much time looking at questions online as they<br />
would have to spend listening to an interviewer read them out. In some cases
espondents who then spend even more time considering their response may<br />
answer differently to those in any interviewer administered survey, and that<br />
deliberation may both change and improve data quality. At present no such<br />
claim could be made and indeed the opposite may apply<br />
3) It may also be possible to introduce simple check questions, to catch<br />
respondents who give contradictory answers, thereby proving they are not<br />
giving careful consideration to each question<br />
4) .Most online surveys are presented as typed questions and answer lists of the<br />
most basic format. Data quality may be enhanced by devising on-screen layouts<br />
that make questions easy to read and do not inadvertently encourage<br />
respondents towards certain answer codes. There are limitless possibilities, but<br />
experimentation may lead each company to devise a house style. Using that<br />
style will give answers to online surveys that are at least consistent with other<br />
research done by that same organisation.<br />
5) <strong>Online</strong> researchers must pay respondents appropriately for carefully considered<br />
answers. Nevertheless, response rates may suffer as some respondents find<br />
that online research is not the easy way to earn money they originally thought.<br />
The dilemma for the online research specialists is that they have, hitherto, sold online<br />
research as a cheaper alternative to traditional research methods. Even so some online<br />
researchers are concerned over a looming price war among online suppliers across<br />
Europe driving prices and profit margins even lower. The aim of sound research on the<br />
other hand suggests that online researchers should be investing more, in recruiting non<br />
professional panel members, in carefully considered and constructed web page question<br />
design and in paying panel members appropriately for carefully considered responses.
APPENDIX 1<br />
CRIME AND PUNISHMENT SURVEY<br />
<strong>Online</strong> survey completed between November 23 th and 24 th 2005 among 1,024 panel<br />
members. Interviews conducted throughout Great Britain.<br />
Telephone survey conducted between November 23 rd and 24 th 2005 among 1,026<br />
adults countrywide.<br />
Results to both surveys have been weighted to be representative of all adults by age,<br />
sex, social class, work status, tenure, foreign holidays taken in the last 3 year, car<br />
ownership, region and by <strong>ICM</strong> targets for a recall of past votes in the 2005 election.<br />
TAXATION AND SPENDING<br />
<strong>Online</strong> survey completed between November 30 th and December 1 st among 1,013<br />
panel members. Interviews conducted throughout Great Britain.<br />
Telephone survey conducted between November 30 th and December 1 st 2005 among<br />
1,013 adults countrywide.<br />
The unweighted and weighted profiles are shown in the table below<br />
Crime<br />
Telephone<br />
Crime<br />
<strong>Online</strong><br />
Tax and<br />
spend<br />
Telephone<br />
Tax and<br />
spend<br />
<strong>Online</strong><br />
Weighted<br />
to …..<br />
% % % % %<br />
Sex<br />
Male 44 51 41 48 48<br />
Female<br />
Age<br />
56 49 59 52 52<br />
18-34 26 30 23 27 30<br />
35-54 40 37 37 36 37<br />
55-64 15 14 15 17 14<br />
65+<br />
Work status<br />
18 19 20 21 19<br />
Work Full<br />
time<br />
44 37 45 32 45<br />
Part Time 14 13 11 13 11<br />
Not<br />
Working<br />
Tenure<br />
42 50 43 54 44<br />
Own Home 25 31 27 31 30<br />
Mortgage 40 39 37 38 42<br />
Council/HA 19 8 21 8 13<br />
Other 16 22 16 22 15<br />
Taken foreign holidays in last 3 years<br />
Yes 63 69 59 69 62<br />
No 37 31 41 31 38
APPENDIX 2<br />
CRIME AND PUNISHMENT QUESTIONS<br />
Q1. How worried would you say you are about being the victim of a crime? Would you<br />
say you are ……<br />
Very worried<br />
Fairly Worried<br />
Not very worried<br />
Not at all worried<br />
Q2. [British Crime Survey question] Has there been a time in the last year when you<br />
have felt your personal safety was threatened or that you would be a victim of crime?<br />
Yes<br />
No<br />
Q3. Over the course of the last 5 years or so, have you or anyone in your household<br />
been the victim of any of the following crimes …..<br />
Assault<br />
House burglary<br />
Theft of or from a car<br />
Q4. Would you approve or disapprove if it was decided that the police in this country<br />
should now routinely carry guns?<br />
Q5. [British Crime Survey question] This question is about the Criminal Justice System<br />
as a whole, that is the police, the Crown Prosecution Service, the Courts, prison and<br />
probation services. How confident are you that the Criminal Justice System is effective<br />
in bringing people who commit crimes to justice?<br />
Very Confident<br />
Fairly Confident<br />
Not very Confident<br />
Not at all Confident<br />
Q6. Overall, would you say sentences passed by the courts are too harsh, too soft or<br />
are they about right?<br />
Q7. Which of the following comes closest to your own view ….<br />
The prison sentences handed down by the courts should be served in full<br />
People serving prison sentences should be given early release on licence if they show<br />
they have reformed<br />
Q8. Specifically on life sentences some people say that if someone is given a life<br />
sentence by the courts that life should always mean life, with no chance of parole? Do<br />
you agree or disagree?<br />
Q9. Would you yourself approve or disapprove of the re-introduction of the death<br />
penalty for the murder of …..
Children<br />
On-duty policemen and women<br />
For all murders<br />
Q10. Which of the following two views comes closest to your own?<br />
People who commit murder should themselves face the death penalty, an eye for an<br />
eye<br />
The death penalty is state authorised murder, two wrongs don’t make a right<br />
Q11. In the past some people have been found guilty of murder only to be acquitted<br />
later. Examples include the four Irishmen found guilty of the Birmingham Pub<br />
bombings. Which of the following views comes closest to your own …..<br />
The death penalty is a necessary deterrent, the benefits outweigh the dangers<br />
The dangers of a wrongful conviction (and therefore hanging the wrong person)<br />
outweigh the deterrent value of the death penalty<br />
Q12 Do you approve or disapprove of new directions given to judges which states that<br />
a person convicted of a mugging should not be automatically be sent to prison<br />
Q13. As an alternative to prison for some types of crime, some people have suggested<br />
the greater use of curfews and electronic tagging as a means of punishing some<br />
criminals. Would you approve or disapprove of the greater use of curfews and<br />
electronic tagging<br />
TAXATION AND SPENDING QUESTIONS<br />
1. Do you think that overall taxes will be higher or lower at the end of this Parliament<br />
than they are now?<br />
Higher<br />
Lower<br />
Don’t know<br />
2. Do you agree or disagree that extra spending over the last few years has resulted in<br />
real improvements in the NHS.<br />
Agree<br />
Disagree<br />
3. And do you agree or disagree that extra spending over the last few years has<br />
resulted in real improvements in state schools.<br />
Agree<br />
Disagree<br />
4. If the government reformed public services and cut waste it could make services<br />
better and reduce tax at the same time<br />
Agree<br />
Disagree<br />
DK<br />
5. If taxes are cut the economy will grow faster, which will mean higher living<br />
standards AND more money available for public services<br />
Agree<br />
Disagree<br />
DK
6. People have different views about whether it is more important to reduce taxes or<br />
keep up government spending. Which of these statements comes closest to your own<br />
view?<br />
Taxes should be cut, even if it means some reduction in government services such as<br />
health, education and welfare<br />
Things should be left as they are<br />
Government services such as health, education and welfare should be extended, even if<br />
it means some increase in taxes<br />
Don't know<br />
7. Which of these statements comes closest your view?<br />
Gordon Brown remains a prudent Chancellor who has controlled spending and run the<br />
economy well<br />
Gordon Brown is becoming an imprudent Chancellor who has spent too much so that<br />
taxes will have to rise<br />
DK<br />
Q8. Thinking of income levels generally in Britain today, would you say that the gap<br />
between those with high incomes and those with low incomes is<br />
...READ OUT...<br />
1 ... too large,<br />
2 about right,<br />
3 or, too small?<br />
Q9. Which of the phrases on this card would you say comes closest to your feelings<br />
about your household's income these days?<br />
1 Living comfortably on present income<br />
2 Coping on present income<br />
3 Finding it difficult on present income<br />
4 Finding it very difficult on present income<br />
7 (Other answer (WRITE IN))<br />
10. How do you think the financial situation of your household will change<br />
over the next 12 months?<br />
Get a lot better<br />
Get a little better<br />
Stay the same<br />
Get a little worse<br />
Get a lot worse<br />
Don’t know
APPENDIX 3<br />
Comparison of results. Random telephone vs Internet sub sample weighted to profile<br />
of all adults<br />
Phone Phone Differences<br />
All adults Internet<br />
* =<br />
accessible significant<br />
% %<br />
Q1. Worried 46 44 -2<br />
Q2. Felt threatened in last year 20 19 -1<br />
Q3. Been a victim of assault 11 12 +1<br />
Q3. Been a victim of Burglary 10 11 +1<br />
Q3. Been a victim of car crime 16 17 +1<br />
Q4. Approve of guns for police 46 43 -3<br />
Q5. Confident in Criminal justice<br />
system<br />
46 42 -4<br />
Q7. Courts too soft 70 77 -7*<br />
Q8. Sentences should be served in<br />
full<br />
71 74 +3<br />
Q9. Life should mean life 79 76 -3<br />
Q10. Capital punishment for child<br />
murders<br />
64 69 +5*<br />
Q10. … for Police murders 64 62 -2<br />
Q10. … for all murders 55 53 -2<br />
Q11. Agree with capital punishment,<br />
an eye for an eye<br />
46 43 -3<br />
Q12. Death penalty is a deterrent 38 36 -2<br />
Q13. Muggers should be spared<br />
prison<br />
36 34 -2<br />
Q14. Approve of tagging 57 57 0<br />
Sample size 1024 667<br />
Telephone Telephone<br />
All adults Internet<br />
accessible<br />
* =<br />
significant<br />
% % %<br />
Q1. Taxes higher in 5 years 78 78 0<br />
Q2 real improvements in NHS 33 33 0<br />
Q3 Real improvements in schools 35 36 +1<br />
Q4. Govt could cut tax and improve<br />
services<br />
69 69 0<br />
Q5. If taxes cut economy will grow<br />
thereby benefiting public services<br />
57 59 +2<br />
Q6 Extend Government services 49 53 +4<br />
Q7. Brown is prudent 41 40 -1<br />
Q8. Gap between rich and poor too<br />
large<br />
71 75 +4<br />
Q9. Comfortable on current income 29 29 0<br />
Q10, Economic optimism 26 25 -1<br />
Sample size 1013 624
References<br />
Bourdieu, P. 1979. “Public opinion does not exist”. In Communications and class<br />
struggle. Edited by A. Mattelart and S. Siegelaub. New York: International General<br />
Comley, P. 2005. “Understanding the <strong>Online</strong> Panellist”. ESOMAR panel conference.<br />
Budapest April 2005. Available at Virtualsurveys.com<br />
Curtice, J. & <strong>Sparrow</strong>, N. 2004. Measuring attitudes of the general public via<br />
internet polls: An evaluation. The Market <strong>Research</strong> Society.<br />
Herbst, S. 1993. The meaning of public opinion. Media, Culture and Society 15.<br />
437-454<br />
Lewis. J. 2001. Constructing public opinion . How political elites do what they like and<br />
why we seem to go along with it. Columbia University Press P8-20<br />
<strong>Sparrow</strong>. N. and Turner. J. Messages from the spiral of silence: developing more<br />
accurate market information in a more uncertain political climate. JMRS, 37,4, 1995<br />
pages 357-383<br />
Zaller, J.R. 1992. The nature and origins of mass opinion. Cambridge University<br />
Press<br />
<strong>Nick</strong> <strong>Sparrow</strong> is managing director of <strong>ICM</strong> <strong>Research</strong>. He has been conducting<br />
political opinion polls for The Guardian and other media organisations since 1984<br />
and is an industry acknowledged expert on political opinion research. He won the<br />
Market <strong>Research</strong> Society Silver Medal for his work on the development of accurate<br />
opinion research, and was pollster for the Conservative Party from 1996 to 2003.<br />
<strong>ICM</strong> is a major opinion and market research company. It offers a full range of<br />
quantitative and qualitative techniques to political and business clients.