Do we really need proper research any more? The ... - ICM Research
Do we really need proper research any more? The ... - ICM Research
Do we really need proper research any more? The ... - ICM Research

You also want an ePaper? Increase the reach of your titles
YUMPU automatically turns print PDFs into web optimized ePapers that Google loves.
<strong>Do</strong> <strong>we</strong> <strong>really</strong> <strong>need</strong> <strong>proper</strong> <strong>research</strong> <strong>any</strong> <strong>more</strong>?<br />
<strong>The</strong> importance and impact of quality<br />
standards for online access panels<br />
Matthew Burn<br />
<strong>ICM</strong> <strong>Research</strong> Limited, UK<br />
Jerry Thomas<br />
MSTS Limited, UK<br />
This paper describes the results of two studies conducted by Matthew Burn of <strong>ICM</strong><br />
<strong>Research</strong> and Jerry Thomas of MSTS. <strong>The</strong> first piece of work: <strong>The</strong> <strong>Research</strong> Buyers<br />
Survey, describes work undertaken amongst a range of <strong>research</strong> buyers, to understand<br />
their views of different data collection methodologies.<br />
<strong>The</strong> second study involves two experimental tests to examine what mode effects exist<br />
when the same respondents are asked the same questions via different methodologies.<br />
In short to establish whether people ans<strong>we</strong>r the same questions differently depending<br />
on whether they do them online, by telephone or on paper.<br />
This paper also draws on other original <strong>research</strong> studies conducted by <strong>ICM</strong> and MSTS<br />
which look at issues of panel and response rate bias.<br />
1
<strong>Do</strong> <strong>we</strong> <strong>really</strong> <strong>need</strong> <strong>proper</strong> <strong>research</strong> <strong>any</strong> <strong>more</strong>?<br />
Matthew Burn & Jerry Thomas<br />
Abstract<br />
<strong>Do</strong> <strong>we</strong> <strong>really</strong> <strong>need</strong> <strong>proper</strong> <strong>research</strong> <strong>any</strong><strong>more</strong>? In short, the ans<strong>we</strong>r is yes, of course <strong>we</strong><br />
do. Ho<strong>we</strong>ver, significant numbers of <strong>research</strong> buyers appear to be increasingly willing<br />
to use online access panels and to trade confidence in the accuracy of results in return<br />
for cost savings and faster turn around times.<br />
Further<strong>more</strong>, our <strong>research</strong> indicates that m<strong>any</strong> <strong>research</strong> buyers feel under pressure<br />
from their own internal clients to deliver results <strong>more</strong> cost effectively and <strong>more</strong><br />
quickly, regardless of the issues surrounding the quality and validity of the <strong>research</strong><br />
methodology selected.<br />
This paper describes the results of two studies conducted by Matthew Burn of <strong>ICM</strong><br />
<strong>Research</strong> and Jerry Thomas of MSTS. <strong>The</strong> first piece of work; <strong>The</strong> <strong>Research</strong> Buyers<br />
Survey, describes work undertaken amongst a range of <strong>research</strong> buyers, to understand<br />
their views of different data collection methodologies.<br />
<strong>The</strong> second study involves two experimental tests to examine what mode effects exist<br />
when the same respondents are asked the same questions via different methodologies.<br />
In short to establish whether people ans<strong>we</strong>r the same questions differently depending<br />
on whether they do them online, by telephone or on paper.<br />
This paper also draws on other original <strong>research</strong> studies conducted by <strong>ICM</strong> and MSTS<br />
which look at issues of panel and response rate bias.<br />
<strong>The</strong> results suggest that <strong>research</strong> agencies and clients <strong>need</strong> to be careful not to allow<br />
the speed quality trade off to become too one sided, or in other words be careful not<br />
to go too fast. Speed of turnaround is without doubt a key part of the allure of online<br />
panels, but how fast is too fast? Our work suggests that <strong>research</strong>ers <strong>need</strong> to invest<br />
both time and resource in generating appropriate quota frameworks for studies<br />
conducted online, if they are to generate results that are representative of the market<br />
in question. Further<strong>more</strong>, our results show that <strong>research</strong>ers <strong>need</strong> to be careful that<br />
conducting online <strong>research</strong> at speed (e.g. doing all the interviews in one night or a<br />
matter of hours), does not naturally exclude some types of respondent from taking<br />
part.<br />
<strong>The</strong> findings also show that mode effects can influence the way respondents ans<strong>we</strong>r<br />
exactly the same questions. It is imperative that <strong>research</strong>ers understand the issues of<br />
mode effect as <strong>research</strong> buyers are increasingly looking to online panels as their<br />
preferred data-collection methodology and to deliver some of their most high profile<br />
insights.<br />
2
Introduction<br />
Market <strong>research</strong> methods have moved on appreciably over the past 50 years and,<br />
especially, over the past 25 years when advances in technology have offered better<br />
(this usually means faster, cheaper and <strong>more</strong> accurate/efficient) ways to interact with<br />
respondents.<br />
Although this paper will concentrate on looking at some of the issues surrounding the<br />
advent of online <strong>research</strong>, it is probably worth mentioning something similar that<br />
happened in the early 1980’s (in Europe, at least).<br />
In the late 1970’s and early 1980’s, the use of the telephone as a data collection<br />
method grew. This was used mainly to replace quota samples and, especially, meant it<br />
was much easier to conduct B2B <strong>research</strong>. Ho<strong>we</strong>ver, when the issue of using it for<br />
representative samples was raised, a furore took place over two main issues:<br />
1. Penetration – ownership of telephones was low<br />
2. Representivity – <strong>we</strong>re telephone owners different to non-owners?<br />
In the UK, the industry debated these issues long and hard and the Market <strong>Research</strong><br />
Society (MRS) sponsored parallel runs to understand the differences (even though<br />
household penetration of telephones was at 75% at this point). Well, <strong>we</strong> all know that<br />
this debate was resolved – partly due to time, and the move to universal phone<br />
ownership. We eventually reached a situation where random digit dialling could<br />
deliver reliable random samples.<br />
Is this beginning to sound a little familiar? <strong>The</strong>se are two of the issues that have also<br />
been raised about online <strong>research</strong> but, because <strong>we</strong> are <strong>more</strong> sophisticated nowadays,<br />
<strong>we</strong> also have some other questions about this whole area.<br />
Over time, quality standards have been put in place to ensure the industry provides<br />
accurate and reliable results to its client base, and <strong>we</strong> have seen codes of conduct,<br />
ISO standards, as <strong>we</strong>ll as local initiatives (such as IQCS to control fieldwork in the UK).<br />
We do, therefore, expect the industry to regulate itself.<br />
<strong>The</strong> growth of online <strong>research</strong> is <strong>we</strong>ll documented. Already in the US it is estimated<br />
that over one third of <strong>research</strong> by value is now conducted online, and approximately<br />
7% in Europe. It is likely that it is the US model that European countries will adopt as<br />
internet penetration grows in Europe, although the rapid growth in the US has partly<br />
been driven by the increasing difficulty of conducting telephone <strong>research</strong>.<br />
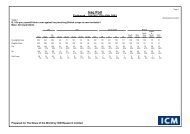
<strong>The</strong>re are some differences in the type of <strong>research</strong> projects currently conducted<br />
online (see Table 1) but Europe is moving closer to the US model over time.<br />
Concept/Product Testing has increased as a proportion, although the<br />
Customer/Employee Satisfaction remains higher in Europe at the moment, and Sales<br />
Tracking has a much lo<strong>we</strong>r proportion in Europe.<br />
<br />
3
<strong>The</strong> US also demonstrates that most of the online <strong>research</strong> conducted there is based<br />
on the use of panels – in fact, 90% of studies use panels of some description (with<br />
client’s own panels being the most popular source).<br />
Originally, it was felt that online would replace studies traditionally conducted on the<br />
telephone, but <strong>we</strong> are now seeing it replacing other data collection methods as <strong>we</strong>ll.<br />
In fact, our unique <strong>research</strong> study shows that most UK clients now see online as a<br />
viable option for most types of <strong>research</strong>, and expect to be using this data collection<br />
method <strong>more</strong> and <strong>more</strong>. So, one could ask “what is all the fuss about”?<br />
Part 1 – <strong>The</strong> <strong>Research</strong> Buyer View<br />
1.1 <strong>The</strong> impact of online <strong>research</strong> and its increasing acceptance<br />
In May and June 2007, <strong>we</strong> intervie<strong>we</strong>d a cross-section of 76 <strong>Research</strong> Buyers (i.e.<br />
client side <strong>research</strong>ers as opposed to agency <strong>research</strong>ers), and asked them about their<br />
general opinions regarding different data-collection methodologies and in particular,<br />
their opinions about online access panels.<br />
<strong>The</strong> results from our <strong>Research</strong> Buyers survey show that UK <strong>Research</strong> buyers have<br />
embraced online <strong>research</strong> methodologies and in particular online access panels, as<br />
an interviewing method. More than 8 out of 10 of the <strong>research</strong> buyers <strong>we</strong> intervie<strong>we</strong>d<br />
<strong>we</strong>re already using online access panels for some studies and the majority expect their<br />
usage of these methods to increase over the next 12 months. <strong>Research</strong> buyers appear<br />
very willing to use online panels, with most (76%) agreeing with the statement; “I am<br />
happy to use online access panels”. Likewise, only 1 in 10 agreed with the statement;<br />
“I try to avoid using online panel providers unless absolutely essential”. Indeed, only<br />
around a fifth indicated that they would actively avoid using an online methodology if<br />
the survey was very high profile.<br />
Current usage of online <strong>research</strong> methods on a project by project basis is already<br />
substantial. In their paper; “Online fights Back! - Combating communication fatigue<br />
with innovation”(2005), Thornton and Huflett suggested that online represented just<br />
under a third of projects commissioned, with a predicted increase to 40% in Europe by<br />
2007. Our <strong>research</strong> supports these findings, although it suggests that the 40% level may<br />
be breached sooner than expected in the UK, with <strong>research</strong> buyers estimating that<br />
nearly 40% of projects commissioned over the past 12 months <strong>we</strong>re done using online<br />
methodologies, including panels, pop-ups and email invites (see figure 1). Of course,<br />
this data is only an indication of the state and size of the market and does not attempt<br />
to account for spend or size of project. Nevertheless, the results give us a clear<br />
indication of the impact that online methodologies have had, especially when you<br />
consider that, at least on a number of projects basis, they account for <strong>more</strong> projects<br />
than either face-to-face or telephone.<br />
<br />
<strong>Research</strong> buyers are increasingly willing to consider online access panels to deliver<br />
some of their largest, most strategic and high profile studies, with <strong>research</strong> buyers<br />
willing to consider online panels as a data collection methodology for: Customer<br />
4
Satisfaction studies; Advertising Testing; Brand Tracking; and Concept Testing (see<br />
table2).<br />
<br />
In addition, most of the client side <strong>research</strong>ers <strong>we</strong> intervie<strong>we</strong>d predicted that they<br />
will be increasing their usage of online access panels over the coming 12 months,<br />
particularly when compared with their expected usage of face-to-face and telephone<br />
methodologies. This is of course is extremely encouraging news for online <strong>research</strong><br />
companies, particularly those who have already invested heavily in growing and<br />
maintaining quality online access panels<br />
1.2 <strong>Research</strong> Buyers have some concerns about online access panels<br />
Despite the predicted increase in the use of online panels, <strong>research</strong> buyers are<br />
concerned over quality control measures and the accuracy of results generated via<br />
online access panels. <strong>The</strong> <strong>Research</strong> Buyers Survey sho<strong>we</strong>d that the vast majority of<br />
<strong>research</strong> buyers consider themselves to be aware of the issues surrounding online<br />
panels (although very few <strong>we</strong>re aware of ESOMARs 25 questions to ask an online<br />
provider). More than half of those intervie<strong>we</strong>d think that, in general, <strong>research</strong><br />
agencies and panel providers are not doing enough to understand the issues<br />
surrounding online panels. This view is compounded by the fact that three out of four<br />
agree that <strong>research</strong> agencies <strong>need</strong> to pay <strong>more</strong> attention to quality control when using<br />
online access panels.<br />
When asked, the main concerns cited by <strong>research</strong> buyers about online access<br />
panels surround issues of bias and generating meaningful and representative<br />
samples. <strong>The</strong> comments below are made by some of the <strong>research</strong> buyers who took<br />
part in our survey and represent some of their most common concerns.<br />
“My only concern is a bias in the results, as those on the panel are happy to be<br />
<strong>research</strong>ed so not capturing views of those not on the panel”.<br />
“That the panels are not representative of the target audience required - e.g. the<br />
difficulties in getting a representative sample of small business decision makers,<br />
rather than just those who have the time to complete a survey”<br />
“My only concern initially with online panels is whether the respondents are<br />
representative of my target audience (i.e. are there enough older, lo<strong>we</strong>r social grade<br />
respondents), but this concern has lessened over time as internet penetration has<br />
increased”<br />
Other notable concerns mentioned by <strong>research</strong> buyers focus on over-use of<br />
respondents, comparability with offline methods and security of sensitive client<br />
information.<br />
“Confidentiality of what <strong>we</strong> are sharing in the survey is main concern. Applies to all<br />
quant methods but feels <strong>more</strong> scary on-line”<br />
“Perhaps a slight concern that <strong>we</strong> might be talking to a panel of <strong>research</strong> experts.<br />
Also I believe there is variability in the quality of panels but I am comfortable that<br />
the panel <strong>we</strong> use is up there with the better ones”<br />
5
“<strong>The</strong>ir trackability with CATI interviews that tend to have been carried out previously<br />
in this field of <strong>research</strong>”<br />
We <strong>we</strong>re interested to assess whether <strong>research</strong> buyers <strong>we</strong>re willing to trade off<br />
methodological concerns for quicker results and better value for money. To do this,<br />
<strong>we</strong> asked them to rate telephone, face-to-face and online access panel<br />
methodologies, for value for money, speed of turnaround and accuracy of results.<br />
As one might expect, online access panels score very <strong>we</strong>ll when rated for value for<br />
money, with two-thirds giving a score of 8, 9 or 10 on a 10-point scale where 10 means<br />
excellent and 1 means very poor. To put this into some sort of context, just 20% gave<br />
an 8-10 rating for telephone with 12% doing so for face-to-face. Likewise, online<br />
panels also score positively for speed of turnaround. On this metric 83% of our<br />
respondents gave online a score of 8-10, compared with 32% for telephone and 9% for<br />
face-to-face.<br />
Ho<strong>we</strong>ver, the extremely positive ratings our respondents gave to online panels for<br />
value for money and speed of turnaround <strong>we</strong>re not mirrored in the scores they<br />
gave for accuracy of results. In fact, by far the most positive score for accuracy of<br />
results was awarded to the most traditional of <strong>research</strong> methodologies; face-to-face,<br />
with telephone and online falling some way behind. Indeed, 22% gave online access<br />
panels what could reasonably be described as a negative score for accuracy of results<br />
(see table 3).<br />
<br />
In summary, the results from <strong>The</strong> <strong>Research</strong> Buyers Survey show that <strong>research</strong><br />
buyers envisage placing an increasing emphasis on online panels, but also have a<br />
number of concerns regarding the validity of results and expect <strong>research</strong> agencies<br />
to do <strong>more</strong> to alleviate these concerns. <strong>Research</strong> buyers concerns regarding online<br />
access panels are, for the time being at least, being offset by the advantages of<br />
reduced costs and faster turnaround times (as <strong>we</strong>ll as other methodological<br />
advantages such as the ease in which images can be shown). Further<strong>more</strong>, it appears<br />
that m<strong>any</strong> may be under increasing pressure from their own internal clients to bring<br />
projects in at lo<strong>we</strong>r cost and in shorter timescales, with almost a quarter of our<br />
respondents agreeing that internal clients are less interested in issues of quality<br />
control – they simply want their <strong>research</strong> done quickly and cheaply. Nevertheless, it is<br />
clear that <strong>research</strong> buyers are increasingly going to be looking to panel providers and<br />
<strong>research</strong> agencies to address their concerns.<br />
1.3 How much is enough?<br />
In <strong>The</strong> <strong>Research</strong> Buyers Survey, <strong>we</strong> took the opportunity to ask <strong>research</strong> buyers about<br />
two of the big issues regarding online access panels, namely; the issues of incentives<br />
and how often a panelist should be allo<strong>we</strong>d to take part in an online survey.<br />
<strong>The</strong> issue of incentives (i.e. how much to reward panelists and indeed whether to<br />
reward them at all), has been a serious topic of debate since online panels first<br />
started. On the one hand, some <strong>research</strong>ers are concerned that the payment of<br />
incentives may change the relationship bet<strong>we</strong>en respondent and <strong>research</strong>er and<br />
encourage “professional respondents”. On the other hand, others argue that <strong>we</strong> have a<br />
6
esponsibility to reward panelists fairly for their time and efforts, particularly if <strong>we</strong><br />
want them to continue to respond to invites to take part in <strong>research</strong> and consider the<br />
questions and their responses carefully. Others, such as Peter Comley in his paper<br />
“Understanding the Online Panelist”(2005), suggest that a mix of rewards might be<br />
most appropriate, such as monetary rewards, prize draws and charity donations.<br />
We asked our <strong>research</strong> buyer audience how much they thought it was reasonable for a<br />
UK panelist to receive for a 20-minute online consumer survey. <strong>The</strong> responses<br />
illustrate the different opinions that exist around this issue. More than 1 in 4 (29%)<br />
stated that £5 (€7.5) was a reasonable incentive for a 20-minute survey, 18% said £2<br />
(€3) and 13% said that they did not believe it was a good idea to pay <strong>any</strong> incentives at<br />
all (see table 4).<br />
<br />
What is perhaps most interesting about this insight, is that the most common response<br />
given, £5 (or €7.5), is a sum that, to the authors’ best knowledge, is not being given<br />
on a regular standard basis to panelists by <strong>any</strong> panel comp<strong>any</strong> for a 20-minute online<br />
UK consumer survey (<strong>ICM</strong>, for instance, pays £4 or €6).<br />
Whilst not rewarding panelists <strong>any</strong>thing for their time may be preferable to some<br />
<strong>research</strong>ers, it would in practice make recruiting and maintaining large scale online<br />
panels very costly and expensive to use. <strong>Research</strong> by Nick Sparrow, published in his<br />
paper “Developing Reliable Online Polls”(2006), sho<strong>we</strong>d that most panelists join a<br />
panel as they think it is an enjoyable way to make money. <strong>The</strong> same <strong>research</strong> also<br />
sho<strong>we</strong>d that when panelists are asked whether they would rather do a <strong>more</strong><br />
interesting survey that offers no reward or a less intriguing survey for £2 (€3), 80% opt<br />
for the latter, confirming that the desire to make money is the dominant motivation<br />
rather than a desire to register opinion. Further<strong>more</strong>, Peter Comley’s <strong>research</strong> in this<br />
area suggested that the most important improvements panelists said they wanted to<br />
see was to be paid cash for every survey they do. It seems therefore, that being on a<br />
panel and ans<strong>we</strong>ring surveys is not just about the money for all panel members, but it<br />
is a significant influencing factor for the large majority.<br />
Some <strong>research</strong>ers have put forward the view that, rewarding panelists fairly for their<br />
time is one amongst a number of factors that encourages panelists to read questions<br />
thoroughly and consider their responses, as it makes for a <strong>more</strong> fair and equitable<br />
relationship bet<strong>we</strong>en respondent and <strong>research</strong>er. But what do <strong>research</strong> buyers think<br />
about this? <strong>The</strong> <strong>Research</strong> Buyers Survey sho<strong>we</strong>d that opinion is split practically down<br />
the middle on this issue, with 46% of <strong>research</strong> buyers saying that they think the level<br />
of reward a panelist receives does make a difference to how <strong>we</strong>ll they read questions<br />
and consider their responses and 54% do not.<br />
Further <strong>research</strong> is required in this area to establish the impact the level of incentives<br />
has on a respondents ans<strong>we</strong>rs and <strong>more</strong> importantly the impact it has on the quality of<br />
their response.<br />
7
1.4 How often is too often?<br />
How often panelists should be allo<strong>we</strong>d to complete interviews is another question that<br />
has been widely discussed and debated by the <strong>research</strong> industry. Again, as with the<br />
level of incentives, there seems to be little agreement amongst <strong>research</strong> buyers as to<br />
how frequently panelists should be able to take part in surveys. <strong>The</strong> most common<br />
response to this question was once per month (43%), although 29% felt <strong>more</strong> frequently<br />
- a few times per month - was reasonable and conversely a similar proportion (26%),<br />
felt that panelists should only be allo<strong>we</strong>d to take part in surveys less often than once<br />
per month, with most of these opting for about once a quarter.<br />
Ho<strong>we</strong>ver, as Comley’s <strong>research</strong> shows, most panelists (87%) want to complete surveys<br />
at least once a <strong>we</strong>ek with 30% saying at least daily. Controlling the amount of surveys<br />
panelists complete is one solution, but this will not deter a determined panelist from<br />
joining several panels and multiple panel memberships is commonplace. Without<br />
increased collaboration bet<strong>we</strong>en panels it will be difficult, if not impossible, to<br />
control and monitor the amount of surveys a respondent completes.<br />
In summary, the <strong>research</strong> industry <strong>need</strong>s to provide <strong>more</strong> guidance to <strong>research</strong> buyers<br />
on this issue and make a strong case for what is the appropriate level of interviews a<br />
panelist should do and how this can be controlled for, especially when panelists are<br />
often on <strong>more</strong> than one panel. Indeed, perhaps <strong>we</strong> <strong>need</strong> to establish a central<br />
database of online respondents so that <strong>we</strong> can effectively control usage and adopt<br />
common incentivisation policies? At the very least, <strong>we</strong> should be able to share<br />
information on “rogue” responders and permission to share such information should<br />
form part of the terms and conditions for all panel members.<br />
Perhaps <strong>we</strong> should keep in mind was has happened in the US. As Gian Fulgoni<br />
(Chariman, comScore Network Inc) stated at CASRO (Council of American Survey<br />
Organisations) conference in October 2006 in Los Angeles: 10% of respondents account<br />
for 80% of survey responses (and 1% account for 34%).<br />
Part 2: An examination of panel bias, response rate bias and mode effects<br />
<strong>The</strong> second half of this paper is given over to a consideration and exploration of some<br />
of the issues and concerns related to those raised in <strong>The</strong> <strong>Research</strong> Buyers Survey,<br />
namely:<br />
1. Panel bias – who joins a <strong>research</strong> panel<br />
2. Response rate bias – who responds<br />
3. Mode bias – do people respond differently when asked the same questions<br />
online and over the telephone and the impact of stylistic variations<br />
It will examine the results from several pieces of original <strong>research</strong> and analysis<br />
conducted by <strong>ICM</strong> <strong>Research</strong> and MSTS.<br />
2.1 Who joins an online <strong>research</strong> panel?<br />
<strong>The</strong> <strong>Research</strong> Buyers Survey sho<strong>we</strong>d that one of the main concerns for <strong>research</strong> buyers<br />
is the ability of online access panels to generate representative samples. To test this,<br />
<strong>we</strong> contacted a nationally representative sample of 7210 GB internet users and asked<br />
8
them whether they would be willing to join an online access panel. <strong>The</strong> results of this<br />
work show that 1 in 5 said they would be willing to join an online <strong>research</strong> panel,<br />
ho<strong>we</strong>ver demographic sub-cell analysis by age illustrated key differences. Those who<br />
<strong>we</strong>re younger <strong>we</strong>re significantly <strong>more</strong> likely to say they <strong>we</strong>re interested in joining a<br />
<strong>research</strong> panel (25% of those aged 18-24), with a substantially smaller proportion of<br />
those aged over 45 agreeing to join and with low interest most acute amongst those<br />
aged 65 and over (see table 5).<br />
<br />
A similar, though less pronounced bias can also be seen when <strong>we</strong> examine the working<br />
status of those who are willing to join an online <strong>research</strong> panel. Analysis by working<br />
status sho<strong>we</strong>d that those who are retired or not working are significantly less likely to<br />
agree to participate in an online panel than those who are students or who are<br />
working (see table 6).<br />
<br />
In summary, even if an online panel is actively recruited offline, using nationally<br />
representative sampling methods, it will still ultimately suffer bias in terms of who is<br />
interested and willing to take part. <strong>Research</strong> agencies <strong>need</strong> to recognise and<br />
understand the ways in which panels are biased and set appropriate quotas on all<br />
surveys to ensure that representative samples are generated of the market in<br />
question.<br />
2.2 Which panelists respond to invitations to take part in <strong>research</strong>?<br />
One method <strong>research</strong>ers use to try and control the effects of panel bias is to send out<br />
email invitations to online panelists in proportion to the known profile of the market<br />
in question. Ho<strong>we</strong>ver, an examination of those who respond to panel invites illustrates<br />
that simply sending out invites in proportion to the known population and not setting<br />
fixed quotas, may not be enough to create a representative sample. This is because<br />
some panelists respond quicker than others to invitations to take part in <strong>research</strong>.<br />
We examined 1,000 online responses to see if <strong>we</strong> could establish <strong>any</strong> patterns as to<br />
who responded quickest to email invites. In our test, overall quotas <strong>we</strong>re set to ensure<br />
that the final sample would have the correct representative distribution of men and<br />
women and email invites <strong>we</strong>re sent out to panelists in representative proportions.<br />
This <strong>research</strong> clearly sho<strong>we</strong>d that women <strong>we</strong>re quicker to respond than men (see<br />
figure 2). <strong>The</strong>refore, unless quotas had been set on gender, the sample achieved<br />
would have been biased towards women, not only because they may make up a<br />
disproportionate amount of the panel in question, but also because they respond<br />
quicker to invites than men.<br />
<br />
<strong>The</strong> <strong>Research</strong> Buyers Survey sho<strong>we</strong>d that there is a concern about whether online<br />
access panels can generate representative unbiased samples. Our <strong>research</strong> shows that<br />
they are right to be concerned. Online panels, whether recruited online or proactively<br />
offline, are likely to be biased towards certain types of people. Further<strong>more</strong>,<br />
our <strong>research</strong> shows that some types of panelists respond quicker than others. This<br />
leads to the inevitable conclusion that if online panels are to generate representative<br />
unbiased samples, then it is imperative to set a range of relevant and sensible quotas<br />
across a number of variables. This may <strong>we</strong>ll involve a greater investment of time at<br />
9
the start of each project, in understanding the market in question and agreeing the<br />
most relevant quotas for the particular study (in some cases this may involve<br />
conducting preliminary <strong>research</strong> using Nationally Representative Omnibus studies to<br />
create sample frameworks) . It may also involve allowing enough time in field for a<br />
variety of respondent types to have an opportunity to take part in the survey. In short,<br />
it may involve a re-evaluation of the speed, value, cost trade off.<br />
Ho<strong>we</strong>ver, <strong>research</strong> has shown that whilst <strong>we</strong> can set quotas to create representative<br />
samples online, this in itself may not be enough to ensure that the responses of online<br />
panelists match those obtained from large scale random probability surveys and that<br />
there are inevitable differences that occur as a result of mode effects.<br />
2.3 Examining Mode Effects - <strong>Do</strong> the same respondents give different<br />
ans<strong>we</strong>rs to the same questions?<br />
In his paper “Developing Reliable Online Polls”, Nick Sparrow set out evidence of<br />
significant and disturbing mode effects bet<strong>we</strong>en on and offline methodologies. <strong>The</strong><br />
findings suggested that the <strong>research</strong> industry <strong>need</strong>ed to create methods to ensure<br />
online respondents carefully consider their ans<strong>we</strong>rs and design questions that do not<br />
inadvertently lead online respondents to give certain responses.<br />
To explore this subject further, <strong>we</strong> set up two experimental tests to assess whether<br />
the same people respond differently when ans<strong>we</strong>ring an identical set of questions<br />
using different data collection methods.<br />
<strong>The</strong> tests <strong>we</strong>re:<br />
Test 1 - telephone and online<br />
Test 2 – online and paper<br />
Test 1<br />
For this test <strong>we</strong> contacted a total of 343 respondents and intervie<strong>we</strong>d each person<br />
twice. <strong>The</strong> total sample was split into two demographically similar groups; Group A<br />
and Group B. Group A completed the online questionnaires first and Group B did the<br />
telephone interviews first. <strong>The</strong>y <strong>we</strong>re then re-contacted a <strong>we</strong>ek to ten days later and<br />
Group A completed the telephone interview and Group B the online interview. This<br />
allo<strong>we</strong>d us to account for <strong>any</strong> impact that the timing of the two waves may have had.<br />
Groups A and B <strong>we</strong>re further subdivided into two equal groups, hence a total of four<br />
respondent groups <strong>we</strong>re created; A1, A2, B1 and B2. Groups A and B <strong>we</strong>re subdivided<br />
so <strong>we</strong> could also test and examine the impact of asking the same questions using two<br />
visually different online templates; a “Flash Template” and a “Standard Template”.<br />
<strong>The</strong> Online Flash template is considered by respondents to be a much <strong>more</strong> enjoyable<br />
method of completing surveys, as it is visually stimulating and <strong>more</strong> engaging (see<br />
figure 3). In fact, those who complete the Flash Template version of the questionnaire<br />
are much <strong>more</strong> likely to say that they would respond to invites <strong>more</strong> often if all online<br />
surveys <strong>we</strong>re presented this way, which shows that creating engaging surveys is a<br />
worthwhile investment. <strong>The</strong> Online Standard template was the <strong>more</strong> common tick box<br />
/ radar style design.<br />
<br />
10
Table 6 illustrates the methodology used and the number of interviews achieved in<br />
each cell, as <strong>we</strong>ll as the order of the completed interviews for each of the four<br />
groups.<br />
<br />
Panelists <strong>we</strong>re rewarded for taking part at our standard rate of £1 (€1.5) per 5minutes<br />
of interview time and the online questionnaires utilised the question stalling<br />
technique <strong>we</strong> use on all online surveys to promote considered responses. This stalling<br />
technique enables us to present a question to a respondent first and then, after a 3second<br />
pause, the ans<strong>we</strong>r codes. This means that the panellist cannot just click<br />
through the survey quickly and that they are encouraged to consider the questions<br />
<strong>proper</strong>ly. In addition a number of quality control questions <strong>we</strong>re added to ensure<br />
respondents <strong>we</strong>re giving ans<strong>we</strong>rs that <strong>we</strong>re consistent. Any respondents found to be<br />
giving opposing ans<strong>we</strong>rs to the catch questions <strong>we</strong>re removed.<br />
<strong>The</strong> full questionnaire took approximately 5-minutes to complete. For the purposes of<br />
this paper, <strong>we</strong> will focus on just two batches of the questions:<br />
1. Net Promoter Score style ratings of service providers (3 questions)<br />
2. 10-point attitudinal rating questions (10 questions)<br />
<strong>The</strong> questions <strong>we</strong>re designed so that they would not obviously favour one mode of<br />
questioning. For analysis purposes, the batches of questions <strong>we</strong>re rolled together (i.e.<br />
the 7 attitudinal measures <strong>we</strong>re merged and 3 Net Promoter Score “NPS” ratings). This<br />
allo<strong>we</strong>d us to examine overall response styles rather than just looking solely at<br />
responses to individual questions.<br />
Initially <strong>we</strong> examined the differences in responses bet<strong>we</strong>en each of the waves of<br />
telephone interviews. This sho<strong>we</strong>d that there was a great deal of parity bet<strong>we</strong>en the<br />
groups for their telephone responses (see table 8).<br />
<br />
Having established levels of consistency bet<strong>we</strong>en the two waves of the telephone<br />
interviews, <strong>we</strong> <strong>we</strong>nt on to test, at an overall level, the extent to which the results<br />
from the telephone and online interviews matched. <strong>The</strong> results sho<strong>we</strong>d that whilst<br />
there was a great deal of similarity, there was a significant difference in their ans<strong>we</strong>rs<br />
to the attitudinal questions (see table 9).<br />
<br />
Further analysis of the individual attitudinal scores at each point of the scale also<br />
highlighted some interesting differences. <strong>The</strong> telephone responses to the attitudinal<br />
questions tended <strong>more</strong> towards a mid-point score of 5 out of 10 (18% for online<br />
responses compared to 3% for telephone), whilst online respondents appeared to move<br />
<strong>more</strong> towards 9 or 10 out of 10 (18% for online compared to 13% for telephone).<br />
So the results bet<strong>we</strong>en the online and telephone interviews differed significantly,<br />
people <strong>we</strong>re responding differently to exactly the same questions. This raised the<br />
question as to whether specific questions <strong>we</strong>re driving the difference, or was it due to<br />
one of the different stylistic templates or some order effect?<br />
11
<strong>The</strong> first hypothesis <strong>we</strong> tested was whether the Flash or Standard templates had<br />
affected the way respondents ans<strong>we</strong>red the questions. Table 10 shows that the<br />
differences bet<strong>we</strong>en the two online templates and the telephone ans<strong>we</strong>rs <strong>we</strong>re fairly<br />
consistent, they <strong>we</strong>re not significantly different.<br />
<br />
Our next test was to look at the consistency of the responses over the two waves of<br />
interviewing and here <strong>we</strong> saw some intriguing trends in the data. Those who did the<br />
online survey first gave <strong>more</strong> consistent ans<strong>we</strong>rs in the telephone call back interview,<br />
regardless of whether their first response was given on the Flash Template or the<br />
Standard Template. A bigger shift in responses was noted amongst those who did the<br />
telephone interview first and then the online survey, particularly for the attitudinal<br />
questions (see table 11).<br />
<br />
It is hard to definitively establish why this occurs, although two reasonable hypotheses<br />
are that respondents remember their ans<strong>we</strong>rs better if they have given them online<br />
first or give a <strong>more</strong> considered response when ans<strong>we</strong>ring online, which once<br />
considered is then easier to recall in the subsequent telephone interview. Telephone<br />
interviewing may result in a <strong>more</strong> top of mind ans<strong>we</strong>r, though that is not to say that a<br />
top of mind response is <strong>any</strong> less interesting or relevant than a <strong>more</strong> considered<br />
response.<br />
A further review of the responses by the different templates tested sho<strong>we</strong>d the most<br />
acute shift occurred bet<strong>we</strong>en those who did the telephone interview first and then<br />
<strong>we</strong>nt on to complete the Standard Template online. Amongst this group <strong>we</strong> saw a shift<br />
of 7%-points on those scoring 8 to 10 out of 10 and 12% points on those scoring 1 to 5<br />
out of 10 for their responses to the attitudinal questions.<br />
A detailed consideration of the individual questions shows that some respondents do<br />
change their ans<strong>we</strong>rs, both in test groups A and B. Ho<strong>we</strong>ver, again <strong>we</strong> noted the<br />
greatest mode effects occur around those who completed the telephone interview first<br />
and then completed the online interview – particularly for three attitudinal measures:<br />
<strong>The</strong>re is too much fuss made about the environment these days; <strong>The</strong>re is too much<br />
fuss made about healthy eating these days and I have a good work life balance.<br />
<br />
<strong>The</strong>se results suggest that <strong>research</strong>ers increasingly <strong>need</strong> to understand, recognise and<br />
accept the impact that mode of interview has on a way a respondent ans<strong>we</strong>rs<br />
questions. Further<strong>more</strong>, that re-creating the same results using different<br />
methodological approaches may not always be a realistic or an appropriate objective.<br />
Instead effort should be made to investigate further the reasons for mode<br />
differences and aim to understand the underlying patterns of behaviour behind them.<br />
This of course is particularly interesting in the light of <strong>research</strong> buyers willingness to<br />
consider switching projects to online methodologies and the implications for<br />
understanding the results, especially around the point of transition. It also strongly<br />
suggests that continued switching bet<strong>we</strong>en methodologies should be avoided.<br />
Test 2<br />
In addition, <strong>we</strong> conducted a parallel test of two food concepts, run both online (using<br />
a panel) and using pen and paper in a central location, to understand <strong>any</strong> differences<br />
12
in the results. In both cases, a photo and description of the concept was provided to<br />
the respondents, and they completed a self completion questionnaire.<br />
Based on previous experience, <strong>we</strong> <strong>we</strong>re expecting differences in the results by<br />
method, as the hypothesis is usually that people who are at home give <strong>more</strong> “honest”<br />
or realistic opinions of measures such as likelihood to buy than when they are in a<br />
“testing” environment. In the past, <strong>we</strong> have tended to see that the key scores for<br />
concepts tested online are lo<strong>we</strong>r than face to face.<br />
This time, ho<strong>we</strong>ver, <strong>we</strong> did not see that effect (see Table 13). <strong>The</strong>re <strong>we</strong>re no<br />
significant differences in <strong>any</strong> of the mean scores across the various measures for either<br />
of the concepts tested. We used sample sizes of 150 housewives for each cell, and the<br />
concepts <strong>we</strong>re tested monadically.<br />
<br />
This suggests, perhaps, that online has come of age? <strong>The</strong> comparison was a fairly<br />
robust test, and the results came out as very similar to traditional methods. Ho<strong>we</strong>ver,<br />
<strong>we</strong> should note that the paper and online interviews are both self-completion and this<br />
may reduce the mode effect when compared to intervie<strong>we</strong>r administered.<br />
13
Implications<br />
Our <strong>research</strong> demonstrates that the industry is increasingly willing to consider online<br />
access panels as a data-collection methodology and also for some of its most<br />
important studies. Whilst at face value the industry appears to be both willing and<br />
happy to use online access panels, practitioners do have a number of concerns about<br />
using them and expect the industry to be investing <strong>more</strong> time and resource in<br />
understanding and addressing a range of issues.<br />
This paper has shown that concerns over issues of sample bias are <strong>we</strong>ll founded.<br />
Online access panels, even when recruited pro-actively offline, are likely to overrepresent<br />
certain sub-groups of the population. Further<strong>more</strong>, some types of<br />
respondent respond to invitations quicker than others. This suggests that sensible<br />
quotas, based on known market profiles, should be applied to all online <strong>research</strong><br />
conducted using an online access panel, if <strong>we</strong> are to ensure that the achieved results<br />
do not over represent some respondents whilst under-representing others.<br />
Our studies have also highlighted some of the issues around comparing online and<br />
offline results and that different interviewing methods can generate different<br />
responses. <strong>The</strong>refore, even with a professionally constructed sampling frame it is<br />
unlikely that online responses will completely match those generated offline in<br />
intervie<strong>we</strong>r administered surveys, although this does not necessarily mean either is<br />
incorrect.<br />
<strong>The</strong>se findings suggest that the <strong>research</strong> industry <strong>need</strong>s to devote <strong>more</strong> time and<br />
resource to understanding mode effects in <strong>more</strong> detail. Investigations are required to<br />
fully understand why some respondents change the way they ans<strong>we</strong>r questions when<br />
asked exactly the same question via two-different interview methodologies (i.e.<br />
telephone and online), especially as m<strong>any</strong> <strong>research</strong> buyers are considering switching<br />
studies from telephone to online.<br />
It is imperative that as <strong>research</strong>ers <strong>we</strong> solve these issues, since the <strong>research</strong> industry<br />
will be looking increasingly to online panels as one of the key data-collection<br />
methodologies and to deliver some of the industries most high profile projects.<br />
14
Concluding Remarks<br />
<strong>The</strong> use of online <strong>research</strong> is growing fast, and the Net represents a rich interviewing<br />
tool full of possibilities, but there are issues to be resolved.<br />
<strong>The</strong> US seems to have ducked the issue so far, so will <strong>we</strong> fare <strong>any</strong> better?<br />
In September ‘06 there was an, IIR <strong>Research</strong> Industry Summit on Improving Respondent<br />
Co-operation held in Chicago, and quality of online responses was a major issue that<br />
was discussed. Ho<strong>we</strong>ver, despite much wringing of hands by both agencies and<br />
clients, no agreement was reached on what to do, who should do it or how it should be<br />
funded.<br />
We <strong>really</strong> <strong>need</strong> to do it, and do it now!<br />
We want to put out a rallying call for <strong>research</strong>ers in Europe to sort it out – the clients<br />
appear to want us to, and <strong>we</strong> want to continue to offer “<strong>proper</strong>” <strong>research</strong> to maintain<br />
confidence in our industry. We are already being attacked by others (e.g. consultants)<br />
so <strong>we</strong> <strong>need</strong> to protect our position.<br />
In response to some of the issues raised, ESOMAR are conducting an initiative to<br />
produce standards for the use of online panels, and <strong>we</strong> <strong>we</strong>lcome this as part of the<br />
first steps that the industry <strong>need</strong>s to take to maintain quality and re-assure the clients<br />
of the validity of this <strong>research</strong> method.<br />
15
References<br />
Comley, P. (2005); ESOMAR, Conference on Panel <strong>Research</strong>; Budapest<br />
Sparrow, N. (2006); Developing Reliable Online Polls; International Journal of Market<br />
<strong>Research</strong>; Volume 48, NO.6<br />
Thornton, R. and Hufflett, T. (2005); Combating Communication Fatigue with<br />
innovation; ESOMAR, Annual Congress; Cannes<br />
16
Notes & Exhibits<br />
FIGURES<br />
Figure 1: Relative shares of <strong>research</strong> projects commissioned using each data<br />
collection methodology.<br />
Face To<br />
Face<br />
26%<br />
Telephone<br />
30%<br />
Online<br />
Panel<br />
23%<br />
Online<br />
PopUp<br />
6%<br />
Email<br />
Invite<br />
10%<br />
Postal<br />
5%<br />
17
Figure 2:<br />
<strong>The</strong> proportion of responses by women compared to invites sent out<br />
70%<br />
65%<br />
60%<br />
55%<br />
50%<br />
45%<br />
40%<br />
35%<br />
30%<br />
25%<br />
20%<br />
% of Interviews completed by Women<br />
Nat Rep<br />
1-100 101-200 201-300 301-400 401-500 501-600 601-700 701-800 801-900 901-1000<br />
First 100 responses Last 100 responses<br />
18
Figure 3 – Examples of Flash interviewing template<br />
19
TABLES<br />
Table 1:<br />
Estimates of the breakdown of types of online <strong>research</strong> conducted in Europe and<br />
the US in 2006<br />
US<br />
Europe<br />
% %<br />
Concept/Product 31 25<br />
Sales Tracking 17 6<br />
U sage & Attitude 13 12<br />
Advertising/Brand Tracking 11 13<br />
Customer/Employee Satisfaction 8 18<br />
Copy Testing 6 6<br />
Site/User Evaluation 4 5<br />
Opinion Polling 2 7<br />
Qualitative 2 2<br />
Others 6 6<br />
Source: Inside <strong>Research</strong> newsletter February 2007<br />
20
Table 2: Consideration of online access panels for different types of study<br />
Brand<br />
health /<br />
Brand<br />
Tracking<br />
Concept<br />
Testing<br />
Product<br />
Testing<br />
Ad<br />
testing<br />
Pack<br />
test<br />
Employee<br />
satisfaction<br />
Customer<br />
Satisfaction /<br />
Commitment<br />
studies<br />
Other<br />
Ad-hoc<br />
projects<br />
Base 70 69 66 70 52 70 67 53<br />
NET: consider 87% 83% 56% 86% 63% 86% 100% 15%<br />
Would<br />
definitely use<br />
an online<br />
panel<br />
Would<br />
consider using<br />
an online<br />
panel<br />
Would<br />
definitely NOT<br />
consider using<br />
an online<br />
panel<br />
34% 17% 6% 29% 6% 29% 18% 4%<br />
53% 65% 50% 57% 58% 57% 82% 11%<br />
13% 17% 44% 14% 37% 14% - 85%<br />
21
Table 3:<br />
Ratings of different data-collection methodologies for value for money, accuracy of<br />
results and speed of turnaround<br />
Telephone<br />
Value For Money<br />
Face<br />
To<br />
Face<br />
Online<br />
Panels<br />
Telephone<br />
Accuracy Of Results<br />
Face<br />
To<br />
Face<br />
Online<br />
Panels<br />
Speed Of Turnaround<br />
Telephone<br />
Face<br />
To<br />
Face<br />
Base 74 74 74 74 74 74 74 74 74<br />
Online<br />
Panels<br />
8-10 20% 11% 66% 36% 64% 26% 32% 8% 85%<br />
1-5 11% 47% 9% 12% 5% 23% 14% 45% 1%<br />
22
Table 4:<br />
<strong>The</strong> levels of incentives <strong>Research</strong> Buyers think should be rewarded to panelists for<br />
a 20-minute UK consumer survey<br />
£10<br />
£5<br />
£4<br />
£3<br />
£2<br />
£1<br />
50<br />
pence<br />
25<br />
pence<br />
None – its not a good<br />
idea<br />
<strong>Do</strong>n’t<br />
know<br />
4% 28% 3% 11% 18% 7% 1% 1% 14% 8%<br />
23
Table 5:<br />
<strong>The</strong> percentage of respondents who are willing to join an online access panel<br />
Base<br />
Total<br />
7210<br />
Male<br />
3417<br />
Female<br />
3793<br />
18-<br />
24<br />
695<br />
Yes 19% 21% 18% 25% 26% 20% 17% 15% 10%<br />
25-<br />
34<br />
1327<br />
35-<br />
44<br />
1691<br />
45-<br />
54<br />
1540<br />
55-<br />
64<br />
1223<br />
65+<br />
734<br />
24
Table 6:<br />
<strong>The</strong> percentage of respondents who are willing to join an online access panel<br />
Total<br />
Retired Working Not working Student<br />
Base 7210 1108 4808 936 346<br />
Yes 19% 13% 19.6% 24% 25%<br />
25
Table 7:<br />
Outline of survey methodology for respondent survey<br />
Group<br />
Telephone<br />
Online – Flash<br />
Online – Standard<br />
A1 1 st (83) 2 nd (83) -<br />
A2 1 st (88) - 2 nd (88)<br />
B1 2 nd (86) 1 st (86) -<br />
B2 2 nd (86) - 1 st (86)<br />
26
Table 8:<br />
Net scores for combined questions, comparing both sets of telephone responses<br />
Group<br />
Telephone Group A<br />
Telephone Group B<br />
Difference<br />
Base for 3 NPS Questions 513 513 -<br />
Net score 8-10 / 10 51% 48% -3<br />
Mean score 7.09 6.83 -0.26<br />
Base for 7 Attitudinal<br />
Questions<br />
1197 1197 -<br />
Net score 8-10 / 10 22% 23% +1<br />
Mean Score 4.93 4.98 +.05<br />
27
Table 9:<br />
Net scores for combined questions, comparing all telephone and all online<br />
responses<br />
Group<br />
ALL Telephone<br />
ALL Online<br />
Base for 3 NPS Questions 1026 1026<br />
Difference<br />
Net score 8-10 / 10 49% 46% -3<br />
Mean score 6.96 6.76 -0.2<br />
Base for 7 Attitudinal<br />
Questions<br />
2394 2394 -<br />
Net score 8-10 / 10 23% 26% +3*<br />
Mean Score 4.95 5.11 +0.16<br />
28
Table 10:<br />
Net scores for combined questions, comparing telephone responses with responses<br />
on different online templates<br />
Base for 3<br />
NPS<br />
Questions<br />
Net 8-<br />
10<br />
Mean<br />
score<br />
Base for 7<br />
Attitudinal<br />
Questions<br />
Net 8-<br />
10<br />
Mean<br />
Score<br />
All<br />
Telephone<br />
who also<br />
did Flash<br />
Online<br />
All<br />
Flash<br />
Online<br />
Difference<br />
All<br />
Telephone<br />
who also did<br />
Standard<br />
Online<br />
All<br />
Standard<br />
Online<br />
Difference<br />
506 506 - 521 521 -<br />
48% 44% -4% 51% 47% -4%<br />
6.81 6.52 -0.29 7.11 7.01 -0.10<br />
1179 1179 - 1214 1214 -<br />
24% 27% +3% 21% 25% +4%<br />
5.03 5.12 +0.09 4.88 5.10 +0.22<br />
29
Table 11:<br />
Net scores for combined questions, illustrating order effects<br />
Base for 3<br />
NPS<br />
Questions)<br />
CATI<br />
1 st<br />
Online<br />
2 nd<br />
Difference<br />
Online 1 st<br />
CATI 2 nd<br />
513 513 513 513<br />
Difference<br />
Net 8-10 51% 46% -5 48% 45% -3<br />
Mean<br />
score<br />
7.09 6.84 -0.25 6.83 6.69 -0.14<br />
Base for 7<br />
Attitudinal<br />
Questions<br />
1197 1197 1197 1197<br />
Net 8-10 22% 27% +5% 23% 25% +2<br />
Mean<br />
Score<br />
4.93 5.26 +.33 4.98 4.96 +0.02<br />
30
Table 12:<br />
Net score differences for individual attitudinal questions, comparing sets of<br />
telephone responses<br />
Telephone<br />
1 st then<br />
Standard<br />
Telephone<br />
1st then Flash<br />
Flash 1st<br />
then<br />
Telephone<br />
Standard 1st then<br />
Telephone<br />
Base sizes 83 88 86 86<br />
Too much fuss made about<br />
the environment these days<br />
Diff. on Net score 1-5 14* 6 -4 1<br />
Diff. on Net score 8-10 -11* -7* 2 -2<br />
Too much fuss made<br />
about healthy eating these days<br />
Diff. on Net score 1-5 16* 13 -10 -3<br />
Diff. on Net score 8-10 -6 -8 9 9<br />
I am very concerned about<br />
the levels of migration into the UK<br />
Diff. on Net score 1-5 5 5 -2 -5<br />
Diff. on Net score 8-10 -6 -11 10 2<br />
More important to get a<br />
job or a trade than go to university<br />
Diff. on Net score 1-5 10 13 -10 -8<br />
Diff. on Net score 8-10 -5 3 1 1<br />
I follow politics and current affairs closely<br />
Diff. on Net score 1-5 14 -6 2 6<br />
Diff. on Net score 8-10 -7 0 -2 -2<br />
Religion is an important part of my life<br />
Diff. on Net score 1-5 8 2 4 -2<br />
Diff. on Net score 8-10 -4 -2 -2 -3<br />
I have a good work life balance<br />
Diff. on Net score 1-5 17* -2 6 -9<br />
Diff. on Net score 8-10 -5 5 -1 4<br />
31
Table 13:<br />
Mean scores from Food Concept tests run on paper and online panel (both selfcompletion)<br />
Concept A<br />
Paper<br />
Online<br />
Panels<br />
Paper<br />
Concept B<br />
Online<br />
Panels<br />
Base 150 150 150 150<br />
Overall Opinion (9 point) 7.05 7.21 6.63 6.87<br />
Uniqueness (5 point) 3.65 3.83 3.33 3.61<br />
Relevance (6 point) 4.09 4.12 3.96 4.15<br />
Likelihood to buy (5 pt) 3.62 3.57 3.68 3.81<br />
Recommendation (5 pt) 3.71 3.69 3.54 3.67<br />
32