Air Water Vapor Mixtures: Psychrometrics - DSpace@MIT
Air Water Vapor Mixtures: Psychrometrics - DSpace@MIT
Air Water Vapor Mixtures: Psychrometrics - DSpace@MIT

Create successful ePaper yourself
Turn your PDF publications into a flip-book with our unique Google optimized e-Paper software.
<strong>Air</strong> <strong>Water</strong> <strong>Vapor</strong> <strong>Mixtures</strong>: <strong>Psychrometrics</strong><br />
Leon R. Glicksman<br />
c 1996, 2010<br />
Introduction<br />
To establish proper comfort conditions within a building space, the designer must consider the<br />
air temperature and the amount of water vapor in the air. The latter is important because too<br />
high a level of water vapor can lead to uncomfortable feeling, sweat does not evaporate fast and<br />
people feel too wet and “clammy”. If the water vapor is too low, people suffer from dryness in<br />
their respiratory systems, skin dries out and is itchy and there can be a build up of static<br />
electricity, which can cause uncomfortable shocks to people and also disrupt electrical<br />
equipment.<br />
Evaporation of water into the air can serve to lower the air temperature. Cooling towers are<br />
used in conjunction with air conditioners to produce a higher COP. The condenser of the air<br />
conditioner is in contact with cooling tower water, which is at a lower temperature than the<br />
outside ambient air.<br />
We will need to define several new terms to deal with air-water vapor mixtures, sometimes<br />
referred to as psychrometrics. In addition, mass and energy balances will be established for<br />
both the air and the water. A graphical technique will be introduced which aids in visualizing<br />
the processes for the air-water vapor mixture.<br />
<strong>Mixtures</strong><br />
When air and water vapor exist alone at moderate or low pressures, always the case for our<br />
conditions, they closely approximate ideal gases. In that case the relationship between pressure,<br />
temperature and mass can be expressed as,<br />
p<br />
a<br />
V = n a RT = m a R a T<br />
(1)<br />
for the air and<br />
p<br />
v<br />
V = n v RT = m v R a T<br />
(2)<br />
for the water vapor. In these equations, the subscript a refers to the air and v to the water<br />
vapor, n is the number of moles, m the mass, T the absolute temperature, in deg Kelvin or<br />
Rankine, R is the universal gas constant and R a and R v are the ratios of R to their respective<br />
molecular weights. At low pressure, if their and water vapor are mixed together the interaction<br />
between the molecules of the two gases is modest so that the mixture can be considered an<br />
ideal gas,<br />
1
pV =( na+nv )RT (3)<br />
where p is the total pressure of the mixture. Adding equations 1 and 2 and comparing to<br />
equation 3 it can be seen that the total pressure in the mixture is just the sum of the pressure of<br />
each gas existing alone at the same temperature and in the same total volume, Dalton’s Law,<br />
p = p a<br />
+ p v<br />
(4)<br />
When the gases are mixed together p a and p v are referred to as the partial pressure of air and<br />
water vapor, respectively.<br />
The total enthalpy is the sum of the enthalpy of the air and water vapor,<br />
H = H + H = m h +m h (5)<br />
a v a a v v<br />
Dividing the total enthalpy of the mixture by the mass of the air (note, this is not the total<br />
mixture mass), we obtain the enthalpy of the mixture per unit mass of dry air which will be<br />
written as h without any subscript,<br />
H<br />
m a( )= m a (h)= ma h a+mv h v<br />
(6)<br />
ma<br />
Although this seems an odd choice just now, it will become evident why this is a convenient<br />
choice. Dividing equation 6 by the mass of the air in the mixture,<br />
⎛<br />
h= ha+ ⎜<br />
⎝<br />
mv<br />
ma<br />
⎞<br />
⎟ h v = ha+ ω hv<br />
(7)<br />
⎠<br />
Note the new enthalpy of the mixture we just defined, h, is the sum of the specific enthalpy of<br />
the air and the product of the specific enthalpy of the water vapor and the ratio of the mass of<br />
water vapor to the mass of air in the mixture. The air mass is sometimes called dry air to<br />
remind the reader that only the air without the water vapor mass is being considered. Note, be<br />
careful when you use h since different tables can use different states for the zero values of h v<br />
and h a which are added together to get h of the mixture.<br />
Humidity ratio or Specific Humidity<br />
The ratio of mass of water vapor to mass of air in a mixture is referred to as the specific<br />
humidity or the humidity ratio with the symbol ω (no this is not the humidity the goofy<br />
weathermen are reporting). The advantage in dealing with the specific humidity is that if the<br />
amount of water vapor in the air remains unchanged, the specific humidity remains constant. The specific<br />
humidity is expressed in grams of moisture (water vapor) per kilogram of dry air. Alternatively<br />
it is given as lbs v /lbs a or grains of water vapor per pound of dry air where 7000 grains is one<br />
2
pound mass.<br />
The internal energy of the mixture can also be defined in a similar form as the enthalpy, <br />
⎛<br />
u = ua+ mv ⎞<br />
⎜ ⎟u v = ua+ ω uv<br />
(8)<br />
⎝ ma ⎠<br />
but since we will be considering open systems in steady state, we won’t spend much time on<br />
this.<br />
Alternate definitions of humidity<br />
Specific humidity we defined above will be useful in writing energy balances and the like but it<br />
does not give a good feel for the degree of moisture in the air. For that there is the relative<br />
humidity, φ. For ideal gases, this is the ratio of the partial pressure of the water vapor in the<br />
mixture, p v , to the partial pressure of water vapor in a mixture saturated with water vapor at the<br />
same temperature, T s<br />
v<br />
φ = p (9)<br />
p s<br />
temperature.<br />
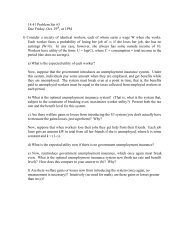
The relationship of p v and p s can be best seen by<br />
referring to the saturation curve of water, Figure 1.<br />
Note: this curve only involves the water which is in<br />
the mixture, not the air. The state of the water vapor<br />
in the mixture is shown by the point v at temperature<br />
T and partial pressure p v . In general this state will be<br />
in the superheated vapor region, away from the<br />
saturation line. If additional water vapor is added to<br />
the mixture while maintaining temperature constant at<br />
T, the largest amount which the mixture could contain<br />
is given by point s on the saturation curve between<br />
liquid water and water vapor. If more water vapor<br />
beyond s is added, the additional water vapor would<br />
condense out since the excess vapor pressure would<br />
not be in equilibrium with liquid water at this<br />
3
The specific humidity and relative humidity can be related by (see for example, McQuiston and<br />
Parker)<br />
ω p<br />
φ =<br />
a (10)<br />
0.622 p s<br />
Note, ώ must be expressed as kg water vapor/kg of dry air or lb water vapor/lb dry air in<br />
equ.10.<br />
Another term frequently used is the dew point temperature, T d . T d is found by cooling the<br />
mixture of air and water vapor, at constant total pressure, until liquid water just begins to<br />
condense. The temperature at which condensation first occurs is the dew point temperature.<br />
It is also shown on Figure 1. Note that in this case the cooling of the mixture takes place<br />
without adding or subtracting any water vapor from the air, i.e., at a constant specific humidity.<br />
When the relative humidity is high, near 100%, or the dew point temperature is close to the air<br />
temperature, the air is close to being saturated with water vapor. When this happens in the<br />
summer you had better look for an air-conditioned space.<br />
Example<br />
A mixture of water vapor and air at sea level has a specific humidity of 0.013 kg<br />
water vapor per kg of dry air.<br />
The temperature is 25 o C. What is the relative humidity and enthalpy of the mixture?<br />
Solution<br />
From saturation tables of water find P s for water corresponding to 25 o C, p s =3.17<br />
kP a<br />
h v =2547 kJ/kg for saturated water vapor (If the water vapor is an ideal gas, h v (T) is<br />
equal to h v sat at the same temperature).<br />
The total pressure of air and water vapor is approximately 101 kP a . At this point P v<br />
is unknown, but it is generally one to two orders of magnitude less than P a . As a<br />
first guess take P a as 101 kP a .<br />
The related humidity, from Equ. 10 is,<br />
φ =<br />
ω Pa<br />
= (.013) 101 = 0.666 ≈ 67%<br />
0.622 Ps (.622) 3.17<br />
4
To be more precise we can now calculate P v from φ (φ= P v /P s ) and correct our<br />
guess for P a.<br />
To find the mixture enthalpy, we need the water vapor enthalpy, h v , found above and<br />
h a the enthalpy of the dry air. Taking h a as zero at 25 o C,<br />
o<br />
kJ<br />
ha( 25 C)= C p(25 -0)= 1.005(25)= 25.13 kg<br />
h = ha+ω hv = 25.13+(0.013) 2547 =<br />
h = 25.13+33.11= 58.24<br />
Note that in the mixture the magnitude of the air enthalpy, referenced to air at 0 o C,<br />
and the water vapor enthalpy, referenced to liquid water at 0 o C, is about the same.<br />
Therefore, changes in air temperature of about 10 o C and evaporation of water<br />
increasing relative humidity by fifty percentage points lead to the same order of<br />
magnitude change in the mixture enthalpy. Both effects are important in an energy<br />
balance for the air-water vapor mixture.<br />
Measurement of the State of Mixture<br />
The state of the air-water vapor mixture can be defined by knowing the temperature, the ratio<br />
of mass of water vapor to air in the mixture and the total pressure in the mixture. In our<br />
consideration the total pressure is at or close to (the building may be slightly pressurized) the<br />
local barometric pressure. This does make some difference between say Boston and Denver<br />
but generally sea level pressures are used. The temperature (called the dry bulb temperature in<br />
this instance) can be found by using a conventional thermometer, thermocouple or thermistor.<br />
The latter two are electronic devices whose voltage output is proportional to the temperature.<br />
The most tricky measurement is the amount of water vapor in the air. In earlier days, use was<br />
made of a wet bulb thermometer whose bulb was kept in contact with a wet wick. Some water<br />
would evaporate from the wick, lowering the thermometer reading below the dry bulb<br />
temperature. The difference in reading between the wet and dry bulb thermometers can then<br />
be used to calculate the humidity of the air. The lower the relative humidity, the more<br />
evaporation ensues and the lower the wet bulb temperature. In recent times, the humidity is<br />
determined from the capacitance measurement of a thin film whose electrical properties are<br />
found to vary with water vapor content. There is also an automated instrument which has a<br />
cooling and heating element. The temperature of a mirror is adjusted until condensate is first<br />
detected; the measured mirror temperature at this condition is the dew point temperature.<br />
5
Graphical Representation<br />
The dry bulb temperature and amount of water vapor in a moist air mixture can be graphically<br />
shown on a psychrometric chart. Such a chart is very useful to visualize the changes undergone<br />
by a mixture of air and water vapor as the air is conditioned. The chart is also useful in<br />
determining the amount of energy required for a specific conditioning of the air. It is strongly<br />
suggested that you become familiar with the chart.<br />
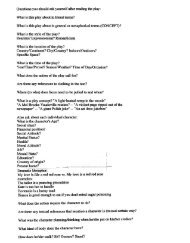
Figure 2 shows the psychrometric chart for sea level in SI units. Similar charts are available for<br />
selected altitudes and in English units. The right hand vertical scale gives the humidity ratio or<br />
specific humidity of the mixture. Note that in most situations encountered in buildings practice<br />
the mass of water vapor is much less than the mass of air in the mixture. Typical values of ω<br />
are 0 to 20 grams of water vapor per kilogram of air. Thus, the mass of water vapor is only at<br />
most one to two percent of the mass of air.<br />
The horizontal axis is the dry bulb temperature. There are parallel slanted straight lines starting<br />
from the upper left which are lines of constant mixture enthalpy per mass of dry air defined by<br />
equ. 7. To keep the enthalpy lines straight and parallel, it turns out that lines of constant dry<br />
bulb temperature deviate somewhat from vertical.<br />
The chart also shows other information. Curves of constant relative humidity, φ, are shown as<br />
are lines of constant wet bulb temperature. Thus, if the dry bulb temperature and relative<br />
humidity are known, the state of the mixture can be located on the chart and the corresponding<br />
value of the mixture enthalpy and humidity ratio read from the chart.<br />
The left hand border represents saturation conditions of the mixture, 100% relative humidity.<br />
6
60<br />
ENTHALPY - KJ PER KILOGRAM OF DRY AIR<br />
110<br />
100<br />
130<br />
120<br />
90<br />
80<br />
70<br />
50<br />
PSYCHROMETRIC<br />
CHART<br />
Normal Temperature<br />
SI Units<br />
SEA LEVEL<br />
BAROMETRIC PRESSURE: 101.325 kPa<br />
-10<br />
-20<br />
10<br />
0<br />
20<br />
30<br />
40<br />
50<br />
60<br />
70<br />
80<br />
100<br />
90<br />
ENTHALPY - KJ PER KILOGRAM OF DRY AIR<br />
SATURATION TEMPERATURE - °C<br />
-25 -20 -15 -10 -5 0 5 10 15 20 25 30 35 40 45 50 55<br />
DRY BULB TEMPERATURE - °C<br />
34.0<br />
33.0<br />
32.0<br />
31.0<br />
30.0<br />
29.0<br />
28.0<br />
27.0<br />
26.0<br />
25.0<br />
24.0<br />
23.0<br />
VAPOR PRESSURE - MM OF MERCURY<br />
30<br />
25<br />
20<br />
15<br />
10<br />
5<br />
0<br />
-5<br />
-10<br />
22.0<br />
21.0<br />
20.0<br />
19.0<br />
18.0<br />
17.0<br />
16.0<br />
15.0<br />
14.0<br />
13.0<br />
12.0<br />
11.0<br />
10.0<br />
9.0<br />
8.0<br />
7.0<br />
6.0<br />
5.0<br />
4.0<br />
3.0<br />
2.0<br />
1.0<br />
DEW POINT TEMPERATURE - °C<br />
Chart by: HANDS DOWN SOFTWARE, www.handsdownsoftware.com<br />
0.20<br />
0.25 0.30<br />
0.35<br />
SENSIBLE HEAT RATIO = Qs / Qt<br />
0.40<br />
0.45<br />
0.50<br />
0.55<br />
0.60<br />
0.65<br />
0.70<br />
0.75<br />
0.80<br />
0.85<br />
0.90<br />
0.95<br />
1.00<br />
SENSIBLE HEAT RATIO = Qs / Qt<br />
1.0 1.0<br />
0.8<br />
11.7<br />
-4.6<br />
2.0<br />
28<br />
26<br />
24<br />
22<br />
20<br />
18<br />
16<br />
14<br />
25%<br />
12<br />
90%<br />
10<br />
80%<br />
15<br />
70%<br />
8<br />
15%<br />
60%<br />
50%<br />
6<br />
10<br />
8% RELATIVE HUMIDITY<br />
40%<br />
4<br />
30%<br />
5<br />
6%<br />
20%<br />
4%<br />
2<br />
10% RELATIVE HUMIDITY<br />
-5<br />
2%<br />
-10<br />
-15<br />
-20<br />
-15<br />
SENSIBLE HEAT Qs<br />
TOTAL HEAT Qt<br />
-2.3<br />
4.0<br />
0.6<br />
8.0<br />
- :<br />
7.0<br />
-8.0<br />
0.5<br />
-4.0<br />
0.4<br />
30 WET BULB TEMPERATURE - °C<br />
25<br />
20<br />
-10<br />
-5<br />
0<br />
5<br />
10<br />
15<br />
20<br />
25<br />
30<br />
0.0<br />
-2.0<br />
0.94<br />
-1.0<br />
0.3<br />
-0.5<br />
4.7<br />
-0.4<br />
-0.3<br />
-0.2<br />
-0.1<br />
0<br />
0.2<br />
0.1<br />
1.2<br />
3.5<br />
2.3<br />
ENTHALPY<br />
HUMIDITY RATIO<br />
Dh<br />
DW<br />
-:<br />
:<br />
0.92<br />
0.90<br />
HUMIDITY RATIO - GRAMS MOISTURE PER KILOGRAM DRY AIR<br />
0.88<br />
0.86 VOLUME - CUBIC METER PER KG DRY AIR<br />
0.84<br />
0.82<br />
0.80<br />
0.78<br />
0.76<br />
0.74<br />
-20<br />
-10<br />
0<br />
10<br />
20<br />
30<br />
40<br />
ASHRAE Psychrometric Chart No. 1 removed due to copyright restrictions.<br />
This image was created by Bob Hanna, can be found on Wikipedia,<br />
and is in the public domain.
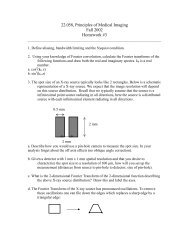
Comfort Conditions<br />
The psychrometric chart can also be used to show typical comfort conditions for indoor<br />
environments. Shown on Figure 3 are comfort conditions for individuals doing light duties such<br />
reading while seated wearing typical summer or winter clothing. These are obtained by<br />
subjecting volunteers to different<br />
Standard effective temperature and ASHRAE comfort zones<br />
70%<br />
temperature and humidity conditions and<br />
tabulating their vote on their sensation of<br />
comfort. There are factors other than dry<br />
20 100% rh<br />
15 bulb temperature and humidity which are<br />
60%<br />
important to comfort: such as air velocity,<br />
50%<br />
radiant energy, and temperature gradient.<br />
For our purposes at this time we will take<br />
15<br />
the operative temperature in Figure 3 as<br />
Dew point temperature, o C<br />
Conditioning Processes<br />
the dry bulb temperature. If the<br />
occupants are doing more intensive<br />
activities, such as working out in a gym,<br />
the conditions for comfort will change<br />
and a new chart analogous to Figure 3 can<br />
be produced.<br />
The purpose of heating, cooling and ventilation systems within buildings is to provide proper<br />
ventilation and comfort conditions for all of the occupants of a building. Ventilation is<br />
concerned with supplying enough fresh air to keep the concentration of pollutants such as CO 2<br />
in the building within a safe level. In terms of the comfort conditions shown on Figure 3, the<br />
aim is to maintain the temperature and humidity conditions throughout the building within the<br />
comfort bands shown. This requires heating or cooling the air and in some instances changing<br />
the amount of water vapor in the air. There are a number of techniques which can be used to<br />
accomplish this. We will start with the most straightforward ones.<br />
Heating<br />
10<br />
5<br />
0<br />
-5<br />
-10<br />
Winter<br />
20 o<br />
Summer<br />
Effective temperature ET o<br />
15 20 25 30<br />
Operative temperature, o C<br />
30%<br />
25 o<br />
10<br />
5<br />
0<br />
Humidity ratio, g/kg<br />
Figure by MIT OpenCourseWare.<br />
When the air dry bulb temperature is below the comfort zone, such as state 1 in Figure 4a, the<br />
temperature can be raised by forcing the air over a heat exchanger surface. On the other side of<br />
the surface, e.g. tubes, is a fluid at a higher temperature. The heat transfer from the hot fluid<br />
increases the energy of the air. Taking a control volume around the heat exchanger as shown in<br />
Figure. 4b, and assuming steady state operation we can write first a mass balance for the air,<br />
m& 1 = m& 2 (11)<br />
8
In this process, we will write the mass flow rate of dry air without the subscript a. There isn’t<br />
any water vapor added to the air so the mass balance for the water becomes,<br />
m& w = m& 1ω 1= m& 2 ω 2 (12)<br />
Combining this with eqn. 11,<br />
ω 1<br />
= ω 2<br />
(13)<br />
Thus, the humidity ratio remains constant during the heating. We can also write an energy<br />
balance for the control volume,<br />
which can be rewritten as,<br />
Q & = m& 2 ha 2<br />
+ m& v 2 hv 2<br />
- ( m& 1ha1<br />
+ m& v1 hv 2<br />
) (14)<br />
Q & = m& 2 ( ha 2<br />
+ω 2 hv 2<br />
) - m1( ha1<br />
+ω1hv1<br />
) (15)<br />
Using the enthalpy of the mixture per unit mass of the dry air, eqn 15 becomes,<br />
Now you can see the utility of the way h was defined for the mixture.<br />
Q & = m& 2 h2 - m& 1h1 (16)<br />
All of the enthalpy change for both the air and the water vapor is associated with temperature<br />
increase and each could be given as c p ΔT. The heat transfer in this process is referred to as<br />
sensible heat.<br />
The heating process is represented on the psychrometric diagram as a horizontal line from 1 to<br />
9
2 since ω remains constant. Note that the relative humidity decreases in this process as the dry<br />
bulb temperature increases.<br />
To reduce the dry bulb temperature of a mixture of air and water the mixture is passed over<br />
heat exchanger tube containing cold fluid inside. The cooling process without any addition or<br />
subtraction of water vapor is shown on Figure 5a. The equations for the mass and energy<br />
balance are exactly the same as the heating case.<br />
Dehumidification<br />
If the air has too high a moisture content and ω must be reduced, the process gets a little<br />
trickier. The heat exchanger tube must be at a temperature below the dew point for the air<br />
water vapor mixture. When that occurs, some of the water vapor will condense as liquid on the<br />
tubes. The liquid water drains off the tubes by gravity and is collected below and disposed of.<br />
In the idealized case, the process is shown as 2-3-4 on Figure 5a. First the mixture is cooled to<br />
state 3 on the saturation curve without loss of water vapor. As it is cooled further, it moves<br />
down the saturation curve to state 4 which has a lower humidity ratio and a lower dry bulb<br />
temperature.<br />
In the real process shown on Figure 5c, the condensation begins before the saturation curve is<br />
reached since the tube wall temperature is normally lower than the dew point temperature.<br />
For this process conservation of air mass yields,<br />
m& 2 = m& 4 (17)<br />
while conservation of water must balance the water vapor carried into the exchanger with the<br />
sum of the water vapor and liquid water leaving at steady state,<br />
m& v 2<br />
= m& 2 ω 2 = m& v 4<br />
+ m& l 4<br />
= m& 4 ω 4 + m& l (18)<br />
The energy balance between states 2 and 4 must also include the stream of liquid leaving,<br />
10
Q & 2-4 = m& 4 ha 4<br />
+ m& v 4 hv 4<br />
+ m& l hl - ( m& 2 ha 2<br />
+ m& v 2 hv1<br />
) (19)<br />
Since the enthalpy of the air and water leaving the exchanger is lower than that entering, Q 2-4 is<br />
negative, the mixture is cooled. The energy balance can be rearranged by use of the enthalpy of<br />
the air-water vapor mixture again,<br />
Q & 2-4 = m& 4 ( h4 )+ m& l hl - m& 2 h2 = m& 2 ( h4 − h2 )+ m& l hl (20)<br />
Note that in this case the rate of cooling, Q & , involves the change of mixture enthalpy as well as<br />
the enthalpy of the leaving water stream. In general the magnitude of the latter term is small<br />
and it can be neglected.<br />
( Q & 3-4 ) sensible = m& ( h4 - h5 )= m& Δ hsensible (21)<br />
In theory the process from state 2-3-4 could be<br />
replaced first by a reduction in water vapor at<br />
constant dry bulb temperature, process 2-5,<br />
Figure 6, followed by a reduction in dry bulb<br />
temperature at constant water vapor content,<br />
process 5-4. The latter process is one of pure<br />
sensible heat,<br />
While the process 2-5 has no sensible heat since<br />
ΔT remains constant. In process 2-5 all the<br />
heat is associated with the phase change of<br />
water from vapor to liquid and this heat is called<br />
the latent heat,<br />
( Q & 3-4 ) latent = m& (ω 2<br />
-ω 4<br />
)hlg = m& Δ hlatent (22)<br />
For the actual process 2-3-4, Δh latent / Δh sensible , given in eqns 22 and 21, is the ratio of latent to<br />
sensible heat for the process.<br />
11
We have gone to all the work of dehumidifying the air in the<br />
process 2-3-4 above. After all this, when we compare state 4<br />
to the comfort conditions shown in Figure 3 we usually find<br />
that the dry bulb temperature is too low for comfort. To<br />
achieve comfort conditions, we must reheat the mixture<br />
from state 4 to a higher dry bulb temperature as shown in<br />
Figure 7. Notice after expending energy to run a chiller or<br />
air conditioner to provide cooling to dehumidify the air from<br />
state 2 to 4 now we must supply more energy to reheat the<br />
air.<br />
Example<br />
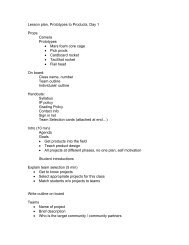
For the cooling, dehumidification and reheat process shown on the following figure,<br />
use the psychrometric chart to show how an additional heat exchanger can be used to<br />
reduce both the cooling energy and reheat energy (no, this is not violating some sacred<br />
law, it’s just a use of smarts to save energy albeit with the need for an additional heat<br />
exchanger).<br />
Q<br />
4 Cooling<br />
2<br />
coil<br />
Q<br />
6<br />
Heat exchanger<br />
Figure by MIT OpenCourseWare.<br />
Solution: <br />
Looking at the process on the psych chart, notice that temperature T 4 is lower than T 2 . <br />
If we put a heat exchanger in system, we can transfer heat from the hotter mixture at T 2<br />
to the colder mixture at T 4 . This reduces the amount of cooling we must supply as well <br />
as the amount of heat for the reheat process. <br />
12
The Condition Line<br />
Now that we’ve found out how to produce air at any given dry bulb temperature and humidity<br />
ratio that we like, let’s put it to work maintaining a comfortable interior space. We must<br />
consider the amount of sensible and latent energy given off by occupants and equipment in a<br />
building space.<br />
Consider the space shown in Figure 8a. In most systems air is<br />
brought in through a diffuser at a high enough velocity to set up a<br />
well mixed condition. Everywhere in the space, the dry bulb and<br />
humidity of the air is the same. The heat and moisture transfer<br />
from the occupants and equipment to the air can be represented<br />
as heat and moisture transfer to a control volume covering all of<br />
the air in the space. Table 1 below gives some typical values of<br />
sensible and latent heat from people. If the inlet dry air flow rate<br />
is m& and the inlet mixture enthalpy and humidity ratio are respectively h 1 and ω 1 , respectively,<br />
then the increase of the mixture enthalpy is given as,<br />
m& ( h2 - h1 )= Q & T<br />
(23)<br />
where Q & T<br />
represents the total, latent plus sensible, energy transfer rate to the air. Similarly the<br />
increase in the water vapor can be determined by,<br />
( m& v 2<br />
- m& v1 )h fg = m& (ω 2<br />
-ω 1<br />
)h fg = Q & L<br />
(24)<br />
where Q & L<br />
represents the latent energy transfer associated with the evaporation of water added<br />
to the air.<br />
Taking the ratio of equation 24 to 23,<br />
ω 2 -ω 1 = Q& L<br />
(25)<br />
h2 - h1<br />
Q & T<br />
We can see that the airflow rate into the room falls out and<br />
the ratio of Δω/Δh is determined by the ratio of latent to total<br />
energy input. That is, the state of the well mixed air in the<br />
room, state 2, must be on the line, called the condition line,<br />
with slope Δω/Δh which passes through the inlet state 1 as<br />
shown on Figure 8b.<br />
13
If we want to make sure the room falls within the comfort<br />
conditions, then state 1 must be located so that the line 1-2<br />
passes through the range of comfort on the psychrometric<br />
diagram. For example, Figure 8c shows a typical condition<br />
line and summer comfort zone. With the original state of<br />
inlet air to the space, labeled 1, the condition line does not<br />
pass through the comfort zone no matter what airflow rate is<br />
used. The inlet air must be altered to state 1' to achieve<br />
comfortable conditions.<br />
Table 1<br />
Rates of Heat Gain from Occupants in Conditioned Spaces<br />
Seated, light work (e.g. MIT student)<br />
Moderate dancing (BU student)<br />
Athletics (Harvard student)<br />
Sensible (W)<br />
70<br />
90<br />
210<br />
Latent (W)<br />
45<br />
160<br />
315<br />
Taken from ASHRAE Handbook of Fundamentals, p 26.8, 1993<br />
In a building having a common supply of conditioned air and rooms housing different<br />
activities with different ratios Δω/Δh, achieving comfortable conditions in all rooms may be<br />
difficult.<br />
Adiabatic Mixing<br />
To conserve fan energy and duct size in some buildings, the<br />
temperature of the cold air in the supply system of a building<br />
can be lowered (but at the cost of a decreased COP for the<br />
chiller). To prevent cold drafts on occupants near the diffuser<br />
outlet we can use a mixing box which mixes warmer room air<br />
with the cold supply air, see Figure 9. The question is: how to<br />
determine the dry bulb temperature and humidity of the<br />
mixture leaving the box? In most cases the box is small enough<br />
so that heat transfer from the external surface of the box is negligible. We can write a mass<br />
balance for the air entering and leaving the box at steady state,<br />
14
m& = m& + m&<br />
3 1 2<br />
(26a)<br />
and a mass balance for the water vapor,<br />
ω 3 m& 3 = m& 1ω 1+m& 2 ω 2<br />
(26b)<br />
which can be rewritten as,<br />
ω 3 = m& 1<br />
ω 1+ m& 2<br />
ω 2<br />
m& 3 m& 3<br />
(26c)<br />
Similarly an energy balance using the mixture enthalpies becomes,<br />
m& 3 h3 = m& 1h1+m& 2 h2<br />
(27a)<br />
which can be written as,<br />
h = m& 1<br />
h1+ m& 2 h<br />
m& 3 m& 3<br />
3 2<br />
(27b)<br />
When the supply air flow m& 1 is equal to the room air to the<br />
box, m& 2 , it is easy to see that the enthalpy of the mixture at<br />
state 3 is the average of h 1 and h 2 , while ω 3 is the average of<br />
ω 1 and ω 2 . State 3 shown of the figure is half way along a<br />
straight line between 1 and 2. For any other mixture<br />
proportions it can be shown that state 3 is always on the<br />
straight line between 1 and 2 with its location set by the<br />
proportion of cold air to recycled air in the mixing box.<br />
Adiabatic <strong>Water</strong> Addition to <strong>Air</strong> Stream<br />
15
In some instances, the air entering a building has too small an amount of water vapor. <strong>Water</strong> or<br />
steam sprays are used to add moisture. In earlier times, people would put out pans of liquid<br />
water. <strong>Water</strong> vapor evaporating from the surface would mix with the air passing over.<br />
Sometimes this technique can be used in hot dry climates to supplement or replace the<br />
conventional air conditioning system.<br />
We will assume that the spray mixes with the air stream in a small mixing box which is<br />
adiabatic, with no heat transfer from the outside surface of the box. See Fig. 10a. Just as before<br />
we can write conservation of mass for the steady state process,<br />
m& a1 = m& a 2<br />
= m& 1 (28)<br />
and the energy balance becomes,<br />
m& w = ω 2 m& a 2<br />
− ω 1m& a1 = (ω 2 -ω 1 )m& 1 (29)<br />
m& 1h1+m& w hw = m& 2 h2 (30)<br />
Note this holds whether the spray is liquid water or steam. Dividing both sides of eqn. 30 by<br />
m a1, we can find an expression for h 2 ,<br />
h2 = (ω 2<br />
-ω 1<br />
)hw+ h1 (31)<br />
When the spray is a cold liquid, the enthalpy of the liquid stream<br />
is small compared to that of the air mixture and as a good first<br />
approximation, the enthalpy of the air mixture leaving the<br />
mixing box is equal to the enthalpy of the mixture entering. On<br />
the psychrometric chart the process line 1 to 2 moves at<br />
constant h from a low humidity ratio and high dry bulb<br />
temperature to a final state at higher humidity and lower dry<br />
bulb temperature. The energy necessary to evaporate the liquid<br />
water comes from the air, causing a lower temperature. In a way<br />
this could be termed free cooling, but the price is water<br />
consumption.<br />
When hot liquid or steam with progressively higher enthalpy is sprayed into the air, eqn. 31<br />
indicates that the enthalpy of the air leaving the mixing box will increase. Figure 10b illustrates<br />
this. When the enthalpy of the steam in the spray is the same as the enthalpy of the water vapor<br />
in the mixture entering, the leaving mixture is at the same temperature as the entering mixture.<br />
16
Adiabatic Saturation Temperature<br />
If the water spray in Figure 10a is sufficiently large, the mixture leaving at state 2 is saturated.<br />
The temperature, T 2 , of the mixture leaving the mixing box is called the adiabatic saturation<br />
temperature. This provides another means of measuring the unknown moisture content of a<br />
mixture at, say, state 1. Rather then using a spray, the air at state 1 is passed over a long liquid<br />
water surface. If the surface area is large enough, the leaving stream, at state 2 is saturated. By<br />
measuring the dry bulb temperature of states 1 and 2 and knowing state 2 is saturated with<br />
water vapor, an energy balance or the psychrometric chart will allow us to find the humidity<br />
ratio of state 1. Thus, a mixture of air and water vapor with a given dry bulb temperature and<br />
humidity ratio has a unique value of adiabatic saturation temperature.<br />
When a closed amount of liquid is used in the adiabatic saturation apparatus, the liquid<br />
temperature, T w , approaches the outlet temperature T 2 so h w in equ. 30 can be accurately<br />
determined.<br />
Since the liquid enthalpy is a small component of equation 31, lines of constant enthalpy are<br />
approximately parallel to lines of constant adiabatic saturation temperature.<br />
17
MIT OpenCourseWare<br />
http://ocw.mit.edu<br />
4.42J / 1.044J / 2.66J Fundamentals of Energy in Buildings<br />
Fall 2008<br />
For information about citing these materials or our Terms of Use, visit: http://ocw.mit.edu/terms.