Single Word Spelling Test (SWST) Digital
Single Word Spelling Test Report - GL Assessment
Single Word Spelling Test Report - GL Assessment
- No tags were found...

Create successful ePaper yourself
Turn your PDF publications into a flip-book with our unique Google optimized e-Paper software.
www.gl-assessment.co.uk/swstdigital<br />
<strong>Single</strong> <strong>Word</strong> <strong>Spelling</strong> <strong>Test</strong> (<strong>SWST</strong>) <strong>Digital</strong><br />
sample reports<br />
1
Contents<br />
SAMPLE REPORTS<br />
PAGE<br />
Explanation of <strong>Single</strong> <strong>Word</strong> <strong>Spelling</strong> <strong>Test</strong> report 3<br />
Demographics Comparison table 4<br />
NEW<br />
Demographics Comparison graphs 5<br />
NEW<br />
Mean Score and Stanine Distribution graph 6<br />
NEW<br />
Mean Score and Stanine Distribution table 7<br />
NEW<br />
Analysis by <strong>Spelling</strong> Level 8<br />
Question by Question graph 9<br />
Question by Question listing 10<br />
Percentage of pupils by <strong>Spelling</strong> Age equivalent bands 11<br />
Student Listing 12<br />
Year on Year Comparisons - Explanation of <strong>Single</strong> <strong>Word</strong> <strong>Spelling</strong> <strong>Test</strong> Year on Year 13<br />
Comparisons report<br />
Year on Year Comparisons - Comparisons of Group Scores - Mean Score table 15<br />
Year on Year Comparisons - Comparisons of Group Scores - Mean Standard Age 16<br />
Score graph<br />
Year on Year Comparisons - Progress Chart 17<br />
NEW<br />
NEW<br />
NEW<br />
NEW<br />
NEW<br />
<strong>Single</strong> <strong>Word</strong> <strong>Spelling</strong> <strong>Test</strong><br />
<strong>Digital</strong> (<strong>SWST</strong> <strong>Digital</strong>)<br />
<strong>Single</strong> <strong>Word</strong> <strong>Spelling</strong> <strong>Test</strong> <strong>Digital</strong> (<strong>SWST</strong> <strong>Digital</strong>) is an online<br />
version of the popular paper spelling test. Featuring the<br />
same carefully constructed tests as the paper version, the<br />
assessment consists of nine tests, which have been digitised<br />
to allow pupils’ spelling to be assessed electronically.<br />
<strong>Single</strong> <strong>Word</strong> <strong>Spelling</strong> <strong>Test</strong> <strong>Digital</strong> provides you with an<br />
instant group report featuring:<br />
• <strong>Spelling</strong> Ages<br />
• Percentile Ranks<br />
• Standard Scores<br />
• Question by question analysis against national<br />
scores<br />
• Analysis by word level against national scores<br />
In addition to the group report, pupils’ individual responses<br />
are also available and data can be exported so that results<br />
can be further analysed and specific weaknesses addressed.<br />
Year on Year Comparisons - Summary Table 18<br />
NEW<br />
Year on Year Comparisons - Pupil Listing by Surname 19<br />
NEW<br />
2
<strong>SWST</strong> Report<br />
<strong>Single</strong> <strong>Word</strong><br />
<strong>Spelling</strong> <strong>Test</strong> 11<br />
School: Sample School Section:<br />
A, B, C, D, E, F<br />
Group:<br />
Sample Group<br />
<strong>SWST</strong> Level: 11<br />
The following pages give a summary of the results achieved based on the overall Standard Age Score (SAS). A SAS<br />
comes from comparing the pupil's raw score with the national standardisation sample, taking chronological age into<br />
account. This shows how each pupil is performing compared to the national average for their age. The national<br />
average SAS is 100.<br />
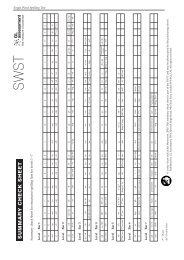
Section A - Comparison of group and national SAS mean scores<br />
The table shows average SAS and standard deviations for each group of pupils. The chart shows the average SAS scores (red dot)<br />
with 80% confidence bands (black horizontal line). Confidence bands are not displayed for groups with less than 5 pupils as these<br />
are usually very wide with few pupils. If the black horizontal line overlaps the national '100' line the results for your group do not differ<br />
significantly from the national average. The chart also shows the score distribution displayed as a box and whisker plot for each<br />
group of pupils. The graphic below shows an example for a group of pupils. Half the pupils have scores within the box range which in<br />
this example is between 90 and 110. It also shows that 5% of pupils have SAS scores below 80, 25% have scores below 90, 50%<br />
have scores below 105 (vertical black line), 75% below 110 and 95% below 125.<br />
SAS Score Distribution<br />
Section B- Comparison of group and national SAS distributions<br />
The bar chart shows the percentage of pupils that fall within certain ranges of scores. The score ranges on the graph and table are<br />
grouped into nine categories called Stanines. The chart and table allows you to compare the score distribution of your groups with<br />
the national standardisation sample. The distribution of the national standardisation sample is a "normal"<br />
distribution.<br />
Section C- Analysis by <strong>Spelling</strong> level<br />
The chart shows the percentage of the group answering correctly against the national average by level.<br />
Section D- Question by Question listing<br />
The chart and table shows the percentage of the group answering each question correctly against the national percentage.<br />
Section E- Percentage of pupils by Reading Age equivalent bands<br />
This table shows the percentage of pupils by reading age equivalent bands.<br />
Section F- Student listing<br />
This report lists the results for each student from the selected group of students who took the test. Scores for each student are<br />
shown including Standard Age Score (SAS), Stanine, National Percentile Rank, Group Rank, Raw Score and <strong>Spelling</strong> age.<br />
© GL Assessment 2009 Page 1<br />
07-Oct-2009<br />
GL Assessment is part of the Granada Learning Group.<br />
3
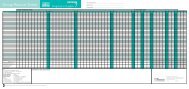
<strong>Single</strong> <strong>Word</strong> <strong>Spelling</strong> <strong>Test</strong> Demographic Comparisons Section A<br />
School: Sample School<br />
<strong>SWST</strong> Level: 11<br />
Group: Sample Group<br />
Number of pupils: 26<br />
Gender<br />
Ethnic Group<br />
Free School Meals<br />
Special Education<br />
EAL<br />
Postcode<br />
All pupils<br />
Number<br />
of pupils<br />
Standard Age Score Raw Score<br />
Mean Mean<br />
SD* SD*<br />
26 91.0 13.6<br />
26.7 12.6<br />
Male 15 92.4 15.5 27.5 14.1<br />
Female 11 89.2 10.9 25.6 10.9<br />
White 17 89.6 13.2 25.6 12.7<br />
Asian 4 95.0 11.8 31.5 10.1<br />
Black 3 95.3 22.3 27.7 17.8<br />
Chinese 1 100.0 38.0<br />
Mixed 1 78.0 12.0<br />
No 22 94.2 12.2 30.2 10.2<br />
Yes 4 73.8 4.4 7.5 4.8<br />
None 22 94.2 12.2 30.2 10.2<br />
School Action 4 73.8 4.4 7.5 4.8<br />
No 22 94.2 12.2 30.2 10.2<br />
EAL 4 73.8 4.4 7.5 4.8<br />
EE2 8 98.1 15.6 33.2 11.4<br />
EE3 7 87.3 5.4 23.9 7.2<br />
EE1 6 77.5 6.8 12.5 8.6<br />
EE4 5 101.2 9.7 37.4 7.4<br />
* SD = Standard Deviation - can only be calculated if there are 2 or more pupils with valid scores within a group<br />
© GL Assessment 2009<br />
Page 2 07-Oct-2009<br />
GL Assessment is part of the Granada Learning Group.<br />
4
<strong>Single</strong> <strong>Word</strong> <strong>Spelling</strong> <strong>Test</strong> Demographic Comparison Graphs Section A<br />
School: Sample School<br />
Group: Sample Group<br />
<strong>SWST</strong> Level: 11<br />
Number of pupils: 26<br />
Number<br />
of pupils<br />
Standard Age Score distribution<br />
60 70 80 90 100 110 120 130 140<br />
Gender<br />
Ethnic Group<br />
Free School Meals<br />
Special Education<br />
EAL<br />
Postcode<br />
All pupils<br />
26<br />
Male 15<br />
Female 11<br />
White 17<br />
Asian 4<br />
Black 3<br />
Chinese 1<br />
Mixed 1<br />
No 22<br />
Yes 4<br />
None 22<br />
School Action 4<br />
No 22<br />
EAL 4<br />
EE2 8<br />
EE3 7<br />
EE1 6<br />
EE4 5<br />
© GL Assessment 2009<br />
Page 3 07-Oct-2009<br />
GL Assessment is part of the Granada Learning Group.<br />
5
<strong>Single</strong> <strong>Word</strong> <strong>Spelling</strong> <strong>Test</strong> Mean Score and Stanine distribution Section B<br />
School: Sample School<br />
Group: Sample Group<br />
<strong>SWST</strong> Level: 11<br />
Number of pupils: 26<br />
<strong>Single</strong> <strong>Word</strong><br />
<strong>Spelling</strong> <strong>Test</strong><br />
11<br />
Stand. Age Scores<br />
Percentage of pupils in each Stanine<br />
126<br />
Mean SD N 1<br />
2 3 4 5 6 7 8 9<br />
National 100 15<br />
4 7 12 17 20 17 12 7 4<br />
All pupils 26<br />
91.0 13.6 8 12 31 23 8 8 4 8 0<br />
Gender<br />
Male 15 7<br />
92.4 15.5 20 13 27 13 7 0 13 0<br />
Female 11 9<br />
89.2 10.9 0 55 18 0 9 9 0 0<br />
Key: N - Number of pupils, SD - Standard Deviation.<br />
© GL Assessment 2009<br />
Page 4 07-Oct-2009<br />
GL Assessment is part of the Granada Learning Group.<br />
6
<strong>Single</strong> <strong>Word</strong> <strong>Spelling</strong> <strong>Test</strong> Mean Score and Stanine distribution Section B<br />
School: Sample School<br />
<strong>SWST</strong> Level: 11<br />
Group:<br />
Sample Group<br />
Number of pupils: 26<br />
Stand. Age Scores<br />
Percentage of pupils in each Stanine<br />
126<br />
Mean SD N<br />
1<br />
2 3 4 5 6 7 8 9<br />
Gender<br />
Ethnic Group<br />
Free School Meals<br />
Special Education<br />
EAL<br />
Postcode<br />
National 100 15<br />
4 7 12 17 20 17 12 7 4<br />
All pupils 91.0 13.6 26<br />
8 12 31 23 8 8 4 8 0<br />
Male 92.4 15.5 15 7<br />
20 13 27 13 7 0 13 0<br />
Female 89.2 10.9 11 9<br />
0 55 18 0 9 9 0 0<br />
White 89.6 13.2 17 12<br />
6 35 24 6 12 0 6 0<br />
Asian 95.0 11.8 4 0<br />
0 25 50 0 0 25 0 0<br />
Black 95.3 22.3 3 0<br />
33 33 0 0 0 0 33 0<br />
Chinese 100.0 1 0<br />
0 0 0 100 0 0 0 0<br />
Mixed 78.0 1 0<br />
100 0 0 0 0 0 0 0<br />
No 94.2 12.2 22 0<br />
5 36 27 9 9 5 9 0<br />
Yes 73.8 4.4 4 50<br />
50 0 0 0 0 0 0 0<br />
None 94.2 12.2 22 0<br />
5 36 27 9 9 5 9 0<br />
School Action 73.8 4.4 4 50<br />
50 0 0 0 0 0 0 0<br />
No 94.2 12.2 22 0<br />
5 36 27 9 9 5 9 0<br />
EAL 73.8 4.4 4 50<br />
50 0 0 0 0 0 0 0<br />
EE2 98.1 15.6 8 0<br />
0 38 25 0 13 0 25 0<br />
EE3 87.3 5.4 7 0<br />
14 43 29 14 0 0 0 0<br />
EE1 77.5 6.8 6 33<br />
33 33 0 0 0 0 0 0<br />
EE4 101.2 9.7 5 0<br />
0 0 40 20 20 20 0 0<br />
Key: N - Number of pupils, SD - Standard Deviation.<br />
© GL Assessment 2009<br />
GL Assessment is part of the Granada Learning Group.<br />
Page 5<br />
7<br />
07-Oct-2009
<strong>Single</strong> <strong>Word</strong> <strong>Spelling</strong> <strong>Test</strong> Analysis by Level Section C<br />
School: Sample School<br />
Group: Sample Group<br />
<strong>SWST</strong> Level: 11<br />
Number of pupils: 26<br />
Breakdown by <strong>Spelling</strong> Level<br />
Level Number of Questions Group % correct National % correct Difference<br />
Level 2 2 92<br />
91 1<br />
Level 3 3 99<br />
94 5<br />
Level 4 8 54<br />
74 -20<br />
Level 5 17 59<br />
73 -14<br />
Level 6 15 44<br />
62 -18<br />
Level 7 20<br />
5 37 -17<br />
© GL Assessment 2009<br />
GL Assessment is part of the Granada Learning Group.<br />
Page 6 07-Oct-2009<br />
8
<strong>Single</strong> <strong>Word</strong> <strong>Spelling</strong> <strong>Test</strong> Question by Question Graph Section D<br />
School:<br />
Sample School<br />
<strong>SWST</strong> Level: 11<br />
Group: Sample Group<br />
Number of pupils: 26<br />
© GL Assessment 2009<br />
GL Assessment is part of the Granada Learning Group.<br />
Page 7<br />
9<br />
07-Oct-2009
<strong>Single</strong> <strong>Word</strong> <strong>Spelling</strong> <strong>Test</strong> Question by Question Listing Section D<br />
School: Sample School<br />
<strong>SWST</strong> Level: 11<br />
Group: Sample Group<br />
Number of pupils: 26<br />
Questions sorted by National Percentage Correct<br />
Question Number <strong>Spelling</strong> Level Target <strong>Word</strong> Group%<br />
National% Difference<br />
5 96<br />
4 night 97 -1<br />
4 96<br />
3 because 96 0<br />
1 100<br />
3 dream 94 6<br />
2 100<br />
3 chair 93 7<br />
3 96<br />
2 sticking 91 5<br />
12 88<br />
2 glasses 90 -2<br />
17 81<br />
5 knew 89 -8<br />
6 92<br />
5 watch 88 4<br />
7 92<br />
6 adventure 84 8<br />
26 54<br />
4 disused 83 -29<br />
13 85<br />
6 bridge 83 2<br />
8 92<br />
5 writing 81 11<br />
34 27<br />
6 laughing 79 -52<br />
35 27<br />
5 worried 78 -51<br />
16 81<br />
5 instead 78 3<br />
9 92<br />
5 stopped 77 15<br />
27 50<br />
4 churches 77 -27<br />
11 92<br />
5 replied 77 15<br />
18 81<br />
6 treasure 76 5<br />
19 77<br />
5 bouncing 75 2<br />
23 62<br />
5 parties 73 -11<br />
14 85<br />
6 information 73 12<br />
10 92<br />
4 altogether 73 19<br />
29 35<br />
5 entertained 72 -37<br />
15 85<br />
6 dangerous 72 13<br />
36 27<br />
4 misunderstanding 71 -44<br />
32 35<br />
5 damaging 71 -36<br />
20 73<br />
6 respectful 71 2<br />
31 35<br />
4 thirsty 70 -35<br />
28 50<br />
5 search 70 -20<br />
38 23<br />
6 automatic 69 -46<br />
24 62<br />
4 discovered 69 -7<br />
22 62<br />
7 dictionary 69 -7<br />
21 69<br />
5 complained 69 0<br />
30 35<br />
6 paragraphs 66 -31<br />
33 27<br />
5 planning 65 -38<br />
© GL Assessment 2009<br />
GL Assessment is part of the Granada Learning Group.<br />
Page 8 07-Oct-2009<br />
10
<strong>Single</strong> <strong>Word</strong> <strong>Spelling</strong> <strong>Test</strong><br />
Percentage of pupils by <strong>Spelling</strong> Age equivalent bands<br />
Section: E<br />
School:<br />
Sample School<br />
<strong>SWST</strong> Level: 11<br />
Group: Sample Group<br />
Number of Pupils: 26<br />
Number of<br />
pupils<br />
Average age of pupils<br />
(yrs:mnths)<br />
Percentage of pupils by <strong>Spelling</strong> Age equivalent bands<br />
7:11 or<br />
less<br />
8:00 -<br />
8:11<br />
9:00 -<br />
9:11<br />
10:00 -<br />
10:11<br />
11:00 -<br />
11:11<br />
12:00 -<br />
12:11<br />
All Pupils 26 11:06 15% 23% 27% 12%<br />
4% 19%<br />
Male<br />
15 11:06 20% 20% 13% 20%<br />
7% 20%<br />
Female<br />
11 11:06 9% 27% 45% 0%<br />
0% 18%<br />
© GL Assessment 2009<br />
GL Assessment is part of the Granada Learning Group.<br />
Page 12<br />
11<br />
07-Oct-2009
<strong>Single</strong> <strong>Word</strong> <strong>Spelling</strong> <strong>Test</strong><br />
Student Listing<br />
Section: F<br />
School:<br />
Sample School<br />
<strong>SWST</strong> Level: 11<br />
Group: Sample Group<br />
Number of Pupils: 26<br />
Student Results sorted by Standard Age Score<br />
Name of Student<br />
Age at test<br />
(yrs:mnths)<br />
Standard Age Score (90% Confidence Bands)<br />
Stanine Percentile<br />
Rank<br />
Group<br />
Rank*<br />
Raw<br />
Score<br />
<strong>Spelling</strong><br />
Age<br />
<strong>Spelling</strong> Level Breakdown<br />
2 3 4 5<br />
6<br />
7<br />
Eddie Brown 11:06 121 8 92 1 48 12:00<br />
100 100 100 100<br />
93<br />
80<br />
Alan Watkins 11:06 121 8 92 1 48 12:00<br />
100 100 100 100<br />
93<br />
80<br />
Sandeep Kaur 11:04 112 7 79 3 45 12:00<br />
100 100 100 100<br />
87<br />
40<br />
Damien Price 11:04 110 6 75 4 44 12:00<br />
100 100 100 100<br />
80<br />
40<br />
Dolly Mos 11:06 105 6 63 5 42 12:00<br />
100 100 100 94<br />
73<br />
40<br />
Kevin Moss 11:04 100 5 50 6 38 11:06<br />
100 100 88 88<br />
60<br />
40<br />
Jonathan Aransiola 11:05 97 5 42 7 36 10:11<br />
100 100 88 88<br />
53<br />
20<br />
Pierce Bowler 11:03 94 4 34 8 32 10:03<br />
100 100 75 76<br />
47<br />
20<br />
Vikram Kapoor 11:05 93 4 32 9 32 10:03<br />
100 100 75 76<br />
47<br />
20<br />
Anita Sidhu 11:04 90 4 25 10 28 9:06<br />
100 100 63 65<br />
40<br />
20<br />
Lucy Tucker 11:05 90 4 25 10 28 9:06<br />
100 100 63 65<br />
40<br />
20<br />
Johnny Fowler 11:04 90 4 25 10 28 9:06<br />
100 100 63 65<br />
40<br />
20<br />
Hugh Vincent 11:06 89 4 23 13 28 9:06<br />
100 100 63 65<br />
40<br />
20<br />
Samantha Nash 11:06 88 3 21 14 26 9:05<br />
100 100 50 59<br />
40<br />
20<br />
Caroline Bradshaw 11:08 86 3 18 15 24 9:02<br />
100 100 38 53<br />
40<br />
20<br />
Carol Dawes 11:06 86 3 18 15 24 9:02<br />
100 100 38 53<br />
40<br />
20<br />
Nina Sharma 11:05 85 3 16 17 21 8:09<br />
100 100 25 47<br />
40<br />
0<br />
Sean Peters 11:07 84 3 14 18 21 8:09<br />
100 100 25 47<br />
40<br />
0<br />
Emma Gill 11:05 84 3 14 18 20 8:09<br />
100 100 25 41<br />
40<br />
0<br />
Alison Roberts 11:04 84 3 14 18 19 8:06<br />
100 100 25 41<br />
33<br />
0<br />
Sean Gilbert 11:06 82 3 12 21 18 8:06<br />
100 100 25 35<br />
33<br />
0<br />
Matt Thomas 11:05 81 2 10 22 15 8:02<br />
100 100 25 24<br />
27<br />
0<br />
Brad Simons 11:07 78 2 7 23 12 7:11<br />
100 100 25 24<br />
7<br />
0<br />
Colin Brown 11:07 77 2 6 24 11 7:09<br />
50 100 25 24<br />
7<br />
0<br />
Angelina Blake 11:07 71 1 3 25 5 7:03<br />
50 100 13 0<br />
0<br />
0<br />
Ben Smith 11:07 69 1 2 26 2 7:00<br />
0 67 0 0<br />
0<br />
0<br />
*Group Rank based on Standard Age Score<br />
© GL Assessment 2009<br />
GL Assessment is part of the Granada Learning Group<br />
Page 13<br />
12<br />
07-Oct-2009
<strong>Single</strong> <strong>Word</strong> <strong>Spelling</strong> <strong>Test</strong><br />
School: Sample School Section:<br />
Class/Group:<br />
Sample Group<br />
A, B, C<br />
Section A - Comparison of Group Scores.<br />
<strong>Single</strong> <strong>Word</strong> <strong>Spelling</strong><br />
<strong>Test</strong><br />
Year On Year<br />
Comparisons<br />
The table shows the mean Standard Age Scores (SAS) for each of the two <strong>Single</strong> <strong>Word</strong> <strong>Spelling</strong> <strong>Test</strong>s and<br />
the mean score difference between the tests for each group of pupils. A SAS comes from comparing a<br />
pupil's raw score with the national standardisation sample, taking chronological age into account. This<br />
shows how each pupil is performing compared to the national average for their age. The national average<br />
SAS is 100.<br />
The table below shows the number of pupils completing each test as well the number of pupils completing<br />
both tests.<br />
<strong>SWST</strong> 12 <strong>SWST</strong> 11 Completing both tests<br />
Number of pupils<br />
26 26<br />
26<br />
The chart shows the average SAS scores for each test (red dot) with 80% confidence bands (black<br />
horizontal line). Confidence bands are not displayed for groups with less than 5 pupils as these are usually<br />
very wide when there are few pupils. If the black horizontal line overlaps the national '100' line the results for<br />
your group do not differ significantly from the national average. The chart also shows the score distribution<br />
displayed as a box and whisker plot for each group of pupils. The graphic below shows an example for a<br />
group of pupils. Half the pupils have scores within the box range which in this example is between 90 and<br />
110. It also shows that that 5% of pupils have SAS scores below 80, 25% have scores below 90, 50% have<br />
scores below 105 (vertical black line), 75% below 110 and 95% below 125.<br />
SAS Score Distribution<br />
60 70 80 90 100 110 120 130<br />
140<br />
5% 25% 50%75% 95%<br />
© GL Assessment 2009 Page 1<br />
07-Oct-2009<br />
GL Assessment is part of the Granada Learning Group.<br />
13
<strong>Single</strong> <strong>Word</strong> <strong>Spelling</strong> <strong>Test</strong><br />
School: Sample School Section:<br />
Class/Group:<br />
Sample Group<br />
A, B, C<br />
Section B - Progress Chart and Summary table.<br />
The Progress chart displays the two SAS scores for each pupil as a dot in a scatter plot. There should be<br />
one dot for each pupil except for pupils that have the same values on both tests and the dots will overlap.<br />
The range of expected scores on the second test are indicated by the upper and lower dashed red lines.<br />
<strong>Single</strong> <strong>Word</strong> <strong>Spelling</strong><br />
<strong>Test</strong><br />
Year On Year<br />
Comparisons<br />
Nationally, around 70% of pupils are expected to be within this range. Where a pupil's score is above the<br />
upper red dashed line they have made significantly more progress than expected, where their score is below<br />
the lower red dashed line they have made significantly less progress than expected. 15% of pupils<br />
nationally are above the upper red dashed line and a further 15% below the lower red dashed line.<br />
Section C - Pupil Listing Ordered by Surname.<br />
The listing includes pupil’s SAS scores on each test as well as the difference in SAS scores. The progress<br />
category indicates if a pupil's progress based on the SAS score is in the ‘As Expected’, ‘Upper’ or ‘Lower’<br />
categories. Nationally, around 70% of pupils are expected to be in the ‘As Expected’ category, 15% of<br />
pupils in the ‘Upper’ category and a further 15% in the ‘Lower’ category. The listing includes pupils that<br />
have completed just one of the two tests and no progress categories are reported for these pupils.<br />
© GL Assessment 2009 Page 2<br />
07-Oct-2009<br />
GL Assessment is part of the Granada Learning Group.<br />
14
<strong>Single</strong> <strong>Word</strong> <strong>Spelling</strong> <strong>Test</strong><br />
Comparison of Group Scores<br />
Section A<br />
School: Sample School<br />
Year on Year <strong>SWST</strong><br />
Group: Sample Group Number of Pupils: 26<br />
Gender<br />
Ethnic Group<br />
Free School Meals<br />
Special Education<br />
EAL<br />
Postcode<br />
Number<br />
Mean Standard Age Scores<br />
Mean Raw Scores<br />
of pupils<br />
<strong>SWST</strong> 11 <strong>SWST</strong> 12 Difference <strong>SWST</strong> 11 <strong>SWST</strong> 12<br />
All Students<br />
26<br />
91.0 92.7 1.7 26.7 24.3<br />
Male 15 92.4 90.7 -1.7 27.5 22.7<br />
Female 11 89.2 95.4 6.2 25.6 26.4<br />
White 17 89.6 91.9 2.3 25.6 23.6<br />
Asian 4 95.0 99.8 4.8 31.5 30.8<br />
Black 3 95.3 88.0 -7.3 27.7 19.7<br />
Chinese 1 100.0 86.0 -14.0 38.0 17.0<br />
Mixed 1 78.0 98.0 20.0 12.0 31.0<br />
No 22 94.2 92.8 -1.4 30.2 24.2<br />
Yes 4 73.8 92.3 18.5 7.5 24.8<br />
None 22 94.2 92.8 -1.4 30.2 24.2<br />
School Action 4 73.8 92.3 18.5 7.5 24.8<br />
No 22 94.2 92.8 -1.4 30.2 24.2<br />
EAL 4 73.8 92.3 18.5 7.5 24.8<br />
EE2 8 98.1 90.1 -8.0 33.2 21.6<br />
EE3 7 87.3 90.3 3.0 23.9 21.7<br />
EE1 6 77.5 94.0 16.5 12.5 26.5<br />
EE4 5 101.2 98.6 -2.6 37.4 29.4<br />
Note: results in the table are based on pupils that have completed both tests.<br />
© GL Assessment 2009<br />
GL Assessment is part of the Granada Learning Group.<br />
Page 3<br />
07-Oct-2009<br />
15
<strong>Single</strong> <strong>Word</strong> <strong>Spelling</strong> <strong>Test</strong><br />
Group Demographic Comparison Graphs<br />
Section A<br />
School: Sample School<br />
Year on Year <strong>SWST</strong><br />
Group: Sample Group Number of Pupils: 26<br />
Gender<br />
Ethnic Group<br />
Free School Meals<br />
Special Education<br />
EAL<br />
Postcode<br />
Number<br />
of pupils<br />
All Students<br />
26<br />
Male 15<br />
Female 11<br />
White 17<br />
Asian 4<br />
Black 3<br />
Chinese 1<br />
Mixed 1<br />
No 22<br />
Yes 4<br />
None 22<br />
School Action 4<br />
No 22<br />
EAL 4<br />
EE2 8<br />
EE3 7<br />
EE1 6<br />
EE4 5<br />
Standard Age Score:<br />
<strong>SWST</strong> 11<br />
Standard Age Score:<br />
<strong>SWST</strong> 12<br />
60 70 80 90 100 110 120 130 140 60 70 80 90 100 110 120 130<br />
140<br />
Note: results in the table are based on pupils that have completed both tests.<br />
© GL Assessment 2009<br />
GL Assessment is part of the Granada Learning Group.<br />
Page 4<br />
07-Oct-2009<br />
16
<strong>Single</strong> <strong>Word</strong> <strong>Spelling</strong> <strong>Test</strong> Progress Chart Section B<br />
School: Sample School<br />
Year on Year <strong>SWST</strong><br />
Group: Sample Group Number of Pupils: 26<br />
Notes:<br />
(1) The x-axis gives a pupil's score on the<br />
first test in the series and the y-axis gives<br />
their score on the second test in the series.<br />
Each pupil's scores are plotted as a dot.<br />
There should be one dot for each pupil,<br />
except where two pupils have identical<br />
scores on both tests and their dots will<br />
overlap.<br />
(2) Pupils are not expected to achieve<br />
exactly the same score on both occasions.<br />
The range of expected scores on the<br />
second test is indicated by the upper and<br />
lower dashed lines. Nationally, around 70%<br />
of pupils are expected to be within this<br />
range. Where a pupil's score is above the<br />
upper red dashed line they have made<br />
significantly more progress than expected,<br />
where their score is below the lower red<br />
dashed line they have made significantly<br />
less progress than expected. 15% of pupils<br />
nationally are above the upper red dashed<br />
line and a further 15% below the lower red<br />
dashed line.<br />
© GL Assessment 2009<br />
GL Assessment is part of the Granada Learning Group.<br />
Page 5<br />
17<br />
07-Oct-2009
<strong>Single</strong> <strong>Word</strong> <strong>Spelling</strong> <strong>Test</strong><br />
Summary Table<br />
Section B<br />
School: Sample School<br />
Year on Year <strong>SWST</strong><br />
Group: Sample Group Number of Pupils: 26<br />
<strong>SWST</strong> 11<br />
Group<br />
National<br />
Mean Standard Age Score<br />
Standard Deviation<br />
91.0<br />
13.6<br />
Progress<br />
Category<br />
Number of<br />
pupils<br />
%<br />
%<br />
<strong>SWST</strong> 12<br />
Lower<br />
7<br />
27%<br />
15%<br />
Mean Standard Age Score<br />
92.7<br />
As Expected<br />
11<br />
42%<br />
70%<br />
Standard Deviation<br />
Difference<br />
Difference Between Mean Scores<br />
15.3<br />
1.7<br />
Upper<br />
Total<br />
8<br />
26<br />
31%<br />
100%<br />
15%<br />
100%<br />
The above table is based on 26 students completing both tests<br />
© GL Assessment 2009<br />
GL Assessment is part of the Granada Learning Group.<br />
Page 6<br />
07-Oct-2009<br />
18
<strong>Single</strong> <strong>Word</strong> <strong>Spelling</strong> <strong>Test</strong><br />
Pupil Listing Ordered by Surname<br />
Section C<br />
School: Sample School<br />
Year On Year <strong>SWST</strong><br />
Group: Sample Group Number of Pupils taking at least one test: 26<br />
Forename<br />
Surname<br />
Date of Birth<br />
<strong>SWST</strong> 11<br />
<strong>SWST</strong> 12<br />
Difference in SAS<br />
SAS Score<br />
SAS Score<br />
Scores<br />
Progress Category<br />
Jonathan Aransiola<br />
19/04/1998 97<br />
76 -21<br />
Lower<br />
Angelina Blake<br />
18/02/1998 71<br />
106 35<br />
Upper<br />
Pierce Bowler<br />
08/06/1998 94<br />
96 2<br />
As Expected<br />
Caroline Bradshaw<br />
03/02/1998 86<br />
103 17<br />
Upper<br />
Colin Brown<br />
28/02/1998 77<br />
74 -3<br />
As Expected<br />
Eddie Brown<br />
20/03/1998 121<br />
88 -33<br />
Lower<br />
Carol Dawes<br />
15/03/1998 86<br />
69 -17<br />
Lower<br />
Johnny Fowler<br />
14/05/1998 90<br />
70 -20<br />
Lower<br />
Sean Gilbert<br />
30/03/1998 82<br />
123 41<br />
Upper<br />
Emma Gill<br />
29/04/1998 84<br />
86 2<br />
As Expected<br />
Vikram Kapoor<br />
09/04/1998 93<br />
95 2<br />
As Expected<br />
Sandeep Kaur<br />
24/05/1998 112<br />
117 5<br />
As Expected<br />
Dolly Mos<br />
10/03/1998 105<br />
99 -6<br />
As Expected<br />
Kevin Moss<br />
19/05/1998 100<br />
86 -14<br />
Lower<br />
Samantha Nash<br />
25/03/1998 88<br />
69 -19<br />
Lower<br />
Sean Peters<br />
08/02/1998 84<br />
92 8<br />
As Expected<br />
Damien Price<br />
03/06/1998 110<br />
104 -6<br />
As Expected<br />
Alison Roberts<br />
09/05/1998 84<br />
121 37<br />
Upper<br />
Nina Sharma<br />
14/04/1998 85<br />
97 12<br />
Upper<br />
Anita Sidhu<br />
29/05/1998 90<br />
90 0<br />
As Expected<br />
Brad Simons<br />
13/02/1998 78<br />
98 20<br />
Upper<br />
Ben Smith<br />
23/02/1998 69<br />
91 22<br />
Upper<br />
Matt Thomas<br />
04/05/1998 81<br />
90 9<br />
As Expected<br />
Lucy Tucker<br />
24/04/1998 90<br />
92 2<br />
As Expected<br />
Hugh Vincent<br />
05/03/1998 89<br />
106 17<br />
Upper<br />
Alan Watkins<br />
04/04/1998 121<br />
72 -49<br />
Lower<br />
© GL Assessment 2009<br />
GL Assessment is part of the Granada Learning Group.<br />
Page 7<br />
07-Oct-2009<br />
19
Contact your local consultant for further information<br />
GL Assessment, Chiswick Centre, 414 Chiswick High Road, London, W4 5TF<br />
Phone: 0845 602 1937 Fax: +44 (0) 20 8742 8767 www.gl-assessment.co.uk<br />
GLA167 20