Progress in English 11-14 and National Curriculum English levels
Progress in English 11-14 Performance Indicators - GL Assessment
Progress in English 11-14 Performance Indicators - GL Assessment
- No tags were found...

You also want an ePaper? Increase the reach of your titles
YUMPU automatically turns print PDFs into web optimized ePapers that Google loves.
<strong>Progress</strong> <strong>in</strong> <strong>English</strong> <strong>11</strong>-<strong>14</strong> <strong>and</strong> <strong>National</strong> <strong>Curriculum</strong><br />
<strong>English</strong> <strong>levels</strong><br />
This report enables users of <strong>Progress</strong> <strong>in</strong> <strong>English</strong> (PiE) <strong>11</strong>–<strong>14</strong> to estimate:<br />
1. a pupil’s current <strong>National</strong> <strong>Curriculum</strong> level <strong>in</strong> <strong>English</strong>;<br />
2. a pupil’s possible end of Key Stage 3 test level <strong>in</strong> <strong>English</strong>.<br />
1. Estimat<strong>in</strong>g current <strong>National</strong> <strong>Curriculum</strong> <strong>English</strong> <strong>levels</strong><br />
Table 1 below gives estimates of the current <strong>National</strong> <strong>Curriculum</strong> (NC) <strong>English</strong> level for a<br />
pupil tak<strong>in</strong>g one of the PiE <strong>11</strong>-<strong>14</strong> tests. For example, a pupil with a PiE 12 raw score of 30 is<br />
estimated to be currently work<strong>in</strong>g at NC level 4B <strong>in</strong> <strong>English</strong>.<br />
Table 1: Estimates of current <strong>National</strong> <strong>Curriculum</strong> <strong>English</strong> level from PiE <strong>11</strong>-<strong>14</strong> raw<br />
scores<br />
Level PiE <strong>11</strong> PiE 12 PiE 13 PiE <strong>14</strong><br />
2 or below 0-<strong>11</strong><br />
3C 12-16<br />
3B 17-21<br />
0-25 0-23 0-22<br />
3A 22-26<br />
4C 27-31 26-29 24-26 23-26<br />
4B 32-36 30-33 27-30 27-30<br />
4A 37-41 34-37 31-34 31-34<br />
5C 42-45 38-40 35-37 35-38<br />
5B 46-50 41-43 38-40 39-41<br />
5A 51-55 44-46 41-43 42-45<br />
6C 47-51 44-45 46-47<br />
6B 52-55 46-48 48-50<br />
6A 56-58 49-50 51-53<br />
7 or higher 51-59 54-60<br />
2. Estimat<strong>in</strong>g possible end of Key Stage 3 <strong>English</strong> test <strong>levels</strong><br />
Table 2 gives <strong>in</strong>dicators of the <strong>levels</strong> pupils might obta<strong>in</strong> <strong>in</strong> the end of KS3 <strong>English</strong> test<br />
based on their prior PiE <strong>11</strong>-<strong>14</strong> st<strong>and</strong>ardised score. The <strong>in</strong>formation is also presented <strong>in</strong><br />
progress charts at the end of the report.<br />
These end of KS3 <strong>in</strong>dicators are based on data from 4,562 pupils from 38 schools who<br />
completed PiE tests <strong>in</strong> years 7,8 or 9 prior to the KS3 national tests. This research showed a<br />
very strong <strong>and</strong> statistically significant correlation of 0.71 between PiE <strong>and</strong> KS3 <strong>English</strong> test<br />
results.
Table 2: Estimates of end of KS3 test <strong>levels</strong> <strong>in</strong> <strong>English</strong> from PiE <strong>11</strong>-<strong>14</strong> st<strong>and</strong>ardised<br />
scores<br />
PiE<br />
Probability of achiev<strong>in</strong>g each NC level<br />
St<strong>and</strong>ardised<br />
Score<br />
3 or<br />
below 4 5 6 7 8<br />
Indicated<br />
level<br />
74 or below 65% 30% 5% 3 or below<br />
75-79 43% 44% 12% 1% 4C<br />
80-84 25% 50% 23% 2%<br />
85-89 13% 44% 37% 4%<br />
90-94 7% 33% 51% 9% 1%<br />
95-99 4% 21% 58% 16% 2%<br />
100-104 2% 13% 57% 26% 3%<br />
105-109 1% 7% 49% 37% 5% 1%<br />
<strong>11</strong>0-<strong>11</strong>4 1% 4% 38% 48% 9% 1%<br />
<strong>11</strong>5-<strong>11</strong>9 3% 28% 54% <strong>14</strong>% 2%<br />
120-124 2% 20% 56% 20% 2%<br />
124+ 1% <strong>14</strong>% 54% 27% 4%<br />
Note: All figures are rounded to whole numbers <strong>and</strong> may not sum to 100%. Blank cells <strong>in</strong>dicate the presence of fewer than<br />
0.5% of pupils. The <strong>in</strong>dicated <strong>levels</strong> are based on the KS3 test <strong>levels</strong> but have been subdivided <strong>in</strong>to categories A, B or C<br />
with A denot<strong>in</strong>g a higher level than B or C.<br />
Us<strong>in</strong>g the tables <strong>and</strong> charts<br />
To use the table for a particular pupil, you should f<strong>in</strong>d the appropriate score b<strong>and</strong> <strong>in</strong> the first<br />
column with<strong>in</strong> which the pupil’s score lies. You should then read off the percentages <strong>in</strong> the<br />
adjacent columns along the same row. The middle six columns give an <strong>in</strong>dication of the<br />
likelihood of achiev<strong>in</strong>g each KS3 test level. The last column gives an <strong>in</strong>dication of the level<br />
the pupil is most likely to obta<strong>in</strong>, based on the probabilities of obta<strong>in</strong><strong>in</strong>g each level.<br />
For example, a pupil with a st<strong>and</strong>ardised PiE score of 88 has a 13% chance of obta<strong>in</strong><strong>in</strong>g a<br />
level 3 or below, a 44% chance of obta<strong>in</strong><strong>in</strong>g a level 4, a 37% chance of obta<strong>in</strong><strong>in</strong>g a level 5<br />
<strong>and</strong> a 4% chance of obta<strong>in</strong><strong>in</strong>g a level 6. However, the most likely outcome for the pupil is<br />
level 4A.<br />
Sett<strong>in</strong>g targets<br />
The table shows what pupils with different PiE scores actually achieved <strong>in</strong> the KS3 tests.<br />
PiE scores can therefore be helpful <strong>in</strong> provid<strong>in</strong>g forecasts for pupils’ atta<strong>in</strong>ment at the end of<br />
KS3. However, targets are more than forecasts, s<strong>in</strong>ce targets should also <strong>in</strong>clude an<br />
element of challenge. Your wide <strong>and</strong> detailed knowledge of each <strong>in</strong>dividual pupil, <strong>and</strong> your<br />
class/school aspirations <strong>in</strong> relation to the benchmark tables conta<strong>in</strong>ed <strong>in</strong> the Autumn<br />
Package <strong>and</strong> other data, will contribute to translat<strong>in</strong>g these forecasts <strong>in</strong>to challeng<strong>in</strong>g yet<br />
achievable targets.<br />
Updat<strong>in</strong>g the <strong>in</strong>dicators<br />
You can download updated <strong>in</strong>dicators <strong>and</strong> full technical reports from our website at www.glassessment.co.uk.<br />
If you have any queries please call the GL Assessment Customer<br />
Services Team on 0845 602 1937. To discuss any tra<strong>in</strong><strong>in</strong>g requirements you may have <strong>in</strong><br />
underst<strong>and</strong><strong>in</strong>g st<strong>and</strong>ardised assessments, please contact GL Performance’s Cont<strong>in</strong>u<strong>in</strong>g<br />
Professional Development on (020) 8996 6039.
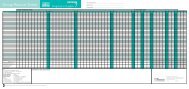
<strong>Progress</strong> <strong>in</strong> <strong>English</strong> (PiE) <strong>11</strong>-<strong>14</strong> <strong>and</strong> end of KS3 progress charts<br />
90%<br />
80%<br />
70%<br />
60%<br />
50%<br />
40%<br />
30%<br />
20%<br />
10%<br />
0%<br />
65%<br />
3 or<br />
below<br />
PiE scores