Progress in Maths (PiM) Digital
PiM Sample Report - GL Assessment
PiM Sample Report - GL Assessment

You also want an ePaper? Increase the reach of your titles
YUMPU automatically turns print PDFs into web optimized ePapers that Google loves.
www.gl-assessment.co.uk/pimdigital<br />
<strong>Progress</strong> <strong>in</strong> <strong>Maths</strong> (<strong>PiM</strong>) <strong>Digital</strong><br />
sample reports<br />
Includes<br />
new enhanced<br />
report<strong>in</strong>g<br />
1
Contents<br />
SAMPLE REPORTS<br />
PAGE<br />
<strong>Progress</strong> <strong>in</strong> <strong>Maths</strong> 11 Group Report – Explanation of the <strong>Progress</strong> <strong>in</strong> <strong>Maths</strong> report 3<br />
<strong>Progress</strong> <strong>in</strong> <strong>Maths</strong> 11 Group Report - Pupil List<strong>in</strong>g ordered by Standard Age Score 4<br />
<strong>Progress</strong> <strong>in</strong> <strong>Maths</strong> 11 Group Report - Group and National Comparison - Mean Score table 5<br />
<strong>Progress</strong> <strong>in</strong> <strong>Maths</strong> 11 Group Report - Group and National Comparison - Mean Standard Age Score graph 6<br />
<strong>Progress</strong> <strong>in</strong> <strong>Maths</strong> 11 Group Report - Group and National Comparison - Standard Age Score distribution 7<br />
<strong>Progress</strong> <strong>in</strong> <strong>Maths</strong> 11 Group Report - Analysis by Process and Curriculum Content categories graph 8<br />
<strong>Progress</strong> <strong>in</strong> <strong>Maths</strong> 11 Group Report - Question by Question graph 9<br />
<strong>Progress</strong> <strong>in</strong> <strong>Maths</strong> 11 Group Report - Question by Question list<strong>in</strong>g - ordered by National Percent correct 10<br />
<strong>Progress</strong> <strong>in</strong> <strong>Maths</strong> 11 Group Report - Question by Question list<strong>in</strong>g - ordered by Group-National difference 11<br />
<strong>Progress</strong> <strong>in</strong> <strong>Maths</strong> Year On Year Comparisons - Analysis by Process and Curriculum Content categories table 12<br />
<strong>Progress</strong> <strong>in</strong> <strong>Maths</strong> Year On Year Comparisons - Explanation of <strong>Progress</strong> <strong>in</strong> <strong>Maths</strong> Year On Year Comparisons report 13<br />
<strong>Progress</strong> <strong>in</strong> <strong>Maths</strong> Year On Year Comparisons - Comparison of Group Scores - Mean score table 15<br />
<strong>Progress</strong> <strong>in</strong> <strong>Maths</strong> Year On Year Comparisons - Comparison of Group Scores - Mean Standard Age Score graph 16<br />
<strong>Progress</strong> <strong>in</strong> <strong>Maths</strong> Year On Year Comparisons - <strong>Progress</strong> Chart 17<br />
<strong>Progress</strong> <strong>in</strong> <strong>Maths</strong> Year On Year Comparisons - Summary Table 18<br />
<strong>Progress</strong> <strong>in</strong> <strong>Maths</strong> Year On Year Comparisons - Pupil List<strong>in</strong>g ordered by Surname 19<br />
APP Mapp<strong>in</strong>g Grid 20<br />
APP Mapp<strong>in</strong>g Grid 21<br />
Case Study - Onl<strong>in</strong>e test<strong>in</strong>g <strong>in</strong> Leicestershire 22<br />
Case Study - Onl<strong>in</strong>e test<strong>in</strong>g at Handcross Park Independent Prep School 23<br />
NEW<br />
NEW<br />
NEW<br />
NEW<br />
NEW<br />
NEW<br />
NEW<br />
NEW<br />
NEW<br />
<strong>Progress</strong> <strong>in</strong> <strong>Maths</strong><br />
(<strong>PiM</strong>) <strong>Digital</strong><br />
<strong>Progress</strong> <strong>in</strong> <strong>Maths</strong> 6-14 is an onscreen<br />
version of our premier suite of <strong>Maths</strong><br />
assessments. Designed to provide you<br />
with the rich diagnostic <strong>in</strong>formation<br />
about the pupils’ mathematical<br />
abilities, it helps address any identified<br />
areas of concern and builds upon<br />
what pupils already know <strong>in</strong> order to<br />
<strong>in</strong>crease their understand<strong>in</strong>g. <strong>Progress</strong><br />
<strong>in</strong> <strong>Maths</strong> covers all the current UK<br />
National Curricula content.<br />
Note: Pupil list<strong>in</strong>gs can be sorted by<br />
Surname or by First name or by merit<br />
order based on Standard Age Scores.<br />
New Enhanced Reports<br />
Our digital products now come with<br />
additional enhanced report<strong>in</strong>g as<br />
standard. These provide more powerful<br />
and flexible <strong>in</strong>sights <strong>in</strong>to test results and<br />
<strong>in</strong>clude reports such as:<br />
• Group Demographic Comparisons<br />
• Year on Year achievement<br />
Reports are available by class, year<br />
group, schools, cluster of schools or by<br />
authority.<br />
Speak to your area consultant for more<br />
details.<br />
2
<strong>Progress</strong> <strong>in</strong> <strong>Maths</strong> Reports<br />
School: Class/Group:<br />
Sample School Sample Group Section:<br />
No. of students:<br />
A, B, C<br />
28<br />
Section A - Student list<strong>in</strong>g<br />
<strong>Progress</strong> <strong>in</strong><br />
<strong>Maths</strong> 11<br />
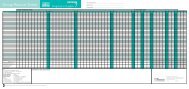
This report lists the results for each student from the selected group of students who took the test. Scores<br />
for each student are shown <strong>in</strong>clud<strong>in</strong>g Standard Age Score (SAS), Stan<strong>in</strong>e, National Percentile Rank, Group<br />
Rank, Raw Score and estimated National Curriculum <strong>Maths</strong> Levels for England, Wales and Northern<br />
Ireland. Some of the levels are split <strong>in</strong>to three categories (C,B and A) with A denot<strong>in</strong>g the highest category<br />
with<strong>in</strong> a level. This section also shows student performance <strong>in</strong> the content categories of Number, Shape,<br />
Space and Measures, Data Handl<strong>in</strong>g and Algebra.<br />
Section B - Comparison of Group and National Scores<br />
The table shows the mean scores and the standard deviations for Standard Age Scores and raw scores forr<br />
each group of students. The first chart <strong>in</strong> this section show the average SAS scores for your groups with<br />
80% confidence bands <strong>in</strong>dicated by the horizontal l<strong>in</strong>es. If the horizontal l<strong>in</strong>e on the mean Standard Age<br />
Score score chart overlaps the National "100" (average) l<strong>in</strong>e, the results for your group do not differ<br />
significantly from the National average.<br />
The first bar bar chart shows the percentage of of students that fall with<strong>in</strong> certa<strong>in</strong> ranges of scores. The charts allow<br />
you to compare the score distribution of your group with the National distributions. The second bar chart<br />
shows the percentage success rates for each of the process areas for the class/group aga<strong>in</strong>st the National<br />
average. In some cases, the profile for the class may be above the National average, or below the National<br />
average, <strong>in</strong> all process areas. In other cases, the results may reveal strengths <strong>in</strong> one particular process<br />
area, but a relative weakness <strong>in</strong> another.<br />
Section C - Question by question analysis<br />
The graphs and tables <strong>in</strong> this section provide details about the success rates the class/group has with each<br />
question. The questions your class/group f<strong>in</strong>d most difficult and which were relatively easy can be identified.<br />
Copyright © 2008 GL Assessment Limited<br />
ment is part GL of Assessment, the Granada Learn<strong>in</strong>g is part of Group. the Granada Learn<strong>in</strong>g Group.<br />
3
Section A: <strong>Progress</strong> <strong>in</strong> <strong>Maths</strong> 11 - Student List<strong>in</strong>g<br />
School: Sample School<br />
Group: Sample Group<br />
No. Students 28<br />
Name of Student<br />
Student Results sorted by Standard Age Score<br />
Age at test at Standard test<br />
Age Score (90% Confidence Bands)<br />
Stan<strong>in</strong>e Percentile<br />
(yrs:mnths)<br />
Rank<br />
Group<br />
Rank*<br />
Raw<br />
Score<br />
<strong>Maths</strong><br />
Level**<br />
Sect<br />
Percentage Standard<br />
Correct - Curriculum Content<br />
Categories***<br />
N S D A<br />
Daniel Browne 10:06 9:06 9:06<br />
138 138 9 99 1 50 5a+ 100 100 100 100<br />
Sandeep Sharma 10:06 9:06 9:06<br />
138 138 9 99 1 49 5a+ 100 100 92 100<br />
Mandeep S<strong>in</strong>gh 10:06 9:06 9:06<br />
138 138 9 99 1 49 5a+ 100 100 92 100<br />
Robert Rob<strong>in</strong>son 10:06 9:06 9:06<br />
126 126 8 96 4 46 5a+ 95 87 92 100<br />
Nita Moss 10:07 9:07 9:07<br />
126 126 8 96 4 46 5a+ 95 87 92 100<br />
Maureen Kennedy 10:06 9:06 9:06<br />
126 126 8 96 4 46 5a+ 95 87 92 100<br />
Susan Bush 10:06 9:06 9:06<br />
126 126 8 96 4 46 5a+ 95 87 92 100<br />
Sanjay Rooprai 10:06 9:06 9:06<br />
123 123 8 94 8 45 5b 91 87 92 100<br />
Kareena Khan 10:06 9:06 9:06<br />
113 113 7 80 9 40 5c 77 87 92 33<br />
Tom Albright 10:06 9:06 9:06<br />
108 108 6 70 10 35 4a 68 73 83 33<br />
Mary Aransiola 10:06 9:06 9:06<br />
103 103 5 58 11 29 4b 59 60 58 33<br />
Adrian Fowler 10:07 9:07 9:07<br />
94 94 4 34 12 23 3a 50 53 33 33<br />
Peter Watt 10:07 9:07 9:07<br />
94 94 4 34 12 23 3a 50 53 33 33<br />
Florence Nash 10:07 9:07 9:07<br />
93 93 4 32 14 22 3a 50 47 33 33<br />
Richard Mathews 10:06 9:06 9:06<br />
93 93 4 32 14 22 3a 50 47 33 33<br />
Dom<strong>in</strong>ic Browne 10:07 9:07 9:07<br />
93 93 4 32 14 22 3a 50 47 33 33<br />
Jackie Murdie 10:07 9:07 9:07<br />
93 93 4 32 14 22 3a 50 47 33 33<br />
Nick Watt 10:07 9:07 9:07<br />
93 93 4 32 14 22 3a 50 47 33 33<br />
Rosal<strong>in</strong>e Nash 10:07 9:07 9:07<br />
93 93 4 32 14 22 3a 50 47 33 33<br />
Nancy Roberts 10:06 9:06 9:06<br />
91 91 4 28 20 20 3a 45 40 33 33<br />
Tim V<strong>in</strong>cent 10:06 9:06 9:06<br />
86 86 3 18 21 16 3b 45 33 8 33<br />
Rita Tucker 10:06 9:06 9:06<br />
83 83 3 13 22 15 3b 45 27 8 33<br />
Neil Dawes 10:07 9:07 9:07<br />
80 80 2 9 23 11 3c 27 27 8 33<br />
Nathan Gill 10:07 9:07 9:07<br />
77 77 2 6 24 9 3c 27 13 8 33<br />
David Smith 10:07 9:07 9:07<br />
76 76 2 6 25 8 2- 23 13 8 33<br />
Tim Chung 10:06 9:06 9:06<br />
71 71 1 3 26 5 2- 9 7 8 33<br />
Rob Reagan 10:07 9:07 9:07<br />
71 71 1 3 26 5 2- 9 7 8 33<br />
Sarah L<strong>in</strong>g 10:06 9:06 9:06<br />
69 69 1 2 28 2 2- 9 0 0 0<br />
rd *Group Age Rank based on Standard Score Age **<strong>Maths</strong> level is an estimate **<strong>Maths</strong> of the current National Curriculum <strong>Maths</strong> level (England, Wales is and Nothern Ireland). estimate of the curre<br />
ies: ***Curriculum N Content Categories: = Number = S = Shape, Space and Measures S D = = Data Handl<strong>in</strong>g Shape, A = Algebra Space and Measures D =<br />
4
Section B: <strong>Progress</strong> <strong>in</strong> <strong>Maths</strong> 11 - Group and National Comparison<br />
School: Sample School Group: Sample Group<br />
No. Students 28<br />
Males<br />
Females<br />
All Students<br />
Comparison of Group and National Mean Standard Age Scores<br />
Number of Students<br />
Standard Age Scores<br />
16<br />
12<br />
28<br />
Mean Score Standard Deviation<br />
98.6<br />
103.2<br />
100.5<br />
22.0<br />
22.3<br />
21.8<br />
Mean Score<br />
25.3<br />
28.8<br />
26.8<br />
Raw Scores<br />
Standard<br />
Deviation<br />
15.4<br />
16.2<br />
15.6<br />
Ethnic Group Number of Students<br />
Asian<br />
Black British<br />
White<br />
Comparison of Ethnic Group Scores<br />
Standard Age Scores<br />
Mean Score Standard Deviation<br />
Mean Score<br />
Raw Scores<br />
Standard<br />
Deviation<br />
9 108.8 26.2<br />
32.6 18.5<br />
7 91.1 8.0<br />
20.3 6.3<br />
12 99.8 22.9<br />
26.3 16.4<br />
Free/Reduced Lunch Number of Students<br />
No<br />
Yes<br />
Comparison of Free School Meals category score<br />
Standard Age Scores<br />
Mean Score Standard Deviation<br />
Mean Score<br />
Raw Scores<br />
Standard<br />
Deviation<br />
24 104.8 20.6<br />
30.0 14.4<br />
4 75.0 6.3<br />
7.8 5.6<br />
Special Education Number of Students<br />
None<br />
School Action<br />
Comparison of Special Educational Needs category score<br />
Standard Age Scores<br />
Mean Score Standard Deviation<br />
Mean Score<br />
Raw Scores<br />
Standard<br />
Deviation<br />
25 103.9 20.6<br />
29.4 14.4<br />
3 72.3 4.2<br />
5.3 3.5<br />
Custom Number of Students<br />
EAL<br />
None<br />
Comparison of Custom 1 category score<br />
Standard Age Scores<br />
Mean Score Standard Deviation<br />
Mean Score<br />
Raw Scores<br />
Standard<br />
Deviation<br />
3 72.3 4.2<br />
5.3 3.5<br />
25 103.9 20.6<br />
29.4 14.4<br />
Custom Number of Students<br />
Not known<br />
Comparison of Custom 2 category score<br />
Standard Age Scores<br />
Mean Score Standard Deviation<br />
Mean Score<br />
Raw Scores<br />
Standard<br />
Deviation<br />
28 100.5 21.8<br />
26.8 15.6<br />
© GL Assessment 2008<br />
5
Section B: <strong>Progress</strong> <strong>in</strong> <strong>Maths</strong> 11 - Group and National Comparison<br />
School: Sample School Group: Sample Group<br />
No. Students 28<br />
© GL Assessment 2008<br />
6
Section B: <strong>Progress</strong> <strong>in</strong> <strong>Maths</strong> 11 - Group and National Comparison<br />
School: Sample School<br />
Group: Sample Group<br />
No. Students 28<br />
126<br />
Stan<strong>in</strong>e<br />
1<br />
2<br />
3<br />
4<br />
5<br />
6<br />
7<br />
8<br />
9<br />
Male<br />
13%<br />
13%<br />
6%<br />
38%<br />
0%<br />
6%<br />
0%<br />
13%<br />
13%<br />
Female<br />
8%<br />
8%<br />
8%<br />
25%<br />
8%<br />
0%<br />
8%<br />
25%<br />
8%<br />
All Students<br />
11%<br />
11%<br />
7%<br />
32%<br />
4%<br />
4%<br />
4%<br />
18%<br />
11%<br />
National<br />
4%<br />
7%<br />
12%<br />
17%<br />
20%<br />
17%<br />
12%<br />
7%<br />
4%<br />
© GL Assessment 2008<br />
Page 5<br />
03-Jun-2009<br />
7
Section B: <strong>Progress</strong> <strong>in</strong> <strong>Maths</strong> 11 - Analysis by Process Area<br />
School: Sample School Group: Sample Group<br />
No. Students 28<br />
© GL Assessment 2008<br />
8
Section C: <strong>Progress</strong> <strong>in</strong> <strong>Maths</strong> 11 - Question by Question Graph<br />
School: Sample School<br />
Group: Sample Group<br />
No. Students 28<br />
Note A = calculator allowable, B = calculator not allowable<br />
© GL Assessment 2008<br />
Page 7<br />
03-Jun-2009<br />
9
Section C: <strong>Progress</strong> <strong>in</strong> <strong>Maths</strong> 11 - Question by Question List<strong>in</strong>g<br />
School: Sample School Group: Sample Group<br />
No. Students 28<br />
Questions sorted by National Percentage Correct<br />
Question<br />
Number<br />
Category* Category** Question Content Group<br />
National<br />
Group -<br />
National<br />
Difference<br />
A4 96<br />
D UC Pie Chart - bags of nuts 95 1<br />
A2 96<br />
S FP Drag and drop the mirror image of an L shaped tile 95 1<br />
B1 71<br />
D R Match pupil to bar chart for number of cars <strong>in</strong> car park 94 -23<br />
B4 S FP Draw a square on the graph, one l<strong>in</strong>e drawn already 68 92 -24<br />
B5 S FP Complete the co-ord<strong>in</strong>ates of parallelogram 46 90 -44<br />
B3 68<br />
N RP What temperature is 9 degrees warmer? 89 -21<br />
A9 S UC Robot turn - 30 degrees 82 85 -3<br />
B14 S UC Click on the shape with the same area as a given shape 36 84 -48<br />
A3 A UC Use the rule to complete the miss<strong>in</strong>g rows of the table 96 82 14<br />
B2 S FP What temperature does the thermometer show? 71 81 -10<br />
Van can carry 192 boxes. How many vans are needed for<br />
A5 N RP<br />
89<br />
62400?<br />
Cont<strong>in</strong>ue the sequence where the numbers are go<strong>in</strong>g up <strong>in</strong><br />
steps of 0.1<br />
Use the graph to estimate how much the puppy weighed at<br />
2 1/2 weeks<br />
B15 N RP<br />
36<br />
B7 D RP<br />
39<br />
80 9<br />
79 -43<br />
77 -38<br />
B16 D RP How many more games did the Stars w<strong>in</strong> over Rovers? 36 75 -39<br />
B8 N UC Click on the value of 3 <strong>in</strong> 637.082 39 75 -36<br />
B26 S FP Fill <strong>in</strong> the areas of 3 small rectangles 11 71 -60<br />
A1i N RP Fill <strong>in</strong> the gaps ?-168=45. 100 70 30<br />
B6 D UC Plot 500 grams on the graph for 1 week old puppy 39 69 -30<br />
B18 32<br />
S FP What is the greatest speed? 68 -36<br />
B9 39<br />
D RP Data on recycl<strong>in</strong>g - which towns have no paper bank? 68 -29<br />
B19 S R Click on the net that will fold up to make a cube 32 66 -34<br />
B17 D RP Which two teams had the same number of draws? 32 66 -34<br />
Complete the miss<strong>in</strong>g rows of the table for the total money<br />
A6 N RP<br />
89<br />
raised<br />
66 23<br />
A1ii N RP Fill <strong>in</strong> the gaps ?/168=45 100 64 36<br />
B21i N R Use 15x20=300 to answer 15x21= 29 63 -34<br />
What is Sam's number if he divides it by 100 to get the<br />
B28 N RP<br />
11<br />
answer 6.2?<br />
61 -50<br />
A8 86<br />
N RP 1 bus=49 people. How many buses for 379 people? 61 25<br />
1 part orange, 5 parts water. 50 millilitres of orange to how<br />
A7 N/S RP<br />
89<br />
much water?<br />
61 28<br />
B23 A RP Write an expression for the area of a pattern 29 59 -30<br />
B11 S FP Copy the diagram exactly 39 58 -19<br />
Match each pair of rectangles whose shaded parts make<br />
B20 N R<br />
32<br />
one whole rectangle<br />
55 -23<br />
B24 A RP Write an expression for the area of another pattern 29 54 -25<br />
B21ii N R Use 15x20=300 to answer 15x19= 29 54 -25<br />
B13 36<br />
N/S RP How many kilograms does the suitcase weigh? 53 -17<br />
B10 N UC Click to make 80% blue 39 51 -12<br />
B22 N RP 5000 tickets on a full roll. 3279 sold so how many left 29 49 -20<br />
A13 N R ? divided by 22=2.18181818 79 47 32<br />
B12 D R Pie Chart - sandwiches sold 36 46 -10<br />
To multiply by 4, double then double aga<strong>in</strong> - show rule to<br />
B25 N R<br />
25<br />
multiply by 8<br />
45 -20<br />
A11 79<br />
N UC Click on the shapes that are 1/3 yellow 41 38<br />
*Curriculum Content Categories: N = Number S = Shape, Space and Measures D = Data Handl<strong>in</strong>g A = Algebra<br />
**Process Categories: FP = Know<strong>in</strong>g Facts and Procedures UC = Us<strong>in</strong>g Concepts RP = Solv<strong>in</strong>g Rout<strong>in</strong>e Problems R = Reason<strong>in</strong>g<br />
© GL Assessment 2008<br />
10
Section C: <strong>Progress</strong> <strong>in</strong> <strong>Maths</strong> 11 - Questions List<strong>in</strong>g by Group-National Difference<br />
School: Sample School Group: Sample Group<br />
No. Students 28<br />
Questions sorted by Group - National Percentage Difference<br />
Question<br />
Number<br />
Category* Category** Question Content Group<br />
National<br />
Group -<br />
National<br />
Difference<br />
A14 S RP Volume of cuboid 75 22 53<br />
A10 S UC Robot turn - 150 degrees 82 29 53<br />
A15 71<br />
D FP Which type of fruit had the greatest mean weight per fruit? 27 44<br />
12 pens <strong>in</strong> a pack, 48 packs <strong>in</strong> a box, 96 boxes. How<br />
A12 N RP<br />
79<br />
many pens?<br />
36 43<br />
A11 N UC Click on the shapes that are 1/3 yellow 79 41 38<br />
A1ii N RP Fill <strong>in</strong> the gaps ?/168=45 100 64 36<br />
A13 N R ? divided by 22=2.18181818 79 47 32<br />
A1i N RP Fill <strong>in</strong> the gaps ?-168=45. 100 70 30<br />
1 part orange, 5 parts water. 50 millilitres of orange to how<br />
A7 N/S RP<br />
89<br />
much water?<br />
61 28<br />
A8 86<br />
N RP 1 bus=49 people. How many buses for 379 people? 61 25<br />
Complete the miss<strong>in</strong>g rows of the table for the total money<br />
A6 N RP<br />
89<br />
raised<br />
66 23<br />
A3 96<br />
A UC Use the rule to complete the miss<strong>in</strong>g rows of the table 82 14<br />
Van can carry 192 boxes. How many vans are needed for<br />
A5 N RP<br />
89<br />
62400?<br />
80 9<br />
A2 96<br />
S FP Drag and drop the mirror image of an L shaped tile 95 1<br />
A4 96<br />
D UC Pie Chart - bags of nuts 95 1<br />
A9 S UC Robot turn - 30 degrees 82 85 -3<br />
B2 S FP What temperature does the thermometer show? 71 81 -10<br />
B12 D R Pie Chart - sandwiches sold 36 46 -10<br />
B10 N UC Click to make 80% blue 39 51 -12<br />
B13 36<br />
N/S RP How many kilograms does the suitcase weigh? 53 -17<br />
B11 39<br />
S FP Copy the diagram exactly 58 -19<br />
To multiply by 4, double then double aga<strong>in</strong> - show rule to<br />
B25 N R<br />
25<br />
multiply by 8<br />
45 -20<br />
B22 N RP 5000 tickets on a full roll. 3279 sold so how many left 29 49 -20<br />
B3 N RP What temperature is 9 degrees warmer? 68 89 -21<br />
Match each pair of rectangles whose shaded parts make<br />
B20 N R<br />
32<br />
one whole rectangle<br />
55 -23<br />
B1 D R Match pupil to bar chart for number of cars <strong>in</strong> car park 71 94 -23<br />
B29 D R Complete the chart so that the mean of all bars is 5 units 4 27 -23<br />
B4 S FP Draw a square on the graph, one l<strong>in</strong>e drawn already 68 92 -24<br />
B24 A RP Write an expression for the area of another pattern 29 54 -25<br />
B21ii 29<br />
N R Use 15x20=300 to answer 15x19= 54 -25<br />
Drag & drop two straight l<strong>in</strong>es to make rectangles of 18, 6<br />
B27 S RP<br />
11<br />
and 6 cm²<br />
40 -29<br />
B9 D RP Data on recycl<strong>in</strong>g - which towns have no paper bank? 39 68 -29<br />
B6 D UC Plot 500 grams on the graph for 1 week old puppy 39 69 -30<br />
B23 A RP Write an expression for the area of a pattern 29 59 -30<br />
B19 S R Click on the net that will fold up to make a cube 32 66 -34<br />
B17 D RP Which two teams had the same number of draws? 32 66 -34<br />
B21i N R Use 15x20=300 to answer 15x21= 29 63 -34<br />
B18 32<br />
S FP What is the greatest speed? 68 -36<br />
B8 N UC Click on the value of 3 <strong>in</strong> 637.082 39 75 -36<br />
B7 D RP Use the graph to estimate how much the puppy weighed at 39 77 -38<br />
*Curriculum Content Categories: N = Number S = Shape, Space and Measures D = Data Handl<strong>in</strong>g A = Algebra<br />
**Process Categories: FP = Know<strong>in</strong>g Facts and Procedures UC = Us<strong>in</strong>g Concepts RP = Solv<strong>in</strong>g Rout<strong>in</strong>e Problems R = Reason<strong>in</strong>g<br />
© GL Assessment 2008<br />
11
Section C: <strong>Progress</strong> <strong>in</strong> <strong>Maths</strong> 11 - Score breakdown<br />
School: Sample School Group: Sample Group<br />
No. Students 28<br />
**Score Breakdown by Process Categories<br />
Category Area Category Code Number of Marks Group % National % Difference<br />
Know<strong>in</strong>g Facts and Procedures FP 8 55 73 -18<br />
Us<strong>in</strong>g Concepts UC 10 67 65 2<br />
Solv<strong>in</strong>g Rout<strong>in</strong>e Problems RP 20 55 62 -7<br />
Reason<strong>in</strong>g R 12 40 58 -18<br />
*Score breakdown by Curriculum Content Categories<br />
Category Area Category Code Number of Marks Group % National % Difference<br />
Number N 22 58 59 -1<br />
Shape, Space and Measures S 15 54 66 -12<br />
Data Handl<strong>in</strong>g D 12 48 65 -17<br />
Algebra A 3 51 65 -14<br />
© GL Assessment 2008<br />
12
<strong>Progress</strong> <strong>in</strong> <strong>Maths</strong> Reports<br />
School: Sample School Section:<br />
Class/Group: Sample Group<br />
A, B, C<br />
Section A - Comparison of Group Scores<br />
<strong>Progress</strong> <strong>in</strong> <strong>Maths</strong><br />
Year On Year<br />
Comparisons<br />
The table shows the mean Standard Age Scores (SAS) for each of the two <strong>Progress</strong> <strong>in</strong> <strong>Maths</strong> tests and the<br />
mean score difference between the tests for each group of pupils. A SAS comes from compar<strong>in</strong>g a pupil's<br />
raw score with the national standardisation sample, tak<strong>in</strong>g chronological age <strong>in</strong>to account. This shows how<br />
each pupil is perform<strong>in</strong>g compared to the national average for their age. The national average SAS is 100.<br />
The table below shows the number of pupils complet<strong>in</strong>g each test as well the number of pupils complet<strong>in</strong>g<br />
both tests.<br />
Number of pupils<br />
<strong>PiM</strong> 11 <strong>PiM</strong> 10 Complet<strong>in</strong>g both tests<br />
28 28<br />
28<br />
The chart shows the average SAS scores for each test (red dot) with 80% confidence bands (black<br />
horizontal l<strong>in</strong>e). Confidence bands are not displayed for groups with less than 5 pupils as these are usually<br />
very wide when there are few pupils. If the black horizontal l<strong>in</strong>e overlaps the national '100' l<strong>in</strong>e the results for<br />
your group do not differ significantly from the national average. The chart also shows the score distribution<br />
displayed as a box and whisker plot for each group of pupils. The graphic below shows an example for a<br />
group of pupils. Half the pupils have scores with<strong>in</strong> the box range which <strong>in</strong> this example is between 90 and<br />
110. It also shows that that 5% of pupils have SAS scores below 80, 25% have scores below 90, 50% have<br />
scores below 105 (vertical black l<strong>in</strong>e), 75% below 110 and 95% below 125.<br />
SAS Score Distribution<br />
60 70 80 90 100 110 120 130 140<br />
5% 25% 50%75% 95%<br />
© GL Assessment 2008<br />
GL Assessment is part of the Granada Learn<strong>in</strong>g Group.<br />
13
<strong>Progress</strong> <strong>in</strong> <strong>Maths</strong> Reports<br />
School: Sample School Section:<br />
Class/Group: Sample Group<br />
A, B, C<br />
Section B - <strong>Progress</strong> Chart and Summary table<br />
The <strong>Progress</strong> chart displays the two SAS scores for each pupil as a dot <strong>in</strong> a scatter plot. There should be<br />
one dot for each pupil except for pupils that have the same values on both tests and the dots will overlap.<br />
The range of expected scores on the second test are <strong>in</strong>dicated by the upper and lower dashed red l<strong>in</strong>es.<br />
<strong>Progress</strong> <strong>in</strong> <strong>Maths</strong><br />
Year On Year<br />
Comparisons<br />
Nationally, around 70% of pupils are expected to be with<strong>in</strong> this range. Where a pupil's score is above the<br />
upper red dashed l<strong>in</strong>e they have made significantly more progress than expected, where their score is below<br />
the lower red dashed l<strong>in</strong>e they have made significantly less progress than expected. 15% of pupils<br />
nationally are above the upper red dashed l<strong>in</strong>e and a further 15% below the lower red dashed l<strong>in</strong>e.<br />
Section C - Pupil List<strong>in</strong>g Ordered by Surname<br />
The list<strong>in</strong>g <strong>in</strong>cludes pupil’s SAS scores on each test as well the difference <strong>in</strong> SAS scores. The progress<br />
category <strong>in</strong>dicates if a pupil progress based on the SAS score is <strong>in</strong> the ‘As Expected’, ‘Upper’ or ‘Lower’<br />
categories. Nationally, around 70% of pupils are expected to be <strong>in</strong> the ‘As Expected’ category’ , 15% of<br />
pupils <strong>in</strong> the ‘Upper’ category and a further 15% <strong>in</strong> the ‘Lower’ category. The list<strong>in</strong>g <strong>in</strong>cludes pupils that<br />
have completed just one of the two tests and no progress categories are reported for these pupils.<br />
© GL Assessment 2008<br />
GL Assessment is part of the Granada Learn<strong>in</strong>g Group.<br />
14
PIM<br />
Comparison of Group Scores<br />
Section A<br />
School: Sample School<br />
Year on Year <strong>PiM</strong><br />
Group: Sample Group Number of Pupils: 28<br />
Number<br />
of pupils<br />
Mean Standard Age Scores<br />
Mean Raw Scores<br />
<strong>PiM</strong> 10 <strong>PiM</strong> 11 Difference <strong>PiM</strong> 10 <strong>PiM</strong> 11<br />
All Students 28<br />
103.3 100.5 -2.8 24.2 26.8<br />
Gender<br />
Male 16 104.1 98.6 -5.5 24.9 25.2<br />
Female 12 102.3 103.2 0.8 23.4 28.8<br />
White 12 95.3 99.8 4.5 18.3 26.2<br />
Ethnic Group<br />
Asian 9 115.6 108.8 -6.8 32.8 32.6<br />
Black British 7 101.3 91.1 -10.1 23.4 20.3<br />
Free School Meals<br />
No 24 108.0 104.8 -3.2 27.6 30.0<br />
Yes 4 75.2 75.0 -0.2 4.2 7.8<br />
Special Education<br />
None 25 107.0 103.9 -3.1 26.9 29.4<br />
School Action 3 72.7 72.3 -0.3 2.3 5.3<br />
Custom 1<br />
None 25 107.0 103.9 -3.1 26.9 29.4<br />
EAL 3 72.7 72.3 -0.3 2.3 5.3<br />
Custom 2 Not known 28 103.3 100.5 -2.8 24.2 26.8<br />
Note: results <strong>in</strong> the table are based on pupils that have completed both tests.<br />
© GL Assessment 2008<br />
GL Assessment is part of the Granada Learn<strong>in</strong>g Group.<br />
15
PIM<br />
Group Demographic Comparison Graphs<br />
Section A<br />
School: Sample School<br />
Year on Year <strong>PiM</strong><br />
Group: Sample Group Number of Pupils: 28<br />
Number<br />
of pupils<br />
Standard Age Score: <strong>PiM</strong> 10<br />
Standard Age Score: <strong>PiM</strong> 11<br />
60 70 80 90 100 110 120 130 140 60 70 80 90 100 110 120 130 140<br />
All Students<br />
28<br />
Gender<br />
Male 16<br />
Female 12<br />
White 12<br />
Ethnic Group<br />
Asian 9<br />
Black British 7<br />
Free School Meals<br />
Special Education<br />
Custom 1<br />
No 24<br />
Yes 4<br />
None 25<br />
School Action 3<br />
None 25<br />
EAL 3<br />
Custom 2 Not known 28<br />
Note: results <strong>in</strong> the table are based on pupils that have completed both tests.<br />
© GL Assessment 2008<br />
GL Assessment is part of the Granada Learn<strong>in</strong>g Group.<br />
16
PIM<br />
<strong>Progress</strong> Chart Section B<br />
School: Sample School<br />
Year on Year <strong>PiM</strong><br />
Group: Sample Group Number of Pupils: 28<br />
Notes:<br />
(1) The x-axis gives a pupil's score on the<br />
first test <strong>in</strong> the series and the y-axis gives<br />
their score on the second test <strong>in</strong> the series.<br />
Each pupil's scores are plotted as a dot.<br />
There should be one dot for each pupil,<br />
except where two pupils have identical<br />
scores on both tests and their dots will<br />
overlap.<br />
(2) Pupils are not expected to achieve<br />
exactly the same score on both occasions.<br />
The range of expected scores on the<br />
second test is <strong>in</strong>dicated by the upper and<br />
lower dashed l<strong>in</strong>es. Nationally, around 70%<br />
of pupils are expect to be with<strong>in</strong> this range.<br />
Where a pupil's score is above the upper<br />
red dashed l<strong>in</strong>e they have made<br />
significantly more progress than expected,<br />
where their score is below the lower red<br />
dashed l<strong>in</strong>e they have made significantly<br />
less progress than expected. 15% of pupils<br />
nationally are above the upper red dashed<br />
l<strong>in</strong>e and a further 15% below the lower red<br />
dashed l<strong>in</strong>e.<br />
© GL Assessment 2008<br />
GL Assessment is part of the Granada Learn<strong>in</strong>g Group.<br />
17
PIM<br />
School: Sample School<br />
Summary Table<br />
Section B<br />
Year on Year <strong>PiM</strong><br />
Group: Sample Group Number of Pupils: 28<br />
<strong>PiM</strong> 10<br />
Group<br />
National<br />
Mean Standard Age Score<br />
Standard Deviation<br />
103.3<br />
18.9<br />
<strong>Progress</strong><br />
Category<br />
Number of<br />
pupils<br />
%<br />
%<br />
<strong>PiM</strong> 11<br />
Lower<br />
6<br />
21%<br />
15%<br />
Mean Standard Age Score<br />
100.5<br />
As Expected<br />
18<br />
64%<br />
70%<br />
Standard Deviation<br />
Difference<br />
Difference Between Mean Scores<br />
21.8<br />
-2.8<br />
Upper<br />
Total<br />
4<br />
28<br />
14%<br />
100%<br />
15%<br />
100%<br />
The above table is based on 28 students complet<strong>in</strong>g both tests<br />
© GL Assessment 2008<br />
GL Assessment is part of the Granada Learn<strong>in</strong>g Group.<br />
18
PIM<br />
Pupil List<strong>in</strong>g Ordered by Surname<br />
Section C<br />
School: Sample School<br />
Year On Year <strong>PiM</strong><br />
Group: Sample Group Number of Pupils tak<strong>in</strong>g at least one test: 28<br />
Forename<br />
Surname<br />
Date of Birth<br />
UK <strong>PiM</strong> 10<br />
SAS Score<br />
UK <strong>PiM</strong> 11<br />
SAS Score<br />
Difference <strong>in</strong> SAS<br />
Scores<br />
<strong>Progress</strong> Category<br />
Tom Albright<br />
22/10/1999 114<br />
108 -6<br />
As Expected<br />
Mary Aransiola<br />
16/10/1999 114<br />
103 -11<br />
As Expected<br />
Daniel Browne<br />
06/10/1999 90<br />
138 48<br />
Upper<br />
Dom<strong>in</strong>ic Browne<br />
14/10/1999 94<br />
93 -1<br />
As Expected<br />
Susan Bush<br />
25/10/1999 124<br />
126 2<br />
As Expected<br />
Tim Chung<br />
23/10/1999 114<br />
71 -43<br />
Lower<br />
Neil Dawes<br />
02/10/1999 83<br />
80 -3<br />
As Expected<br />
Adrian Fowler<br />
13/10/1999 103<br />
94 -9<br />
As Expected<br />
Nathan Gill<br />
15/10/1999 69<br />
77 8<br />
As Expected<br />
Maureen Kennedy<br />
27/10/1999 120<br />
126 6<br />
Upper<br />
Kareena Khan<br />
21/10/1999 108<br />
113 5<br />
As Expected<br />
Sarah L<strong>in</strong>g<br />
24/10/1999 80<br />
69 -11<br />
Lower<br />
Richard Mathews<br />
19/10/1999 114<br />
93 -21<br />
Lower<br />
Nita Moss<br />
04/10/1999 82<br />
126 44<br />
Upper<br />
Jackie Murdie<br />
10/10/1999 101<br />
93 -8<br />
As Expected<br />
Florence Nash<br />
11/10/1999 94<br />
93 -1<br />
As Expected<br />
Rosal<strong>in</strong>e Nash<br />
08/10/1999 102<br />
93 -9<br />
As Expected<br />
Rob Reagan<br />
05/10/1999 69<br />
71 2<br />
As Expected<br />
Nancy Roberts<br />
17/10/1999 114<br />
91 -23<br />
Lower<br />
Robert Rob<strong>in</strong>son<br />
26/10/1999 131<br />
126 -5<br />
As Expected<br />
Sanjay Rooprai<br />
29/10/1999 138<br />
123 -15<br />
As Expected<br />
Sandeep Sharma<br />
28/10/1999 138<br />
138 0<br />
As Expected<br />
Mandeep S<strong>in</strong>gh<br />
20/10/1999 114<br />
138 24<br />
Upper<br />
David Smith<br />
03/10/1999 83<br />
76 -7<br />
Lower<br />
Rita Tucker<br />
07/10/1999 83<br />
83 0<br />
As Expected<br />
Tim V<strong>in</strong>cent<br />
18/10/1999 114<br />
86 -28<br />
Lower<br />
Nick Watt<br />
09/10/1999 102<br />
93 -9<br />
As Expected<br />
Peter Watt<br />
12/10/1999 101<br />
94 -7<br />
As Expected<br />
© GL Assessment 2008<br />
GL Assessment is part of the Granada Learn<strong>in</strong>g Group.<br />
19
<strong>Progress</strong> <strong>in</strong> <strong>Maths</strong> 11 <strong>Digital</strong><br />
PIM 11 <strong>Digital</strong> mapp<strong>in</strong>g to APP Levels 3 to 6<br />
Blue: very similiar to written question (n) Red: unique to digital test only<br />
Question A N C U S H Level Assessment Focuses<br />
1a (1a) 1 3 solve whole number problems<br />
1b (1b) 1 4 recognise … relationships<br />
2 (2) 1 3 reflect shapes, presented on a grid, <strong>in</strong> a vertical or horizontal mirror l<strong>in</strong>e<br />
3 (3a) 1 4 beg<strong>in</strong> to use simple formulae expressed <strong>in</strong> words<br />
4 1 3 extract and <strong>in</strong>terpret <strong>in</strong>formation presented <strong>in</strong> simple tables<br />
5 (4) 1 4 solve whole number problems <strong>in</strong>clud<strong>in</strong>g those <strong>in</strong>volv<strong>in</strong>g multiplication or division that may give rise to rema<strong>in</strong>ders<br />
(Lev 3, extrapolated up to level 4)<br />
6 (6) 1 3 solve whole number problems<br />
7 (7) 1 5 solve simple problems <strong>in</strong>volv<strong>in</strong>g ratio and direct proportion<br />
8 (8) 1 5 solve problems with or without a calculator (Lev 4, extrapolated up to level 5)<br />
9 1 4 beg<strong>in</strong> to rotate a simple shape or object about its centre<br />
10 1 5 use language associated with angle<br />
11 (9) 2 4 recognise approximate proportions of a whole and use simple fractions and percentages to describe these<br />
12 (10) 1 5 solve word problems and <strong>in</strong>vestigations from a range of contexts<br />
13 (11) 1 5 recognise and use number … relationships<br />
14 1 5 calculate volumes … of cuboids (Lev 6, extrapolated down to level 5)<br />
15 (12) 1 5 understand and use the mean of discrete data<br />
PART B<br />
1 (13) 2 3 extract and <strong>in</strong>terpret <strong>in</strong>formation presented <strong>in</strong> … bar charts<br />
2 (14a) 1 3 use a wider range of measures <strong>in</strong>clud<strong>in</strong>g … standard metric units … <strong>in</strong> a range of contexts<br />
3 (14b) 1 4 solve simple problems <strong>in</strong>volv<strong>in</strong>g order<strong>in</strong>g, add<strong>in</strong>g, subtract<strong>in</strong>g negative numbers <strong>in</strong> context<br />
4 (15a) 1 3 classify … 2-D shapes <strong>in</strong> various ways us<strong>in</strong>g mathematical properties<br />
5 1 4 use and <strong>in</strong>terpret coord<strong>in</strong>ates <strong>in</strong> the first quadrant<br />
6 (16b) 1 4 construct … simple l<strong>in</strong>e graphs<br />
7 (16a) 1 4 <strong>in</strong>terpret … simple l<strong>in</strong>e graphs<br />
8 (18) 1 4 order decimals to three decimal places<br />
9 1 4 extract and <strong>in</strong>terpret <strong>in</strong>formation presented <strong>in</strong> simple … pictograms (Lev 3, extrapolated up to level 4)<br />
10 1 4 recognise approximate proportions of a whole and use simple … percentages to describe these<br />
11 1 4 use the properties of 2-D and 3-D shapes<br />
12 2 3 construct bar charts<br />
13 (20) 1 5 read and <strong>in</strong>terpret scales on a range of measur<strong>in</strong>g <strong>in</strong>struments<br />
14 (21) 1 3 f<strong>in</strong>d areas by count<strong>in</strong>g squares (Lev 4, extrapolated down to level 3)<br />
15 (22) 1 4 use understand<strong>in</strong>g of place value (Lev 5, extrapolated down to level 4)<br />
16 (23a) 1 4 <strong>in</strong>terpret graphs and diagrams, … and draw conclusions (Lev 5, extrapolated down to level 4)<br />
Cont<strong>in</strong>ued....<br />
20
<strong>Progress</strong> <strong>in</strong> <strong>Maths</strong> Reports<br />
<strong>Progress</strong> <strong>in</strong> <strong>Maths</strong> 11 <strong>Digital</strong> ... cont<strong>in</strong>ued<br />
PIM 11 <strong>Digital</strong> mapp<strong>in</strong>g to APP Levels 3 to 6<br />
Question A N C U S H Level Assessment Focuses<br />
17 (23b) 1 4 <strong>in</strong>terpret graphs and diagrams, … and draw conclusions (Lev 5, extrapolated down to level 4)<br />
18 1 4 collect and record discrete data<br />
19 (24) 1 4 use the properties of 2-D and 3-D shapes<br />
<strong>Progress</strong><br />
20 (25) 2<br />
<strong>in</strong><br />
4 recognise approximate proportions of a whole<br />
21i (26i) 1 3 use efficient written methods of addition and subtraction and of short multiplication and division conclusions<br />
(Lev 4, extrapolated down to level 3)<br />
21ii (26ii) 1 4 use efficient written methods of addition and subtraction and of short multiplication and division<br />
<strong>Maths</strong> 11<br />
22 (27) 1 4 solve problems with or without a calculator<br />
23 (28i) 1<br />
Space<br />
5<br />
and Measures,<br />
construct, express<br />
Data<br />
<strong>in</strong>Handl<strong>in</strong>g symbolic form,<br />
and<br />
andAlgebra.<br />
use simple formulae <strong>in</strong>volv<strong>in</strong>g one or two operations<br />
24 (28ii) 1 5 construct, express <strong>in</strong> symbolic form, and use simple formulae <strong>in</strong>volv<strong>in</strong>g one or two operations<br />
25 (29) 1 4 use a range of mental methods of computation with all operations<br />
26 (30a) 1 4 f<strong>in</strong>d areas by count<strong>in</strong>g squares<br />
27 (30b) 1 4 f<strong>in</strong>d areas by count<strong>in</strong>g squares<br />
School: Sample School Section: A, B, C<br />
Class/Group: Blue: Sample very similiar Group to written question (n) Red: unique to digital test only No. of students: 28<br />
Section A - Student list<strong>in</strong>g<br />
This report lists the results for each student from the selected group of students who took the test. Scores<br />
for each student are shown <strong>in</strong>clud<strong>in</strong>g Standard Age Score (SAS), Stan<strong>in</strong>e, National Percentile Rank, Group<br />
Rank, Raw Score and estimated National Curriculum <strong>Maths</strong> Levels for England, Wales and Northern<br />
Ireland. Some of the levels are split <strong>in</strong>to three categories (C,B and A) with A denot<strong>in</strong>g the highest category<br />
with<strong>in</strong> a level. This section also shows student performance <strong>in</strong> the content categories of Number, Shape,<br />
Section B - Comparison of Group and National Scores<br />
The table shows the mean scores and the standard deviations for Standard Age Scores and raw scores for<br />
each group of students. The first chart <strong>in</strong> this section show the average SAS scores for your groups with<br />
80% confidence bands <strong>in</strong>dicated by the horizontal l<strong>in</strong>es. If the horizontal l<strong>in</strong>e on the mean Standard Age<br />
Score score chart overlaps the National "100" (average) l<strong>in</strong>e, the results for your group do not differ<br />
significantly from the National average.<br />
28 (31) 1 5 use understand<strong>in</strong>g of place value to multiply and divide whole numbers and decimals by 10, 100 and 1000 and expla<strong>in</strong> the effect<br />
29 (32) 1 6 understand and use the mean of discrete data (Lev 5, extrapolated up to level 6)<br />
he first bar chart shows the percentage of students that fall with<strong>in</strong> certa<strong>in</strong> ranges of scores. The charts allow<br />
you to compare the score distribution of your group with the National distributions. The second bar chart<br />
shows the percentage success rates for each of the process areas for the class/group aga<strong>in</strong>st the National<br />
average. In some cases, the profile for the class may be above the National average, or below the National<br />
average, <strong>in</strong> all process areas. In other cases, the results may reveal strengths <strong>in</strong> one particular process<br />
area, but a relative weakness <strong>in</strong> another.<br />
A: Algebra<br />
N: Numbers and the number system<br />
C: Calculat<strong>in</strong>g<br />
U: Us<strong>in</strong>g and apply<strong>in</strong>g mathematics<br />
S: Shape, space and measures<br />
H: Handl<strong>in</strong>g data<br />
Copyright © 2008 GL Assessment Limited<br />
ment is part of the Granada Learn<strong>in</strong>g Group.<br />
Section C - Question by question analysis<br />
The graphs and tables <strong>in</strong> this section provide details about the success rates the class/group has with each<br />
question. The questions your class/group f<strong>in</strong>d most difficult and which were relatively easy can be identified.<br />
21
case study<br />
Onl<strong>in</strong>e test<strong>in</strong>g enhances pupil progress<br />
check<strong>in</strong>g <strong>in</strong> Leicestershire<br />
The Government is encourag<strong>in</strong>g schools to focus on a<br />
balanced comb<strong>in</strong>ation of end of Key Stage assessment<br />
and more regular, teacher-based methods of check<strong>in</strong>g<br />
their pupils’ achievement <strong>in</strong> key curriculum subjects to<br />
raise atta<strong>in</strong>ment.<br />
This ethos is central to the way pupils’ progress is<br />
monitored at Christchurch and St Peters C of E Primary<br />
School. Headteacher, Sandy Gourlay, has been us<strong>in</strong>g the<br />
digital versions of GL Assessment’s <strong>Progress</strong> <strong>in</strong> English<br />
(PIE) and <strong>Progress</strong> <strong>in</strong> <strong>Maths</strong> (PIM) tests to assist teachers <strong>in</strong><br />
track<strong>in</strong>g their pupils’ progress <strong>in</strong> these crucial subjects as<br />
they move through the school.<br />
Christchurch and St Peters is located <strong>in</strong> the village of<br />
Mountsorrel <strong>in</strong> Leicestershire. Attended by 360 five to 11-<br />
year-olds, the school is committed to creat<strong>in</strong>g a happy and<br />
stimulat<strong>in</strong>g environment <strong>in</strong> which its pupils can fulfil their<br />
academic potential. The leadership team works hard to<br />
ensure every child is provided with teach<strong>in</strong>g and learn<strong>in</strong>g<br />
that meets their <strong>in</strong>dividual needs when they jo<strong>in</strong> the school.<br />
Us<strong>in</strong>g PIE and PIM <strong>Digital</strong> to <strong>in</strong>form discussions on pupils’<br />
progress <strong>in</strong> English and maths plays an important role <strong>in</strong><br />
help<strong>in</strong>g them to achieve this goal.<br />
“The reports we get from the onl<strong>in</strong>e tests<br />
are excellent. They provide us with valuable<br />
data that teachers can use to shape their<br />
lessons and it also helps us to demonstrate<br />
the value added to pupils’ learn<strong>in</strong>g whilst<br />
they are at the school.”<br />
Sandy Gourlay says: “The onl<strong>in</strong>e tests enable us to get a<br />
clear picture of our pupils’ strengths and weaknesses <strong>in</strong><br />
English and maths as they learn, without putt<strong>in</strong>g them under<br />
the pressure of a traditional paper test. The ability to assess<br />
pupils’ progress easily at the start of each year allows us to<br />
be more effective <strong>in</strong> the way we allocate teach<strong>in</strong>g resources<br />
and helps us to <strong>in</strong>tervene early to address any concerns we<br />
have with the achievement of <strong>in</strong>dividuals or groups of<br />
pupils.”<br />
Previously, the paper-based versions of PIE and PIM were<br />
be<strong>in</strong>g used at the school to test pupils’ understand<strong>in</strong>g of<br />
English and maths. The decision to switch to onl<strong>in</strong>e test<strong>in</strong>g<br />
has made it simpler for teachers to monitor pupils’ progress<br />
year-on-year from Years 1 to 6 and helped ensure the school<br />
can tailor teach<strong>in</strong>g and learn<strong>in</strong>g to get the best out of every<br />
child.<br />
The digital versions of PIE and PIM are simple to adm<strong>in</strong>ister<br />
and schools are provided with a wealth of <strong>in</strong>formation on<br />
pupils’ comprehension of English and maths with<strong>in</strong> m<strong>in</strong>utes<br />
of their completion of the assessments. The tests enable<br />
schools to view pupils’ standard age scores and compare<br />
the achievement of <strong>in</strong>dividuals or groups of children with<br />
national levels of atta<strong>in</strong>ment. Detailed analysis of pupils’<br />
answers allows school leaders to clearly see if girls are out<br />
perform<strong>in</strong>g boys <strong>in</strong> literacy, for example, or whether a<br />
particular group of children are struggl<strong>in</strong>g with a specific<br />
area of the maths curriculum.<br />
The ability to scrut<strong>in</strong>ise pupils’ scores quickly proved to be<br />
<strong>in</strong>credibly helpful to Christchurch and St Peters when results<br />
of the PIE test revealed that a significant number of children<br />
had not reached the standard of achievement expected for<br />
their age at the start of Year 4. The leadership team was able<br />
to use this <strong>in</strong>formation to target additional learn<strong>in</strong>g support<br />
where it was needed so that gaps <strong>in</strong> pupils’ knowledge of<br />
the subject could be addressed to boost atta<strong>in</strong>ment.<br />
“Look<strong>in</strong>g closely at pupils’ results year-on-year allows us to<br />
let teachers know if <strong>in</strong>dividuals or groups of pupils who will<br />
be jo<strong>in</strong><strong>in</strong>g their class from the previous year group are likely<br />
to need help with areas of the English and maths<br />
curriculum. This means that we can be one step ahead <strong>in</strong><br />
ensur<strong>in</strong>g lessons are personalised to meet the needs of<br />
every child.”<br />
“The reports we get from the onl<strong>in</strong>e tests are excellent.<br />
They provide us with valuable data, such as group national<br />
scores and detailed <strong>in</strong>formation on how our pupils have<br />
answered the <strong>in</strong>dividual questions. This is data teachers can<br />
use to shape their lessons and it also helps us to<br />
demonstrate the value added to pupils’ learn<strong>in</strong>g whilst they<br />
are at the school,” says Sandy.<br />
Christchurch and St Peters keeps a record of PIE and PIM<br />
results for pupils from across the school and this <strong>in</strong>formation<br />
plays an important part <strong>in</strong> the process of prepar<strong>in</strong>g for an<br />
Ofsted <strong>in</strong>spection. Results are shared with Ofsted<br />
<strong>in</strong>spectors and they also help the school to carry out an<br />
effective self-evaluation of its teach<strong>in</strong>g and learn<strong>in</strong>g provision<br />
throughout the academic year.<br />
“Look<strong>in</strong>g closely at pupils’ results year-onyear<br />
allows us to let teachers know if<br />
<strong>in</strong>dividuals or groups of pupils who will be<br />
jo<strong>in</strong><strong>in</strong>g their class from the previous year<br />
group are likely to need help with areas of<br />
the English and maths curriculum.”<br />
“We have good teachers who teach well and the tests help<br />
to confirm what they already know about their pupils’ ability.<br />
By exam<strong>in</strong><strong>in</strong>g the PIE and PIM onl<strong>in</strong>e test scores <strong>in</strong><br />
conjunction with national assessment results, we can<br />
ensure there are no surprises <strong>in</strong> teachers’ understand<strong>in</strong>g of<br />
what pupils are capable of achiev<strong>in</strong>g. This helps ensure they<br />
can provide every child with the best possible learn<strong>in</strong>g<br />
support throughout the essential primary years.”<br />
April 2009<br />
22
case study<br />
How onl<strong>in</strong>e tests are used to monitor progress<br />
at Handcross Park School<br />
Handcross Park Independent Prep School <strong>in</strong>West<br />
Sussex has a deserved reputation for provid<strong>in</strong>g high<br />
standards of childcare for 2 – 13 year olds.The school<br />
prides itself on achiev<strong>in</strong>g excellence <strong>in</strong> all areas and<br />
assessment is a key aspect of <strong>in</strong>form<strong>in</strong>g teach<strong>in</strong>g and<br />
learn<strong>in</strong>g across the whole school.<br />
In the Autumn term of 2007, Handcross Park decided to<br />
adopt a suite of onl<strong>in</strong>e reason<strong>in</strong>g, literacy and numeracy<br />
assessments from GL Assessment <strong>in</strong> order to provide an<br />
efficient method of assess<strong>in</strong>g pupils and collat<strong>in</strong>g results.<br />
Neil Cheesman, Deputy Head Teacher, noticed the<br />
difference immediately.<br />
“We <strong>in</strong>stantly saw a huge reduction <strong>in</strong> the time it took to<br />
analyse results. Onl<strong>in</strong>e assessment provides results with<strong>in</strong><br />
m<strong>in</strong>utes and saves a great deal of time previously taken up<br />
by mark<strong>in</strong>g written assessments.”<br />
However, not only was the school new to digital<br />
assessment; it was also us<strong>in</strong>g GL Assessment’s tests for<br />
the first time. “Our previous tests didn’t cater for pupils that<br />
were out-of-range and we wanted a means of assess<strong>in</strong>g<br />
pupils of all abilities. Another problem was that the data was<br />
<strong>in</strong> an unfriendly format and we had to spend hours go<strong>in</strong>g<br />
through the reports and mak<strong>in</strong>g them easily accessible for<br />
staff.”<br />
Handcross Park chose to adopt the digital version of<br />
GL Assessment’s Cognitive AbilitiesTest (CAT) to assess<br />
pupils’ reason<strong>in</strong>g abilities. CAT measures the three pr<strong>in</strong>cipal<br />
areas of reason<strong>in</strong>g – verbal, non-verbal and quantitative – and<br />
is the most widely used test of reason<strong>in</strong>g abilities <strong>in</strong> the UK.<br />
To measure specific strengths and needs <strong>in</strong> English, the<br />
school selected the Suffolk Read<strong>in</strong>g Scale (SRS) and<br />
<strong>Progress</strong> <strong>in</strong> English (PIE). For <strong>Maths</strong>, they adopted <strong>Progress</strong><br />
<strong>in</strong> <strong>Maths</strong> (PIM), a standardised series of tests designed to<br />
provide rich diagnostic <strong>in</strong>formation about pupils’<br />
mathematical abilities.<br />
Used together, Handcross Park found that the test data<br />
provided a useful, objective means of assess<strong>in</strong>g pupils<br />
progress which supported ongo<strong>in</strong>g classroom assessment.<br />
Introduc<strong>in</strong>g onl<strong>in</strong>e assessment<br />
When the school <strong>in</strong>troduced GL Assessment’s onl<strong>in</strong>e<br />
test<strong>in</strong>g platform, Testwise, Neil Cheesman found little need<br />
for staff tra<strong>in</strong><strong>in</strong>g. “Hav<strong>in</strong>g established that all we needed<br />
was a reliable <strong>in</strong>ternet connection, we required virtually no<br />
tra<strong>in</strong><strong>in</strong>g with the new assessments. We are reasonably<br />
computer literate and just had to log <strong>in</strong> and start.”<br />
“The support <strong>in</strong> sett<strong>in</strong>g-up the onl<strong>in</strong>e system has been very<br />
efficient, together with the ongo<strong>in</strong>g support, which has been<br />
superb. The results have always been available with<strong>in</strong><br />
m<strong>in</strong>utes of the assessments be<strong>in</strong>g completed,” he says.<br />
“The electronic assessments are for Years 3 – 8 and while it<br />
can be a busy time for me <strong>in</strong> organis<strong>in</strong>g the process, we<br />
save so much staff time as we are not wast<strong>in</strong>g valuable<br />
hours mark<strong>in</strong>g papers.”<br />
Instant report<strong>in</strong>g<br />
Once a test has been completed by a pupil, test scores and<br />
detailed diagnostic reports are delivered <strong>in</strong>stantly, enabl<strong>in</strong>g<br />
teachers at Handcross Park to evaluate pupils’ needs<br />
immediately.<br />
At the beg<strong>in</strong>n<strong>in</strong>g of the academic year, Handcross Park uses<br />
the PIE, PIM and SRS tests to provide a comparison of<br />
Standardised Age Scores with<strong>in</strong> the class, year group and<br />
nationally.<br />
“We use these to <strong>in</strong>form target sett<strong>in</strong>g, teach<strong>in</strong>g and<br />
learn<strong>in</strong>g for the year ahead. Teachers particularly like the<br />
option of produc<strong>in</strong>g a question-by-question analysis as it<br />
allows them to review <strong>in</strong>dividual and group progress, and<br />
then embark on specific target sett<strong>in</strong>g,” Neil expla<strong>in</strong>s.<br />
A ‘Value Added Track<strong>in</strong>g Chart’ is also used to view year-onyear<br />
progress of <strong>in</strong>dividual pupils, classes and year groups.<br />
The school f<strong>in</strong>ds this very useful <strong>in</strong> monitor<strong>in</strong>g the progress<br />
of <strong>in</strong>dividual pupils, together with display<strong>in</strong>g an overall<br />
picture of the year group’s ability levels <strong>in</strong> <strong>Maths</strong> and<br />
English. This is also used as a comparison across classes<br />
with<strong>in</strong> year groups to evaluate teach<strong>in</strong>g at the school.<br />
In the summer term, the school uses CAT data to <strong>in</strong>form<br />
teach<strong>in</strong>g and learn<strong>in</strong>g based on comparisons with<strong>in</strong> each<br />
class and year group. It is also used to obta<strong>in</strong> a useful<br />
guidel<strong>in</strong>e for Key Stages 2–3 and GCSE predictors, and to<br />
ascerta<strong>in</strong> a comparison of boys and girls. For example, the<br />
data can enable teachers to see if girls are out perform<strong>in</strong>g<br />
boys <strong>in</strong> numeracy, or whether a particular group of children<br />
are struggl<strong>in</strong>g with a specific area <strong>in</strong> English.<br />
“We immediately noticed a huge difference<br />
<strong>in</strong> the time it took to analyse results –<br />
onl<strong>in</strong>e assessment provides results with<strong>in</strong><br />
m<strong>in</strong>utes and saves a great deal of time<br />
<strong>in</strong>volved <strong>in</strong> mark<strong>in</strong>g written assessments.”<br />
“All of these tests arm our teachers with knowledge about<br />
our pupils’ levels of understand<strong>in</strong>g across the curriculum,<br />
enabl<strong>in</strong>g them to take <strong>in</strong>to account specific areas of learn<strong>in</strong>g<br />
dur<strong>in</strong>g lessons”, Neil expla<strong>in</strong>s.<br />
“We can tailor lessons accord<strong>in</strong>gly and take <strong>in</strong>to account<br />
specific areas of learn<strong>in</strong>g dur<strong>in</strong>g lessons, so that each pupil<br />
will ga<strong>in</strong> the maximum benefit. The whole process is<br />
work<strong>in</strong>g extremely well and the onl<strong>in</strong>e element ensures that<br />
our time is given to support<strong>in</strong>g pupils rather than given to<br />
unnecessary paperwork.”<br />
March 2009<br />
23
Contact your local consultant for further <strong>in</strong>formation<br />
GL Assessment, Chiswick Centre, 414 Chiswick High Road, London, W4 5TF<br />
Phone: 0845 602 1937 Fax: +44 (0) 20 8742 8767 www.gl-assessment.co.uk<br />
GLA157