L'abitare sociale - Ministero del Lavoro e delle Politiche Sociali
L'abitare sociale - Ministero del Lavoro e delle Politiche Sociali
L'abitare sociale - Ministero del Lavoro e delle Politiche Sociali
- No tags were found...

Create successful ePaper yourself
Turn your PDF publications into a flip-book with our unique Google optimized e-Paper software.
32<br />
L’abitare <strong>sociale</strong><br />
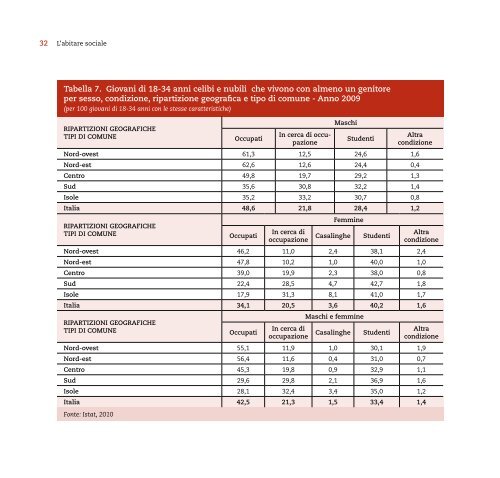
Tabella 7. Giovani di 18-34 anni celibi e nubili che vivono con almeno un genitore<br />
per sesso, condizione, ripartizione geografica e tipo di comune - Anno 2009<br />
(per 100 giovani di 18-34 anni con le stesse caratteristiche)<br />
RIPARTIZIONI GEOGRAFICHE<br />
TIPI DI COMUNE<br />
Occupati<br />
In cerca di occupazione<br />
Maschi<br />
Studenti<br />
Altra<br />
condizione<br />
Nord-ovest 61,3 12,5 24,6 1,6<br />
Nord-est 62,6 12,6 24,4 0,4<br />
Centro 49,8 19,7 29,2 1,3<br />
Sud 35,6 30,8 32,2 1,4<br />
Isole 35,2 33,2 30,7 0,8<br />
Italia 48,6 21,8 28,4 1,2<br />
RIPARTIZIONI GEOGRAFICHE<br />
TIPI DI COMUNE<br />
Occupati<br />
In cerca di<br />
occupazione<br />
Femmine<br />
Casalinghe<br />
Studenti<br />
Altra<br />
condizione<br />
Nord-ovest 46,2 11,0 2,4 38,1 2,4<br />
Nord-est 47,8 10,2 1,0 40,0 1,0<br />
Centro 39,0 19,9 2,3 38,0 0,8<br />
Sud 22,4 28,5 4,7 42,7 1,8<br />
Isole 17,9 31,3 8,1 41,0 1,7<br />
Italia 34,1 20,5 3,6 40,2 1,6<br />
Maschi e femmine<br />
RIPARTIZIONI GEOGRAFICHE<br />
TIPI DI COMUNE<br />
Occupati<br />
In cerca di<br />
occupazione<br />
Casalinghe<br />
Studenti<br />
Altra<br />
condizione<br />
Nord-ovest 55,1 11,9 1,0 30,1 1,9<br />
Nord-est 56,4 11,6 0,4 31,0 0,7<br />
Centro 45,3 19,8 0,9 32,9 1,1<br />
Sud 29,6 29,8 2,1 36,9 1,6<br />
Isole 28,1 32,4 3,4 35,0 1,2<br />
Italia 42,5 21,3 1,5 33,4 1,4<br />
Fonte: Istat, 2010