An overview of traffic sign detection methods - FER-a
An overview of traffic sign detection methods - FER-a
An overview of traffic sign detection methods - FER-a

You also want an ePaper? Increase the reach of your titles
YUMPU automatically turns print PDFs into web optimized ePapers that Google loves.
<strong>An</strong> <strong>overview</strong> <strong>of</strong> <strong>traffic</strong> <strong>sign</strong> <strong>detection</strong> <strong>methods</strong><br />
Karla Brkić<br />
Department <strong>of</strong> Electronics, Microelectronics, Computer and Intelligent Systems<br />
Faculty <strong>of</strong> Electrical Engineering and Computing<br />
Unska 3, 10000 Zagreb, Croatia<br />
Email: karla.brkic@fer.hr<br />
Abstract—This paper reviews the popular <strong>traffic</strong> <strong>sign</strong> <strong>detection</strong><br />
<strong>methods</strong> prevalent in recent literature. The <strong>methods</strong> are divided<br />
into three categories: color-based, shape-based, and learningbased.<br />
Color-based <strong>detection</strong> <strong>methods</strong> from eleven different<br />
works are studied and summarized in a table for easy reference.<br />
Three shape-based <strong>detection</strong> <strong>methods</strong> are presented, and a recent<br />
method based on Hough transform is studied in detail. In the<br />
section on learning-based <strong>detection</strong>, we review the Viola Jones<br />
detector and the possibility <strong>of</strong> applying it to <strong>traffic</strong> <strong>sign</strong> <strong>detection</strong>.<br />
We conclude with two case studies which show how the presented<br />
<strong>methods</strong> are used to de<strong>sign</strong> complex <strong>traffic</strong> <strong>sign</strong> <strong>detection</strong> systems.<br />
I. INTRODUCTION<br />
Recent increases in computing power have brought computer<br />
vision to consumer-grade applications. As computers<br />
<strong>of</strong>fer more and more processing power, the goal <strong>of</strong> realtime<br />
<strong>traffic</strong> <strong>sign</strong> <strong>detection</strong> and recognition is becoming feasible.<br />
Some new models <strong>of</strong> high class vehicles already come<br />
equipped with driver assistance systems which <strong>of</strong>fer automated<br />
<strong>detection</strong> and recognition <strong>of</strong> certain classes <strong>of</strong> <strong>traffic</strong> <strong>sign</strong>s.<br />
Traffic <strong>sign</strong> <strong>detection</strong> and recognition is also becoming interesting<br />
in automated road maintenance. Every road has to be<br />
periodically checked for any missing or damaged <strong>sign</strong>s, as<br />
such <strong>sign</strong>s pose safety threats. The checks are usually done<br />
by driving a car down the road <strong>of</strong> interest and recording any<br />
observed problem by hand. The task <strong>of</strong> manually checking<br />
the state <strong>of</strong> every <strong>traffic</strong> <strong>sign</strong> is long, tedious and prone to<br />
human error. By using techniques <strong>of</strong> computer vision, the task<br />
could be automated and therefore carried out more frequently,<br />
resulting in greater road safety.<br />
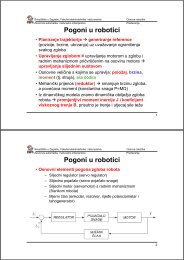
To a person acquainted with recent advances in computer<br />
vision, the problem <strong>of</strong> <strong>traffic</strong> <strong>sign</strong> <strong>detection</strong> and recognition<br />
might seem easy to solve. Traffic <strong>sign</strong>s are fairly simple<br />
objects with heavily constrained appearances. Just a glance at<br />
the well-known PASCAL visual object classes challenge for<br />
2009 indicates that researchers are now solving the problem<br />
<strong>of</strong> <strong>detection</strong> and classification <strong>of</strong> complex objects with a lot<br />
<strong>of</strong> intra-class variation, such as bicycles, aeroplanes, chairs or<br />
animals (see figure 1). Contemporary <strong>detection</strong> and classification<br />
algorithms will perform really well in detecting and<br />
classifying a <strong>traffic</strong> <strong>sign</strong> in an image. However, as research<br />
comes closer to commercial applications, the constraints <strong>of</strong> the<br />
problem change. In driver assistance systems or road inventory<br />
systems, the problem is no longer how to efficiently detect and<br />
recognize a <strong>traffic</strong> <strong>sign</strong> in a single image, but how to reliably<br />
detect it in hundreds <strong>of</strong> thousands <strong>of</strong> video frames without any<br />
false alarms, <strong>of</strong>ten using low-quality cheap sensors available<br />
in mass production. To illustrate the problem <strong>of</strong> false alarms,<br />
consider the following: one hour <strong>of</strong> video shot at 24 frames<br />
per second consists <strong>of</strong> 86400 frames. If we assume that in<br />
the video under consideration <strong>traffic</strong> <strong>sign</strong>s appear every three<br />
minutes and typically span through 40 frames, there are a<br />
total <strong>of</strong> 800 frames which contain <strong>traffic</strong> <strong>sign</strong>s and 85600<br />
frames which do not contain any <strong>sign</strong>s. These 85600 frames<br />
without <strong>traffic</strong> <strong>sign</strong>s will be presented to our <strong>detection</strong> system.<br />
If our system were to make an error <strong>of</strong> 1 false positive per 10<br />
images, we would still be left with 8560 false alarms in one<br />
hour, or two false alarms every second, rendering the system<br />
completely unusable for any serious application! To make the<br />
problem even harder, we cannot expect the vehicle on which a<br />
commercial <strong>traffic</strong> <strong>sign</strong> <strong>detection</strong> system will be deployed to be<br />
equipped with a very high-resolution camera or other helpful<br />
sensors, as the addition <strong>of</strong> such sensors increases production<br />
costs.<br />
Fig. 1: Labeled examples from the PASCAL visual object<br />
classes challenge 2009. [1]<br />
This paper presents an <strong>overview</strong> <strong>of</strong> basic <strong>traffic</strong> <strong>sign</strong> <strong>detection</strong><br />
<strong>methods</strong>. Using the presented <strong>methods</strong> as commercial<br />
stand-alone solutions is impossible, as they fail to provide<br />
the required true positive and false positive rates. However,<br />
combining the <strong>methods</strong> has a synergistic effect, so they are<br />
commonly used as building blocks <strong>of</strong> larger <strong>detection</strong> systems.<br />
In this paper, the <strong>traffic</strong> <strong>sign</strong> <strong>detection</strong> <strong>methods</strong> are divided into<br />
three categories: color-based <strong>methods</strong>, shape-based <strong>methods</strong><br />
and <strong>methods</strong> based on machine learning. After introducing the<br />
<strong>methods</strong>, we present two <strong>traffic</strong> <strong>sign</strong> <strong>detection</strong> systems which<br />
use them.<br />
A. Traffic <strong>sign</strong> classes - the Vienna convention<br />
Before investigating common <strong>traffic</strong> <strong>sign</strong> <strong>detection</strong> <strong>methods</strong>,<br />
it is useful to briefly review the data on which these <strong>methods</strong><br />
operate, i.e. the classes <strong>of</strong> <strong>traffic</strong> <strong>sign</strong>s. In 1968, an international<br />
treaty aiming to standardize <strong>traffic</strong> <strong>sign</strong>s across different
countries, the so-called Vienna Convention on Road Signs and<br />
Signals, was <strong>sign</strong>ed [2]. To date there are 52 countries which<br />
have <strong>sign</strong>ed the treaty, among which 31 are in Europe. The<br />
Vienna Convention classifies road <strong>sign</strong>s into seven categories,<br />
de<strong>sign</strong>ated with letters A-H: danger warning <strong>sign</strong>s (A), priority<br />
<strong>sign</strong>s (B), prohibitory or restrictive <strong>sign</strong>s (C), mandatory <strong>sign</strong>s<br />
(D), information, facilities, or service <strong>sign</strong>s (F), direction,<br />
position, or indication <strong>sign</strong>s (G) and additional panels (H).<br />
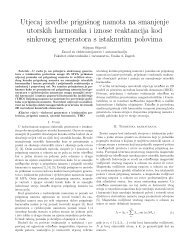
Examples <strong>of</strong> Croatian <strong>traffic</strong> <strong>sign</strong>s for each <strong>of</strong> the categories<br />
are shown in figure 2.<br />
Fig. 2: Examples <strong>of</strong> <strong>traffic</strong> <strong>sign</strong>s. From left to right: a danger<br />
warning <strong>sign</strong>, a prohibitory <strong>sign</strong>, a priority <strong>sign</strong>, a mandatory<br />
<strong>sign</strong>, an information <strong>sign</strong>, a direction <strong>sign</strong> and an additional<br />
panel.<br />
In spite <strong>of</strong> appearances <strong>of</strong> <strong>traffic</strong> <strong>sign</strong>s being strictly prescribed<br />
by the Vienna convention, there still exist variations<br />
between countries which have <strong>sign</strong>ed the treaty. The variations<br />
are seemingly irrelevant for a human, but might pose<br />
<strong>sign</strong>ificant challenges for a computer vision algorithm. For<br />
an example, see table I, where variations <strong>of</strong> two <strong>traffic</strong> <strong>sign</strong>s<br />
across six different European countries are shown. Therefore,<br />
contemporary <strong>traffic</strong> <strong>sign</strong> <strong>detection</strong> systems are still countryspecific.<br />
TABLE I: Two <strong>traffic</strong> <strong>sign</strong>s, as defined by regulations <strong>of</strong> six<br />
different European countries. Notice the subtle differences that<br />
don’t present a problem for a human, but might influence the<br />
performance <strong>of</strong> a <strong>detection</strong> algorithm.<br />
Croatia Germany Spain France Italy Poland<br />
B. Evaluating <strong>traffic</strong> <strong>sign</strong> <strong>detection</strong> <strong>methods</strong><br />
Research concerning <strong>traffic</strong> <strong>sign</strong> <strong>detection</strong> is <strong>of</strong>ten hard to<br />
compare, as different researchers approach the problem with<br />
different application areas and constraints in mind. Traffic <strong>sign</strong><br />
<strong>detection</strong> <strong>methods</strong> are inherently dependent on the nature data<br />
for which they were developed. Some factors in which the<br />
<strong>methods</strong> differ are the following:<br />
• Input type: videos or static images?<br />
• Scope <strong>of</strong> the method: is the method applicable for a single<br />
<strong>traffic</strong> <strong>sign</strong> class or for multiple classes?<br />
• Filming conditions: is the data shot in broad daylight, in<br />
nighttime or both? Are there adverse weather conditions<br />
such as rain, snow, fog?<br />
• Sensor type: high resolution or low resolution camera,<br />
grayscale or color? Multiple cameras? Other sensors?<br />
• Processing requirements: should the <strong>sign</strong>s be detected in<br />
realtime or is <strong>of</strong>fline processing acceptable?<br />
• Acceptable true positive and false positive rates: determined<br />
by the nature <strong>of</strong> the problem.<br />
The nature <strong>of</strong> the problem, the availability <strong>of</strong> sensors and<br />
the target application determine which method to use. For<br />
example, color-based <strong>detection</strong> is pointless if we are working<br />
with a grayscale camera. On the other hand, it might be very<br />
useful if we are trying to detect <strong>traffic</strong> <strong>sign</strong>s in high resolution<br />
color images taken in broad daylight with a high quality<br />
camera. Shape-based <strong>detection</strong> might not work if we are using<br />
a camera with interlacing. Learning-based approaches might<br />
be a perfect solution if we have a lot <strong>of</strong> labeled data, but if<br />
no labeled data is available we cannot use them.<br />
II. COLOR-BASED DETECTION METHODS<br />
The prevalent approach in detecting <strong>traffic</strong> <strong>sign</strong>s based on<br />
color is very obvious - one finds the areas <strong>of</strong> the image which<br />
contain the color <strong>of</strong> interest, using simple thresholding or more<br />
advanced image segmentation <strong>methods</strong>. The resulting areas are<br />
then either immediately de<strong>sign</strong>ated as <strong>traffic</strong> <strong>sign</strong>s, or passed<br />
on to subsequent stages as <strong>traffic</strong> <strong>sign</strong> location hypotheses<br />
(i.e. regions <strong>of</strong> interest). The main weakness <strong>of</strong> such an<br />
approach lies in the fact that color tends to be unreliable -<br />
depending on the time <strong>of</strong> day, weather conditions, shadows<br />
etc. the illumination <strong>of</strong> the scene can vary considerably. RGB<br />
color space is considered to be very sensitive to illumination,<br />
so many researchers choose to carry out the color-based<br />
segmentation in other color spaces, such as HSI or L*a*b.<br />
A. Color spaces: a short review<br />
To understand why some color spaces are considered<br />
illumination-sensitive and some not, we briefly review the<br />
theory <strong>of</strong> color spaces. A color space is defined using a color<br />
model. In general, a color model is an abstract mathematical<br />
model which defines how colors can be represented as tuples<br />
<strong>of</strong> numbers. All the valid tuples constitute a color space. Common<br />
dimensionality <strong>of</strong> tuples is three to four. There is a myriad<br />
<strong>of</strong> color spaces which differ in the basic colors used. Some<br />
<strong>of</strong> the most pupular are RGB (red-green-blue) color space,<br />
HSI (hue-saturation-intesity) color space, L*a*b (lightnesscolor<br />
opponent dimensions), CMYK (cyan-magenta-yellowblack)<br />
color space, CIECAM97 color space.<br />
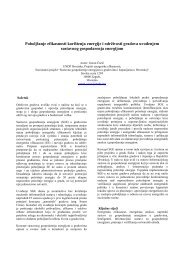
Fig. 3: Obtaining two different shades <strong>of</strong> orange by mixing red,<br />
green and blue components. By just looking at the differences<br />
between the channels it would be hard to conclude that the<br />
colors are similar.
TABLE II: A summary <strong>of</strong> color-based <strong>traffic</strong> <strong>sign</strong> <strong>detection</strong> <strong>methods</strong> from eleven different papers.<br />
Authors Color space used Type Color <strong>of</strong> interest Formulas<br />
Benallal and Meunier [3] RGB thresholding red If Ri > Gi and Ri − Gi ≥ δRG and Ri − Bi ≥<br />
δRB then pixel pi is RED.<br />
Estevez and Kehtarnavaz [4] RGB thresholding red REDNESS = R −max(G, B)−a×abs(G−B),<br />
thresholded at zero to obtain the red pixels.<br />
Varun et al. [5] RGB thresholding red 1.5R > G + B<br />
Broggi et al. [6] RGB enhancement red αmin × G < R < αmax × G and βmin × B <<br />
R < βmax × B and γmin × B < G < γmax × B<br />
Ruta et al. [7] RGB enhancement red, blue, yellow R > theshold and fR(x) = max(0, min(xR −<br />
xG, xR − xB)/s)<br />
Kuo and Lin [8] HSI thresholding red H ≥ 0 and H < 0.111π or H ≥ 1.8π and H <<br />
2π, 0.1 < S ≤ 1,0.12 < I < 0.8<br />
Piccioli et al. [9] HSI thresholding red −30◦ < H < 30◦ , minimum saturation <strong>of</strong> 20%<br />
Paclik et al. [10] HSV thresholding any<br />
V −inf(R,G,B)<br />
Set V = sup(R, G, B), S = 256 .<br />
V<br />
G−B<br />
If V = R then H =<br />
else if V = G<br />
V −inf(R,G,B)<br />
B−R<br />
then H = 2 +<br />
else if V = B then<br />
V −inf(R,G,B)<br />
R−G<br />
H = 4 +<br />
. Finally threshold H to<br />
V −inf(R,G,B)<br />
obtain target color, black and white are found by<br />
thresholding S and I.<br />
Fang et al. [11] HSI similarity measure any Calculate the hue h <strong>of</strong> the candidate pixel. Denote<br />
(h1, ..., hq), a set <strong>of</strong> hue values which a particular<br />
color <strong>of</strong> a <strong>traffic</strong> <strong>sign</strong> can take (precomputed), normally<br />
distributed with variance σ2 . The output is the<br />
degree <strong>of</strong> similarity z = maxk=1,...,q(zk) where<br />
zk =<br />
1<br />
√<br />
2πσ2 exp(− (h−hk) 2<br />
2σ2 ).<br />
Escalera et al. [12] HSI thresholding red Set H(i) = 255 i min−i<br />
i min<br />
if 0 ≤ i ≤ imin; H(i) =<br />
0 if imin ≤ i ≤ imax, H(i) = 255 i−imax<br />
imax<br />
imax ≤ i ≤ 255. Then set S(i) = i if 0 ≤ i ≤<br />
imin; S(i) = 255 if imin ≤ i ≤ 255. Multiply the<br />
two images and upper bound the results at 255.<br />
Gao et al. [13] CIECAM97 thresholding red (a) average daylight conditions: hue 393-423, chroma<br />
5795; (b) sunny day: hue 375-411, chroma 31-43; (c)<br />
cloudy day: hue 370-413, chroma 25-45; (d) rainy<br />
day: hue 345-405, chroma 30-50<br />
In the RGB color model, colors are specified as mixtures<br />
<strong>of</strong> red, green and blue components. Figure 3 1 illustrates how<br />
two different shades <strong>of</strong> orange can be obtained by mixing red,<br />
green and blue. The differences between RGB components for<br />
the first and the second color are -31, +24 and +59. The RGB<br />
color model is unintuitive from a human standpoint - a human<br />
might expect to vary just one parameter, namely illumination,<br />
to obtain the second color from the first. It would be hard for<br />
a human to guess the changes in R, G and B necessary for the<br />
required change in color. Similarly, it is hard for a computer<br />
to learn that these two colors are similar based purely on the<br />
distances between the numerical values <strong>of</strong> their R, G and B.<br />
Several color models were de<strong>sign</strong>ed to address this problem.<br />
In the mid-1970s researchers in computer graphics developed<br />
the HSL and HSV color models, which rearrange the RGB<br />
color space in cylindrical coordinates so that the resulting<br />
representation is closer to human visual perception. A very<br />
similar model is HSI, commonly used in computer vision.<br />
HSL, HSV and HSI differ only in the definition <strong>of</strong> the third<br />
component – L stands for lightness, V for value and I for<br />
1 Image adapted from http://en.wikipedia.org/wiki/File:Unintuitive-rgb.png<br />
intensity. The first two components are hue and saturation. In<br />
the HS* cylinder, the angle around the central vertical axis<br />
corresponds to hue, the radius to saturation and the height to<br />
lightness or value or intensity. In the HS* representation, the<br />
components <strong>of</strong> two similar colors are numerically much closer,<br />
which is why it is said to be less sensitive to illumination.<br />
B. Color-based segmentation<br />
The color <strong>of</strong> a <strong>traffic</strong> <strong>sign</strong> should be easily distinguishable<br />
from the colors <strong>of</strong> the environment. After all, <strong>traffic</strong> <strong>sign</strong>s are<br />
specifically de<strong>sign</strong>ed with this requirement in mind. In order<br />
to find the <strong>sign</strong> <strong>of</strong> a target color, one segments the image<br />
based on that color. Image segmentation is a process which<br />
as<strong>sign</strong>s a label to each pixel <strong>of</strong> an image so that the pixels<br />
with the same labels share similar visual characteristics. The<br />
simplest method <strong>of</strong> image segmentation is thresholding: every<br />
pixel with a value above a certain threshold is marked with<br />
the appropriate label. Various authors have experimented with<br />
color thresholding, especially in the 1990s. High <strong>detection</strong><br />
rates were reported, but the experiments were usually done on<br />
small testing sets. For example, simple thresholding formulas<br />
(see table II) are used by Varun et al. [5] and Kuo and Lin<br />
if
[8]. External factors such as illumination changes, shadows,<br />
adverse weather conditions can greatly impact the success <strong>of</strong><br />
color-based <strong>detection</strong> techniques. This <strong>sign</strong>ificantly reduces<br />
the potential <strong>of</strong> color thresholding as a stand-alone solution<br />
for <strong>detection</strong>. In recent research, color thresholding commonly<br />
finds is purpose as a preprocessing step to extract regions <strong>of</strong><br />
interest [14], [15].<br />
Influences <strong>of</strong> daily illumination changes are recognized<br />
by Benallal and Meunier [3]. They present an interesting<br />
experiment in which they observe the color <strong>of</strong> a red STOP<br />
through 24 hours. They show that the red color component is<br />
dominant between approximately 6.30 am and 9 pm. During<br />
that time, the differences δRG and δRB between the red color<br />
component and the green and blue components remain high,<br />
the red color having a value <strong>of</strong> approximately 85 above the<br />
green and the blue components. Based on this experiment, they<br />
propose formulas for color segmentation intended to correctly<br />
segment the red, green and blue <strong>sign</strong>s (see table II).<br />
Estevez and Kehtarnavaz [4] present an algorithm for detecting<br />
and recognizing a small subset <strong>of</strong> <strong>traffic</strong> <strong>sign</strong>s which<br />
contain red components. The first stage <strong>of</strong> their algorithm is<br />
color segmentation, used to localize red edge areas. The formula<br />
for the segmentation, given in table II, relies on a tunable<br />
parameter α which can be tuned to varying sensitivities based<br />
on intensity levels, in order to avoid illumination sensitivity.<br />
Average intensity values are obtained by sparsely sampling the<br />
top line <strong>of</strong> the image, usually corresponding to the sky. From<br />
these values one can speculate about the weather conditions<br />
and choose the proper value <strong>of</strong> α. The exact values <strong>of</strong> α chosen<br />
are not given in the paper.<br />
Broggi et al. [6] propose a way <strong>of</strong> overcoming the color<br />
dependency on the light source. The default way to determine<br />
the light source color is to find a white object in the scene<br />
and compute the difference between the image white and theoretical<br />
white (RGB values 255, 255, 255). In road sequences<br />
one cannot count on having a white reference point, but the<br />
road is usually gray. Broggi et al. therefore find a piece <strong>of</strong><br />
road (it is unclear whether this is an automated procedure or<br />
it needs to be done by hand) and estimate the light source<br />
color by assuming that the road should be gray. They then<br />
perform chromatic equalization, similar to gamma correction<br />
but with the linearization <strong>of</strong> gamma function.<br />
Ruta et al. [7] use color-based segmentation as a starting<br />
stage in <strong>traffic</strong> <strong>sign</strong> recognition. They first segment the image<br />
based on fixed thresholds (which are not listed in the paper),<br />
and then enhance the obtained colors using formulas shown<br />
in table II.<br />
Escalera et al. [12] present an approach for detecting red<br />
in HSI color space. The input image is first converted from<br />
RGB to HSI. For each pixel, values <strong>of</strong> hue and saturation<br />
are re-calculated so that the range <strong>of</strong> saturated red hues is<br />
emphasized. This is done by using a lookup table described<br />
in table II. The authors assume that the values <strong>of</strong> hue and<br />
saturation are scaled to the range <strong>of</strong> 0 to 255. The resulting<br />
hue and saturation are then multiplied and the result is upper<br />
bounded by 255. Thus the response image is obtained. The<br />
authors state that the values are multiplied so that the two<br />
components can correct each other - if one component is<br />
wrong, the assumption is that the other one will not be wrong.<br />
Fang et al. [11] classify colors based on their similarity with<br />
pre-stored hues. The idea is that the hues in which a <strong>traffic</strong> <strong>sign</strong><br />
appears are stored in advance, and the color label is calculated<br />
as the similarity measure with all available hues, so that the<br />
classification which is most similar is chosen.<br />
Paclik et al. [10] present approximative formulas for converting<br />
RGB to HSI. The desired color is then obtained by<br />
choosing an appropriate threshold for hue, while black and<br />
white are found by thresholding the saturation and intensity<br />
components.<br />
Gao et al. [13] use the CIECAM97 color model. The<br />
images are first transformed from RGB to CIE XYZ values,<br />
and then to LCH (Lightness, Chroma, Hue) space using the<br />
CIECAM97 model. The authors state that the lightness values<br />
are similar for red and blue <strong>sign</strong>s and the background, so<br />
only hue and chroma measures are used in the segmentation.<br />
Authors consider four distinct cases: average daylight viewing<br />
conditions, as well as conditions during sunny, cloudy and<br />
rainy weather. Using the acceptable ranges, <strong>sign</strong> candidates<br />
are segmented using a quad-tree approach, meaning that the<br />
image is recursively divided into quadrants until all elements<br />
are homogeneous or the predefined grain size is reached.<br />
For an another view on <strong>traffic</strong> <strong>sign</strong> <strong>detection</strong> by color, see a<br />
review paper by Nguwi and Kouzani [16], in which the colorbased<br />
<strong>detection</strong> <strong>methods</strong> are divided into seven categories.<br />
III. SHAPE-BASED DETECTION<br />
Several approaches for shape-based <strong>detection</strong> <strong>of</strong> <strong>traffic</strong><br />
<strong>sign</strong>s are recurrent in literature. Probably the most common<br />
approach is using some form <strong>of</strong> Hough transform. Approaches<br />
based on corner <strong>detection</strong> followed by reasoning or approaches<br />
based on simple template matching are also popular.<br />
Generalized Hough transform is a technique for finding<br />
arbitrary shapes in an image. The basic idea is that, using<br />
an edge image, each pixel <strong>of</strong> the edge image votes for where<br />
the object center would be if that pixel were at the object<br />
boudary. The technique originated early in the history <strong>of</strong><br />
computer vision. It was extended and modified numerous<br />
times and there are many variants. Here we will present<br />
work by Loy and Barnes, as it was intended specifically for<br />
<strong>traffic</strong> <strong>sign</strong> <strong>detection</strong> and was used independently in several<br />
<strong>detection</strong> systems. Loy and Barnes [17] propose a general<br />
regular polygon detector and use it to detect <strong>traffic</strong> <strong>sign</strong>s. The<br />
detector is based on their fast radial symmetry transform, and<br />
the overall approach is similar to Hough transform. First the<br />
gradient magnitude image is built from the original image.<br />
The gradient magnitude image is then thresholded so that the<br />
points with low magnitudes, which are unlikely to correspond<br />
to edges, are eliminated. Each remaining pixel then votes for<br />
the possible positions <strong>of</strong> the center <strong>of</strong> a regular polygon. One<br />
pixel casts its vote at multiple locations distributed along a line<br />
which is perpendicular to the gradient <strong>of</strong> the pixel and whose<br />
distance to the pixel is equal to the expected radius <strong>of</strong> the
egular polygon (see figure 4). Notice that there are actually<br />
two lines which satisfy these requirements, one in the direction<br />
<strong>of</strong> the gradient and the other in the opposite direction. Both<br />
can be used if we don’t know in advance whether <strong>sign</strong>s will be<br />
lighter or darker than the background. The length <strong>of</strong> the voting<br />
Fig. 4: Locations on which a pixel votes for the object center.<br />
The parts <strong>of</strong> the line which are black indicate negative votes.<br />
Image from [17].<br />
line is bounded by the expected radius <strong>of</strong> the regular polygon.<br />
The votes towards the end <strong>of</strong> the line have negative weights,<br />
to minimize the influence <strong>of</strong> straight lines in an image which<br />
are too long to be polygon edges. The resulting vote image is<br />
labeled Or.<br />
In addition to the vote image, another image called equiangular<br />
image is built. The proposed procedure favors equiangular<br />
polygons by utilizing the following property: if the<br />
gradient angles <strong>of</strong> edge pixels <strong>of</strong> an n-sided regular polygon<br />
are multiplied by n, the resulting angles will be equal (see<br />
figure 5). For instance, cosider an equiangular triangle for<br />
which we sample one gradient angle value at each side.<br />
Suppose that we obtain gradient values <strong>of</strong> 73 ◦ , 193 ◦ and<br />
313 ◦ . The gradients are spaced at 360 ◦ /n = 120 ◦ . Then<br />
73 ◦ × 3 = 219 ◦ and 193 ◦ × 3 = 579 ◦ , 579 ◦ − 360 ◦ = 219 ◦ .<br />
Similarly 313 ◦ × 3 = 939 ◦ , 939 ◦ − 2 × 360 ◦ = 219 ◦ . For<br />
each pixel which voted for the polygon center, a unit vector is<br />
constructed. The slope <strong>of</strong> the unit vector is made equal to the<br />
gradient angle <strong>of</strong> the pixel multiplied by the number <strong>of</strong> sides <strong>of</strong><br />
the sought regular polygon. The pixel then again casts its vote<br />
on locations determined by the voting line, except that this<br />
time the vote takes the form <strong>of</strong> the constructed unit vector.<br />
The votes are cast in a new image called the equiangular<br />
image. Each point in this image represents a vector which<br />
is the sum <strong>of</strong> all contributing votes. The votes coming from<br />
edges <strong>of</strong> equiangular polygons will have the same slope, so the<br />
magnitudes <strong>of</strong> vote vectors in equiangular polygon cenroids<br />
should be the largest.<br />
Fig. 5: Multiplying the gradient angles <strong>of</strong> a triangle by 3. The<br />
resulting angles are equal. Image from [17].<br />
Finally, the vote image and the norm <strong>of</strong> the equiangular<br />
image are combined to produce the overall response. Computational<br />
complexity <strong>of</strong> this method is O(Nkl), where l is the<br />
maximum length <strong>of</strong> the voting line, N is the number <strong>of</strong> pixels<br />
in an image and k is the number <strong>of</strong> radii being considered. The<br />
main weakness <strong>of</strong> the approach is that the radius <strong>of</strong> the sought<br />
polygon should be known in advance, which is not always easy<br />
to accomplish. This can be solved by trying out multiple radii,<br />
but it might be too expensive in terms <strong>of</strong> processing time.<br />
<strong>An</strong>other interesting approach in finding shapes <strong>of</strong> interest<br />
is to use a corner detector and then hypothesise about the<br />
locations <strong>of</strong> regular polygons by observing the relations between<br />
corners. Paulo and Correia [18] detect triangular and<br />
rectangular <strong>sign</strong>s by first applying the Harris corner detector<br />
to a region <strong>of</strong> interest, and then searching for existence <strong>of</strong><br />
corners in six predefined control areas <strong>of</strong> the region. The shape<br />
is determined based on the configuration <strong>of</strong> the control regions<br />
in which corners are found. Control areas are shown in figure<br />
6.<br />
Fig. 6: Predefined control areas from [18]. The shape is<br />
determined by the existence <strong>of</strong> corners in the control areas.<br />
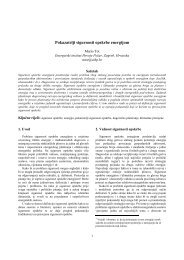
Gavrila [19] uses distance transform based template matching<br />
for shape <strong>detection</strong>. First, edges in the original image<br />
are found. Second, a distance transform (DT) image is built<br />
(see figure 7). A DT image is an image in which each pixel<br />
represents the distance to the nearest edge. To find the shape<br />
<strong>of</strong> interest, the basic idea is to match a template (for instance,<br />
a regular triangle) against the DT image. In order to find the<br />
optimal match, the template is rotated, scaled and translated.<br />
One might consider attempting to match the template with the<br />
raw edge image instead, but by matching with DT image the<br />
resulting similarity measure is much smoother. In Gavrila’s<br />
extension <strong>of</strong> this basic idea, the edges are differented by<br />
orientation, so that separate DT images are computed for<br />
distinct edge orientation intervals and templates are separated<br />
into parts based on orientations <strong>of</strong> their edges. The overall<br />
match measure is a sum <strong>of</strong> match measures between DT<br />
images and templates <strong>of</strong> specific orientations. Gavrila also<br />
uses a template hierarchy, with the idea that similar templates<br />
are grouped into prototypes, and, once the prototype has been<br />
found, the process finds the best template within the prototype.<br />
This saves computation costs.<br />
IV. DETECTION BASED ON MACHINE LEARNING<br />
In the approaches outlined above, the prior knowledge <strong>of</strong><br />
the problem (the expected color and shape <strong>of</strong> a <strong>traffic</strong> <strong>sign</strong>) is<br />
manually encoded into the solution. However, this knowledge<br />
could also be discovered using machine learning.
Fig. 7: Building the distance transform image. From left to right: the original image, the edge image and the distance transform<br />
image. The template for which the DT image is searched is a simple triangle. Images from [19].<br />
Research by Viola and Jones [20] presented a <strong>sign</strong>ificant<br />
milestone in computer vision. Viola and Jones developed an<br />
algorithm capable <strong>of</strong> detecting objects very reliably and in<br />
real time. The detector is trained using a set <strong>of</strong> positive and<br />
negative examples. While originaly intended for face <strong>detection</strong>,<br />
various other researchers have succesfully applied the detector<br />
to a lot <strong>of</strong> other object classes. Among others, <strong>traffic</strong> <strong>sign</strong>s<br />
were successfully detected.<br />
The detector <strong>of</strong> Viola and Jones is an attentional cascade<br />
<strong>of</strong> boosted Haar-like classifiers. It combines two concepts: (i)<br />
AdaBoost and (ii) Haar-like classifiers. Haar-like classifiers<br />
are built using simple rectangular features which represent<br />
differences <strong>of</strong> sums <strong>of</strong> specific pixels in an image. Each feature<br />
is paired with a threshold, and the decision <strong>of</strong> the so-built<br />
classifier is determined by comparing the value <strong>of</strong> the feature<br />
with the threshold. Four feature types used in the original paper<br />
are shown in figure 8. Viola and Jones propose a very fast<br />
method <strong>of</strong> computation for such features which utilizes the<br />
so-called integral image. The value <strong>of</strong> each feature can be<br />
computed in less then ten array references.<br />
Fig. 8: Haar-like features used in training the detector.<br />
AdaBoost is a technique for combining a number <strong>of</strong> weak<br />
classifiers into a strong one. It has been proven to converge<br />
to the optimal solution with a sufficient number <strong>of</strong> weak<br />
classifiers. AdaBoost as<strong>sign</strong>s weights to weak classifiers based<br />
on their quality, and the resulting strong classifier is a linear<br />
combination <strong>of</strong> weak classifiers with the appropriate weights.<br />
Viola and Jones group multiple strong classifiers constructed<br />
by AdaBoost into an attentional cascade, which enables faster<br />
processing. The strong classifier in the first stage <strong>of</strong> the<br />
cascade is chosen so that it discards a number <strong>of</strong> false<br />
positives, while preserving almost all true positives <strong>of</strong> the<br />
training set. For example, the OpenCV implementation defaults<br />
to the minimum hit rate <strong>of</strong> 0.995 and maximum false<br />
positive rate <strong>of</strong> 0.5 per cascade stage. Subsequent stages <strong>of</strong> the<br />
cascade follow the same numerical limitations. Each stage is<br />
trained so that the false positives <strong>of</strong> the previous stage are<br />
labeled as negatives and added to the training set. Hence,<br />
subsequent stages are trained to correct the errors <strong>of</strong> previous<br />
stages, while preserving the high true positive rates. Using the<br />
cascade enables faster processing, as obvious false positives<br />
are discarded early on.<br />
The process <strong>of</strong> the <strong>detection</strong> is carried out by sliding a<br />
<strong>detection</strong> window across the image. Within the window, the<br />
response <strong>of</strong> the cascade is calculated. After completing one<br />
pass over the image, the size <strong>of</strong> the <strong>detection</strong> window is<br />
increased by some factor (OpenCV defaults to 1.2, meaning<br />
that the scale <strong>of</strong> the window will be increased by 20%). The<br />
window size is increased until some predefined size is reached.<br />
Increasing the <strong>detection</strong> window by a smaller percentage yields<br />
better <strong>detection</strong> rates, but increases the total processing time.<br />
(a) (b) (c)<br />
(d) (e) (f)<br />
Fig. 9: Examples <strong>of</strong> <strong>sign</strong> images used for training the Viola-<br />
Jones detector in [21]: (a) a normal <strong>sign</strong>, (b) shadow, (c) color<br />
inconsistency, (d) interlacing, (e) motion blur and interlacing,<br />
(f) occlusion.<br />
In our work [21] we experimented with using the Viola-<br />
Jones detector for triangular <strong>traffic</strong> <strong>sign</strong> <strong>detection</strong>. The detector<br />
was trained using about 1000 images <strong>of</strong> relatively poor quality.<br />
Some especially problematic images are shown in figure 9.<br />
The obtained detector achieved a very high true positive rate<br />
(ranging from 90% to 96%, depending on the training set
and the configuration <strong>of</strong> the detector). A part <strong>of</strong> the trained<br />
cascade is shown in figure 10. The first few Haar-like features<br />
superimposed on <strong>traffic</strong> <strong>sign</strong> images are shown in figure<br />
11. Notice how the Haar-like features capture some natural<br />
properties <strong>of</strong> the <strong>traffic</strong> <strong>sign</strong>, such as the bottom edge, almost<br />
perfectly. In our experiments [21], [22], we obseved two main<br />
weaknesses <strong>of</strong> the Viola-Jones detector: (i) the requirement <strong>of</strong><br />
a large number <strong>of</strong> training images and (ii) high false positive<br />
rates. Nevertheless, our research also indicates that the Viola-<br />
Jones detector is robust w.r.t. noisy and low-quality training<br />
data (cf. figure 9, where six real training images are shown).<br />
Selected features<br />
Cascade stage<br />
1 2 3 4 5<br />
Fig. 10: Top four features <strong>of</strong> the first five stages <strong>of</strong> the Viola-<br />
Jones detector cascade in [21]. The stages are distributed on<br />
the horizontal axis, while the first four features used by each<br />
stage classifier are shown on the vertical axis.<br />
Fig. 11: The first four features <strong>of</strong> cascade stage 1 superimposed<br />
on real <strong>traffic</strong> <strong>sign</strong> images. [21]<br />
Several researchers used the Viola-Jones detector for <strong>traffic</strong><br />
<strong>sign</strong> <strong>detection</strong>. Chen and Sieh [23] use the Viola-Jones detector<br />
to detect circular <strong>sign</strong>s. Baro and Vitria [24] detect <strong>sign</strong>s using<br />
the method <strong>of</strong> Viola and Jones augmented by a feature set<br />
proposed by Lienhart and Maydt [25]. They further eliminate<br />
false positives by using fast radial symmetry transform and<br />
principal component analysis. Their results are used by Escalera<br />
and Radeva [26]. Tim<strong>of</strong>te et al. [15] use the Viola-Jones<br />
detector to detect six different <strong>sign</strong> classes.<br />
In their work on <strong>traffic</strong> <strong>sign</strong> <strong>detection</strong>, Bahlmann et al.<br />
proposed extending each Haar-like feature with a parameter<br />
representing in which color channel (or a combination <strong>of</strong><br />
channels) the value <strong>of</strong> the feature should be calculated. The<br />
features are then boosted as in the original algorithm <strong>of</strong> Viola<br />
and Jones. In selecting the best feature, the boosting algorithm<br />
automatically selects the best color channel too, eliminating<br />
the need for manual thresholds. The experiments indicated<br />
that grayscale and color-aware features result in similar false<br />
negative rates – 1.4 % and 1.6 %, respectively. The main<br />
advantage <strong>of</strong> color-aware features is the reduction <strong>of</strong> false<br />
positive rate, which is 0.03 %, ten times less than the recorded<br />
false positive rate <strong>of</strong> 0.3 % for grayscale features.<br />
V. SUBSEQUENT STAGES: TRACKING AND RECOGNITION<br />
Real-life <strong>traffic</strong> <strong>sign</strong> <strong>detection</strong> systems generally also include<br />
a recognition and tracking step (if processing videos).<br />
For recognition researchers usually apply standard machine<br />
learning techniques, such as neural networks, support vector<br />
machines, LDA and similar. In tracking, there are two dominant<br />
approaches: KLT tracker and particle filters.<br />
Detailed study <strong>of</strong> recognition and tracking techniques is<br />
outside the scope <strong>of</strong> this paper. Recognition, tracking and<br />
<strong>detection</strong> are interwoven - tracking helps verify both <strong>detection</strong><br />
and recognition hypothesis (as more samples are obtained as<br />
the time passes), while recognition reduces false positives in<br />
<strong>detection</strong>. If a <strong>sign</strong> candidate cannot be classified, then it was<br />
probably not a <strong>sign</strong> at all.<br />
VI. CASE STUDIES<br />
The detectors outlined in the previous sections (color-based,<br />
shape-based, learning-based) are used as building blocks <strong>of</strong><br />
contemporary systems for <strong>traffic</strong> <strong>sign</strong> <strong>detection</strong>. In this section<br />
we will review two such systems, one by Ruta et al. [14] and<br />
the other by Tim<strong>of</strong>te et al. [15].<br />
Ruta et al. [14] present a system for <strong>detection</strong> and recognition<br />
<strong>of</strong> a large number <strong>of</strong> different <strong>traffic</strong> <strong>sign</strong> classes. They<br />
address the necessity for large training sets inherent in machine<br />
learning approaches by using artificial template images <strong>of</strong><br />
<strong>traffic</strong> <strong>sign</strong>s. The <strong>sign</strong>s are detected in several steps. First<br />
the image is thresholded and colors <strong>of</strong> interest are enhanced<br />
(for details, see section II <strong>of</strong> this paper). Shapes <strong>of</strong> interest<br />
are then found using the regular polygon detector similar<br />
to the one described by Loy et al. [17]. The extracted <strong>sign</strong><br />
candidates are tracked using Kalman filter. The classification<br />
step uses template matching based on distance transforms<br />
(DTs). Unlike the approach described by Gavrila [19], where<br />
DT was calculated for binarized <strong>sign</strong> image (section III), here<br />
DTs are computed for each color <strong>of</strong> the template. Furthermore,<br />
the candidate shape is not directly matched to the DT image.<br />
Ruta et al. propose a method for selection <strong>of</strong> regions <strong>of</strong> interest<br />
in a template, i.e. the regions which most discriminate the<br />
target <strong>sign</strong> class from all other known classes. Such regions are<br />
found by maximizing the sum <strong>of</strong> dissimilarities between the<br />
template <strong>of</strong> the target <strong>sign</strong> and all other available templates. In<br />
order to enhance the result, the evidence for a <strong>sign</strong> candidate<br />
is accumulated over time. Each observation is weighted, so<br />
that the observations belonging to a longer chain are more
elevant. The idea behind this approach is that when a <strong>traffic</strong><br />
<strong>sign</strong> is first detected it is too small for the classification to work<br />
reliably, so later appearances <strong>of</strong> the <strong>sign</strong> are more valuable.<br />
Experimental results indicate rates <strong>of</strong> correctly detected and<br />
recognized <strong>traffic</strong> <strong>sign</strong>s ranging from 79.4 % for circular <strong>sign</strong>s<br />
with red rim to 97.3 % for blue circular <strong>sign</strong>s.<br />
Fig. 12: Pruning the 3D hypotheses using the MDL principle.<br />
The shorter set <strong>of</strong> hypotheses (right) is preferred over the<br />
longer one (left). Image from [15].<br />
Tim<strong>of</strong>te et al. [15] present a complex system for <strong>traffic</strong> <strong>sign</strong><br />
<strong>detection</strong> and recognition. For the data acquisition they use a<br />
van with eight high-resolution cameras, two on the each side <strong>of</strong><br />
the van. The <strong>detection</strong> is carried out in two phases: (i) singleview<br />
phase and (ii) multi-view phase. In the single-view phase,<br />
the image is first thresholded to find the colors <strong>of</strong> interest.<br />
Also, a tranformation similar to generalized Hough transform<br />
is used for finding the shapes <strong>of</strong> interest. This step is very fast,<br />
and yields very few false negatives. To verify that the extracted<br />
candidates are <strong>traffic</strong> <strong>sign</strong>s, the Viola-Jones detector is ran on<br />
the obtained bounding boxes. For additional verification they<br />
employ an SVM classifier which operates on normalized RGB<br />
channels, pyramids <strong>of</strong> HOGs and discriminative Haar-like<br />
features selected by AdaBoost. To recognize the class <strong>of</strong> the<br />
<strong>traffic</strong> <strong>sign</strong>, six one-vs-all SVMs are used, each corresponding<br />
to one class <strong>of</strong> <strong>traffic</strong> <strong>sign</strong>s (triangular, triangular upside-down,<br />
circular with red rim, circular blue, rectangular, diamondshaped).<br />
In the multi-view phase, first the data collected during<br />
the single-view phase is integrated into hypotheses. Every pair<br />
<strong>of</strong> <strong>detection</strong>s taken from different views is considered. The<br />
pair is checked for geometrical consistency (the position <strong>of</strong><br />
the hypothesis is backprojected to 2D and checked against the<br />
image candidates) and visual consistency (pairs <strong>of</strong> <strong>detection</strong>s<br />
with the same basic shape are favored). Next, the set <strong>of</strong> all<br />
hypotheses is pruned using the minimum description length<br />
(MDL) principle. The idea is to find the smallest possible set<br />
<strong>of</strong> 3D hypotheses which matches the known camera positions<br />
and calibrations and is supported by <strong>detection</strong> evidence. For an<br />
illustration, see figure 12. In the end, the set <strong>of</strong> 2D observations<br />
forming a 3D hypothesis is classified by an SVM classifier.<br />
The majority <strong>of</strong> votes determines the final type as<strong>sign</strong>ed to the<br />
hypothesis, i.e. the exact type <strong>of</strong> the <strong>traffic</strong> <strong>sign</strong>.<br />
VII. CONCLUSION<br />
In this paper, we have presented <strong>traffic</strong> <strong>sign</strong> <strong>detection</strong><br />
<strong>methods</strong> which are <strong>of</strong>ten used as building blocks <strong>of</strong> complex<br />
<strong>detection</strong> systems. The <strong>methods</strong> were divided into color-based,<br />
shape-based and learning-based. We have shown how the<br />
outlined <strong>methods</strong> are used in two state-<strong>of</strong>-the-art <strong>traffic</strong> <strong>sign</strong><br />
<strong>detection</strong> systems.<br />
We think that the complexity <strong>of</strong> <strong>traffic</strong> <strong>sign</strong> <strong>detection</strong><br />
systems will diminish in the future, as technology advances.<br />
With the advancement <strong>of</strong> technology, high quality sensors will<br />
become cheaper and more available in mass production. If<br />
in the future every car is equipped with a high resolution<br />
color camera, a GPS receiver and an odometer, an infrared<br />
camera and other sensors, the problem <strong>of</strong> <strong>traffic</strong> <strong>sign</strong> <strong>detection</strong><br />
will be infinitely more simple then it is now. However, the<br />
advancement will probably proceed slowly, because <strong>of</strong> the<br />
persistent need to minimize production costs.<br />
RE<strong>FER</strong>ENCES<br />
[1] M. Everingham, L. Van Gool, C. K. I. Williams, J. Winn,<br />
and A. Zisserman, “The PASCAL Visual Object Classes<br />
Challenge 2009 (VOC2009) Results,” http://www.pascalnetwork.org/challenges/VOC/voc2009/workshop/index.html.<br />
[2] Inland transport comitee, Convention on road <strong>sign</strong>s and <strong>sign</strong>als. Economic<br />
comission for Europe, 1968.<br />
[3] M. Benallal and J. Meunier, “Real-time color segmentation <strong>of</strong> road<br />
<strong>sign</strong>s,” Electrical and Computer Engineering, 2003. IEEE CCECE 2003.<br />
Canadian Conference on, vol. 3, pp. 1823–1826 vol.3, May 2003.<br />
[4] L. Estevez and N. Kehtarnavaz, “A real-time histographic approach<br />
to road <strong>sign</strong> recognition,” Image <strong>An</strong>alysis and Interpretation, 1996.,<br />
Proceedings <strong>of</strong> the IEEE Southwest Symposium on, pp. 95–100, Apr<br />
1996.<br />
[5] S. Varun, S. Singh, R. S. Kunte, R. D. S. Samuel, and B. Philip, “A<br />
road <strong>traffic</strong> <strong>sign</strong>al recognition system based on template matching employing<br />
tree classifier,” in ICCIMA ’07: Proceedings <strong>of</strong> the International<br />
Conference on Computational Intelligence and Multimedia Applications<br />
(ICCIMA 2007). Washington, DC, USA: IEEE Computer Society, 2007,<br />
pp. 360–365.<br />
[6] A. Broggi, P. Cerri, P. Medici, P. Porta, and G. Ghisio, “Real time road<br />
<strong>sign</strong>s recognition,” Intelligent Vehicles Symposium, 2007 IEEE, pp. 981–<br />
986, June 2007.<br />
[7] A. Ruta, Y. Li, and X. Liu, “Detection, tracking and recognition <strong>of</strong> <strong>traffic</strong><br />
<strong>sign</strong>s from video input,” Oct. 2008, pp. 55 –60.<br />
[8] W.-J. Kuo and C.-C. Lin, “Two-stage road <strong>sign</strong> <strong>detection</strong> and recognition,”<br />
Multimedia and Expo, 2007 IEEE International Conference on,<br />
pp. 1427–1430, July 2007.<br />
[9] G. Piccioli, E. D. Micheli, P. Parodi, and M. Campani, “Robust<br />
method for road <strong>sign</strong> <strong>detection</strong> and recognition,” Image and Vision<br />
Computing, vol. 14, no. 3, pp. 209 – 223, 1996. [Online]. Available:<br />
http://www.sciencedirect.com/science/article/B6V09-3VVCMCX-<br />
4/2/0f2793e7828195ecb68735a80a9ef904<br />
[10] P. Paclík, J. Novovičová, P. Pudil, and P. Somol, “Road <strong>sign</strong> classification<br />
using laplace kernel classifier,” Pattern Recogn. Lett., vol. 21, no. 13-14,<br />
pp. 1165–1173, 2000.<br />
[11] C.-Y. Fang, S.-W. Chen, and C.-S. Fuh, “Road-<strong>sign</strong> <strong>detection</strong> and<br />
tracking,” vol. 52, no. 5, pp. 1329–1341, Sep. 2003.<br />
[12] A. D. L. Escalera, J. M. A. Armingol, and M. Mata, “Traffic <strong>sign</strong><br />
recognition and analysis for intelligent vehicles,” Image and Vision<br />
Computing, vol. 21, pp. 247–258, 2003.<br />
[13] X. Gao, L. Podladchikova, D. Shaposhnikov, K. Hong, and N. Shevtsova,<br />
“Recognition <strong>of</strong> <strong>traffic</strong> <strong>sign</strong>s based on their colour and shape features<br />
extracted using human vision models,” Journal <strong>of</strong> Visual Communication<br />
and Image Representation, vol. 17, no. 4, pp. 675–685, 2006.<br />
[14] A. Ruta, Y. Li, and X. Liu, “Real-time <strong>traffic</strong> <strong>sign</strong> recognition from video<br />
by class-specific discriminative features,” vol. 43, no. 1, pp. 416–430,<br />
2010.<br />
[15] R. Tim<strong>of</strong>te, K. Zimmermann, and L. Van Gool, “Multi-view <strong>traffic</strong> <strong>sign</strong><br />
<strong>detection</strong>, recognition, and 3d localisation,” Snowbird, Utah, 2009, pp.<br />
69–76.<br />
[16] Y.-Y. Nguwi and A. Z. Kouzani, “Detection and classification <strong>of</strong> road<br />
<strong>sign</strong>s in natural environments,” Neural Comput. Appl., vol. 17, no. 3,<br />
pp. 265–289, 2008.
[17] G. Loy, “Fast shape-based road <strong>sign</strong> <strong>detection</strong> for a driver assistance<br />
system,” in In IEEE/RSJ International Conference on Intelligent Robots<br />
and Systems (IROS, 2004, pp. 70–75.<br />
[18] C. Paulo and P. Correia, “Automatic <strong>detection</strong> and classification <strong>of</strong> <strong>traffic</strong><br />
<strong>sign</strong>s,” in Image <strong>An</strong>alysis for Multimedia Interactive Services, 2007.<br />
WIAMIS ’07. Eighth International Workshop on, June 2007.<br />
[19] D. Gavrila, “Traffic <strong>sign</strong> recognition revisited,” in DAGM-Symposium,<br />
1999, pp. 86–93.<br />
[20] P. Viola and M. Jones, “Robust real-time object <strong>detection</strong>,” in International<br />
Journal <strong>of</strong> Computer Vision, 2001.<br />
[21] K. Brkić, A. Pinz, and S. ˇSegvić, “Traffic <strong>sign</strong> <strong>detection</strong> as a component<br />
<strong>of</strong> an automated <strong>traffic</strong> infrastructure inventory system,” Stainz, Austria,<br />
May 2009.<br />
[22] K. Brkić, S. ˇSegvić, Z. Kalafatić, I. Sikirić, and A. Pinz, “Generative<br />
modeling <strong>of</strong> spatio-temporal <strong>traffic</strong> <strong>sign</strong> trajectories,” held in conjuction<br />
with CVPR2010, San Francisco, California, Jun. 2010.<br />
[23] S.-Y. Chen and J.-W. Hsieh, “Boosted road <strong>sign</strong> <strong>detection</strong> and recognition,”<br />
Machine Learning and Cybernetics, 2008 International Conference<br />
on, vol. 7, pp. 3823–3826, July 2008.<br />
[24] X. Baro and J. Vitria, “Fast <strong>traffic</strong> <strong>sign</strong> <strong>detection</strong> on greyscale images,”<br />
Recent Advances in Artificial Intelligence Research and Development,<br />
pp. 69–76, October 2004.<br />
[25] R. Lienhart and J. Maydt, “<strong>An</strong> extended set <strong>of</strong> Haar-like features for<br />
rapid object <strong>detection</strong>,” in IEEE ICIP 2002, 2002, pp. 900–903.<br />
[26] S. Escalera and P. Radeva, “Fast greyscale road <strong>sign</strong> model matching<br />
and recognition,” Recent Advances in Artificial Intelligence Research<br />
and Development, pp. 69–76, 2004.