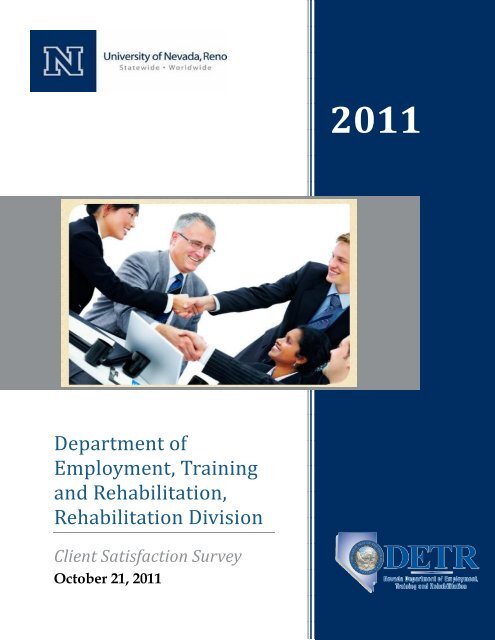
Department of Employment, Training and Rehabilitation ...
Department of Employment, Training and Rehabilitation ...
Department of Employment, Training and Rehabilitation ...

Create successful ePaper yourself
Turn your PDF publications into a flip-book with our unique Google optimized e-Paper software.
<strong>Department</strong> <strong>of</strong><br />
<strong>Employment</strong>, <strong>Training</strong><br />
<strong>and</strong> <strong>Rehabilitation</strong>,<br />
<strong>Rehabilitation</strong> Division<br />
Client Satisfaction Survey<br />
October 21, 2011<br />
2011<br />
NEVADA<br />
Kemberlee Bonnet,
Nevada <strong>Department</strong> <strong>of</strong> <strong>Employment</strong>, <strong>Training</strong> <strong>and</strong> <strong>Rehabilitation</strong><br />
2011 General Client Satisfaction Survey<br />
Kemberlee Bonnet, M.A.<br />
Graduate Research Assistant, Center for Research Design <strong>and</strong> Analysis<br />
(CRDA)<br />
Fan Zhang<br />
Biostatistician, <strong>Department</strong> <strong>of</strong> Resource Economics<br />
(CABNR)<br />
Veronica Blas Dahir, Ph.D. 1<br />
Associate Director, CRDA<br />
Principal Investigator<br />
Wei Yang, M.D., Ph.D. 2<br />
Pr<strong>of</strong>essor <strong>and</strong> Director, CHSI <strong>and</strong> Co-Principal Investigator<br />
©2011 Center for Research Design <strong>and</strong> Analysis<br />
1 Please direct any correspondence about this report to Dr. Veronica Dahir at veronicad@unr.edu or 775-784-6718.<br />
2 Please direct any questions about the data analysis to Dr. Wei Yang at weiyang@unr.edu or 775-682-1094.
Nevada <strong>Department</strong> <strong>of</strong> <strong>Employment</strong>, <strong>Training</strong> <strong>and</strong> <strong>Rehabilitation</strong><br />
2011 General Client Satisfaction Survey<br />
ACKNOWLEDGEMENTS<br />
We would like to thank Chris Sanchez, Survey Lab Manager, for the<br />
management <strong>of</strong> the data collection; Martha Rodriguez, Graduate Student<br />
<strong>and</strong> Assistant Survey Manager, for the supervision <strong>of</strong> the data collection<br />
process <strong>and</strong> creating the training materials; Adrienne Leipold for setting up<br />
the database, managing mailings, <strong>and</strong> assistance with the completion <strong>of</strong> the<br />
report. We’d also like to thank all the survey lab interviewers <strong>and</strong> other<br />
supervisors at the Center for Research Design <strong>and</strong> Analysis for their hard<br />
work in the data collection process.<br />
We would also like to thank the Nevada <strong>Department</strong> <strong>of</strong> <strong>Employment</strong>,<br />
<strong>Training</strong> <strong>and</strong> <strong>Rehabilitation</strong>, <strong>Rehabilitation</strong> Division. Specifically, we are<br />
grateful for Tammy M<strong>of</strong>fitt’s assistance throughout each stage <strong>of</strong> the<br />
project, for Heather Johnson’s help in providing the sampling frame<br />
database, <strong>and</strong> for Beth Talcott’s administrative assistance on the project.<br />
Finally, we would also like to recognize Javier Garcia, IT Technician II, for<br />
programming the survey instruments, developing the website for the<br />
project, <strong>and</strong> aiding with the data management.
Nevada <strong>Department</strong> <strong>of</strong> <strong>Employment</strong>, <strong>Training</strong> <strong>and</strong> <strong>Rehabilitation</strong><br />
2011 General Client Satisfaction Survey<br />
Table <strong>of</strong> Contents<br />
Executive Summary ............................................................................................................... ii<br />
Introduction .............................................................................................................................1<br />
Methodology .................................................................................................................................. 2<br />
Results .......................................................................................................................................4<br />
Client Characteristics .................................................................................................................... 4<br />
Satisfaction with Vocational <strong>Rehabilitation</strong> Division ............................................................... 8<br />
Experiences with the Program, Counselors, <strong>and</strong> Other Staff ................................................ 10<br />
Ability to Choose ......................................................................................................................... 12<br />
Overall Satisfaction with Specific Services Received from the Program ............................. 13<br />
Recommending the Program to Others .................................................................................... 14<br />
Specific Services: Utilization <strong>and</strong> Satisfaction ......................................................................... 15<br />
Currently Employed Clients ...................................................................................................... 24<br />
Currently Unemployed Clients ................................................................................................. 26<br />
Client Reactions <strong>and</strong> Suggestions ............................................................................................. 28<br />
Service Location ........................................................................................................................... 28<br />
Appendix A: Post-Weighting Methodology .....................................................................30<br />
Appendix B: General Client Satisfaction Survey ..............................................................32<br />
Appendix C: Cover Letter Invitations................................................................................73<br />
Appendix D: Website Information about Study .............................................................76<br />
Appendix E. List <strong>of</strong> Nevada Areas Called ........................................................................80<br />
Appendix F: Data Tables ......................................................................................................82<br />
Appendix G: Open Ended Response Themes .................................................................194
Nevada <strong>Department</strong> <strong>of</strong> <strong>Employment</strong>, <strong>Training</strong> <strong>and</strong> <strong>Rehabilitation</strong><br />
2011 General Client Satisfaction Survey<br />
Executive Summary<br />
A mixed-mode telephone <strong>and</strong> web-based survey was conducted from March 2011-May 2011 to<br />
assess the satisfaction <strong>of</strong> services received by <strong>Rehabilitation</strong> Division clients <strong>of</strong> the State <strong>of</strong><br />
Nevada <strong>Department</strong> <strong>of</strong> <strong>Employment</strong>, <strong>Training</strong> <strong>and</strong> <strong>Rehabilitation</strong>. These clients received<br />
services from the Division between October 2009 <strong>and</strong> September 2010. A total <strong>of</strong> 516<br />
interviews were completed (465 on the telephone, 53 on the internet), for a raw response rate <strong>of</strong><br />
42%. A cooperation rate <strong>of</strong> 84% (516 total out <strong>of</strong> 616 clients reached) was achieved for the<br />
telephone interviews.<br />
Clients’ evaluations <strong>of</strong> the Vocational <strong>Rehabilitation</strong> Division were generally positive. Aside from<br />
the overall quality <strong>of</strong> services, which was rated as strongly or somewhat satisfied by 75% <strong>of</strong><br />
clients, clients (72%) were also happy with the timeliness <strong>of</strong> services. The majority <strong>of</strong> clients<br />
were also very satisfied with their counselors <strong>and</strong> other Vocational <strong>Rehabilitation</strong> staff.<br />
Approximately 63% <strong>of</strong> clients reported being strongly or somewhat satisfied with the amount <strong>of</strong><br />
choice they had in terms <strong>of</strong> available providers <strong>of</strong> services <strong>and</strong> approximately 66% <strong>of</strong> clients<br />
reported being strongly or somewhat satisfied with the ability <strong>of</strong> the program to help them keep<br />
a job. Approximately 81% said they would recommend the Vocational <strong>Rehabilitation</strong> program.<br />
With respect to the specific utilization <strong>of</strong> services, 75% <strong>of</strong> clients indicated that they were<br />
satisfied with the Program’s services. The most common services received fell into the following<br />
four categories: counselor-based assessment, assistive technology devices, transportation, <strong>and</strong><br />
vision devices. The largest percentage <strong>of</strong> clients received all or a majority <strong>of</strong> their services from<br />
one <strong>of</strong> the four Las Vegas locations or one <strong>of</strong> the two Reno locations. Eight percent or less <strong>of</strong><br />
clients received services from other locations.<br />
Almost half <strong>of</strong> the participants (49%) were employed. Of those employed, 42% said that they<br />
had received their current job as a result <strong>of</strong> the Vocational <strong>Rehabilitation</strong> program’s services.<br />
Approximately 70% <strong>of</strong> employed clients indicated that they had the kind <strong>of</strong> job they wanted, <strong>and</strong><br />
79% liked their current jobs. An overwhelming number <strong>of</strong> those currently employed (92%) also<br />
felt that they had the skills they needed to keep their jobs. However, less than half said that the<br />
Vocational <strong>Rehabilitation</strong> services had been useful in helping to get their current job (53%) <strong>and</strong><br />
only 47% stated that the services were useful in helping to keep their current job. For those who<br />
were not employed, the most common reasons cited for their current unemployment included:<br />
not being able to find any job (18%), their disability (12%), <strong>and</strong> being fired or laid <strong>of</strong>f from a<br />
previous job (21%); or could not find a job in which they were qualified.<br />
Finally, survey participants were given the opportunity to comment on the strengths <strong>of</strong> the<br />
program as well as improvements that could be made to strengthen the program in the future.<br />
Typical improvements that were suggested included providing more counselors with disability<br />
experience, customized job placement, participant screening/disability verification, <strong>and</strong><br />
updates/follow-ups from counselors. Typical strengths that were reported included the health<br />
support, assessments <strong>and</strong> job leads, <strong>and</strong> work-related accommodations, courses, <strong>and</strong><br />
networking resources.<br />
ii
Introduction<br />
A mixed-mode telephone <strong>and</strong> web-based survey was conducted by the Center for Research<br />
Design <strong>and</strong> Analysis (herein referred to as the “Center” or “CRDA”) to assess client satisfaction<br />
with the vocational rehabilitation services provided by the State <strong>of</strong> Nevada <strong>Department</strong> <strong>of</strong><br />
<strong>Employment</strong>, <strong>Training</strong> <strong>and</strong> <strong>Rehabilitation</strong>, <strong>Rehabilitation</strong> Division (herein referred to as “the<br />
Division”). Data collection began in March, 2011 <strong>and</strong> ended in May, 2011.<br />
The survey utilized an instrument that was used in the previous year for the same assessment<br />
objectives. Changes to the instrument included modification <strong>of</strong> the assistive technology services<br />
questions <strong>and</strong> the addition <strong>of</strong> several questions regarding employment history. A copy <strong>of</strong> the<br />
telephone version <strong>of</strong> the survey instrument is presented in Appendix B. The web-based version<br />
<strong>of</strong> the survey contained identical items; however, the introductory section was omitted. Appendix<br />
C contains examples <strong>of</strong> the two introductory letters that were mailed to clients <strong>and</strong> Appendix D<br />
contains website information about the survey. All Figures are located within the text <strong>of</strong> the<br />
report, <strong>and</strong> all Tables referenced within the report are located in Appendix E. Additionally, the<br />
most common responses to the last two open-survey items can be found in Appendix F.<br />
Post-stratification weighting was used to make the responses from the sample better reflect the<br />
entire population <strong>of</strong> clients. During analyses, weights were applied so that the responses from<br />
each group were represented in the overall results, in proportion to their real size in the<br />
population. This strategy corrects for inaccurate conclusions that can be drawn if the survey<br />
over-represented some groups, while under-representing others. Detailed information regarding<br />
the weighting methodology is provided in Appendix A. All tables listed in the report indicate<br />
confidence intervals (C.I.), the unweighted sample response frequency (“N”), <strong>and</strong> the weighted<br />
prevalence rates in percentages (%) 1 . Throughout the text <strong>of</strong> this report, all results mentioned<br />
refer to the weighted analyses, unless otherwise stated.<br />
1 For all tables:<br />
� C.I. = Confidence Interval. The points (range) between which the true population parameter (population estimate) will fall<br />
95% <strong>of</strong> the time, if statistical assumptions regarding sampling are met.<br />
� “N”= sample response frequency (unweighted)<br />
� “%”= weighted prevalence rates<br />
1
Methodology<br />
The sample for the survey was drawn from a list <strong>of</strong> all rehabilitation clients who were deemed<br />
eligible to receive services between October 1, 2009 <strong>and</strong> September 30, 2010. This list was<br />
provided by the Division <strong>and</strong> was comprised <strong>of</strong> all clients who went through the Application <strong>and</strong><br />
Eligibility processes. Once they had been determined eligible, a Plan was developed for<br />
services. Only those clients deemed eligible for services were included in the sampling frame<br />
provided by the Division.<br />
Table 1: Vocational <strong>Rehabilitation</strong> Population <strong>and</strong> Completed Interviews Distribution by<br />
Stratum<br />
STRATUM CLIENT POPULATION COMPLETED SURVEYS<br />
1: Southern Nevada 668 (53.83%) 263 (50.97%)<br />
2: Northern Nevada 415 (33.44%) 178 (34.50%)<br />
3: Rural Nevada 158 (12.73) 75 (14.54%)<br />
Total 1241 (100%) 516 (100%)<br />
This population originally contained 1,515 clients. From this list, 271 were removed because<br />
they did not keep in contact with DETR, did not have contact information, were deceased, or no<br />
longer lived in Nevada. This process resulted in a final population <strong>of</strong> 1,241 clients. For this<br />
survey, the entire population was sampled. Table 1 illustrates how the client population <strong>and</strong> final<br />
number <strong>of</strong> completed interviews were represented by stratum.<br />
Of the 1,241 clients in the population <strong>and</strong> sample, 168 were listed in the Division records as<br />
having hearing impairments. In March 2011, all clients, including the hearing impaired clients,<br />
were sent a cover letter introducing the survey <strong>and</strong> an invitation to participate in either the<br />
phone or web-version <strong>of</strong> the survey (see Appendix C).<br />
A total <strong>of</strong> 208 letters were returned to the CRDA. Out <strong>of</strong> these, 35 were returned with a new<br />
forwarding address. All letters that were returned with a new forwarding address for a client<br />
were updated in the database <strong>and</strong> re-mailed if the client had not already completed the survey<br />
by either phone or web.<br />
The calling protocol for contacting clients was set at 8 call attempts. In addition, it was<br />
determined by the Division <strong>and</strong> CRDA that CRDA’s 1-800 telephone number would be left on<br />
answering machines on the 3rd, 6th, <strong>and</strong> 8th call attempts. Additionally, the website address for<br />
the survey was left on answering machines on the 6th call attempt. CRDA also called back all<br />
“s<strong>of</strong>t” refusals 2 . Thus, the calling protocol was 8 call attempts with no contact, two “s<strong>of</strong>t” refusals,<br />
2 A “s<strong>of</strong>t” refusal is considered one in which the informant (the person that answered the phone) or the respondent<br />
(the Vocational <strong>Rehabilitation</strong> client), seemed interested in participating but the interviewer just called at an<br />
inconvenient time (e.g., “We’re in the middle <strong>of</strong> dinner,” “I was just running out the door.”) A “hard” refusal is a call<br />
where the informant or the respondent is rude to the interviewer, uses pr<strong>of</strong>anity, or says something like, “Take me <strong>of</strong>f<br />
your list!” or “Don’t ever call back!”<br />
2
or one “hard” refusal, regardless <strong>of</strong> the number <strong>of</strong> call attempts made.<br />
There were 322 phone numbers provided by the Division that were no longer correct or were<br />
disconnected. The accuracy <strong>of</strong> a further 215 numbers could not be determined because no one<br />
in the residence answered the telephone over the course <strong>of</strong> the eight call protocol. Another 13<br />
<strong>of</strong> those in the sample were deemed to be ineligible because they said they had never received<br />
any services from the Division. Two sampled individuals could not complete the interview<br />
because they did not speak English <strong>and</strong> three clients had impairments too severe to complete<br />
the interview. Ten clients were sent informative letters inviting them to complete the study via<br />
the web after interviewers learned that their disability would make it difficult for them to complete<br />
the interview by telephone. Thirteen otherwise eligible clients could not complete the interview<br />
because they were out <strong>of</strong> the state or not at their place <strong>of</strong> residence for the duration <strong>of</strong> data<br />
collection.<br />
A total <strong>of</strong> 516 interviews were completed (465 on the telephone, 53 on the internet), for a raw<br />
response rate <strong>of</strong> 42% (516 out <strong>of</strong> 1,241). Of the 1,241 eligible clients in the population, (from an<br />
original list <strong>of</strong> 1515) interviewers made some type <strong>of</strong> verbal contact with 616 clients. Of these<br />
616, 450 completed the entire interview, 18 partially completed the interview, 41 refused to<br />
participate, <strong>and</strong> 107 never started the interview <strong>and</strong> never refused. Excluding the respondents<br />
that were never reached, a cooperation rate <strong>of</strong> 84% (516 out <strong>of</strong> 616) was achieved for both the<br />
telephone <strong>and</strong> web interviews. The raw response rate for this year’s survey (42%) was up 4%<br />
from the rate obtained for the 2010 General Client Satisfaction Survey (38%), up 2% from the<br />
rate obtained for the 2009 survey (40%), <strong>and</strong> up 6% from the rate obtained for the 2008 survey<br />
(36%). These slight changes in raw responses rates may be due to a number <strong>of</strong> factors,<br />
including the accuracy <strong>of</strong> the initial sampling frame.<br />
3
Results<br />
All results are illustrated in tables in Appendix E <strong>of</strong> this report. It is suggested that the reader<br />
consult the tables for further detail or clarification. As stated above, throughout this report all<br />
results mentioned in text refer to the weighted analyses unless otherwise stated.<br />
Client Characteristics<br />
Slightly more women (51%) than men (49%) receive services from the Vocational <strong>Rehabilitation</strong><br />
Division <strong>and</strong> most clients are between the ages <strong>of</strong> 35 <strong>and</strong> 64 (74%; see Table 2). Additionally,<br />
the majority <strong>of</strong> clients are located in the Southern stratum <strong>of</strong> the state (54%), with smaller<br />
numbers in the Northern (33%), <strong>and</strong> Rural (13%) strata. The Division serves clients with a wide<br />
variety <strong>of</strong> impairments, <strong>of</strong> which the most common are “psychosocial impairments” (15.4%),<br />
“respiratory impairments” (13.5%), <strong>and</strong> “cognitive impairments” (see Table 2 or Figure A1).<br />
Some <strong>of</strong> the clients had mental impairments <strong>of</strong> anxiety disorder, mental retardation, autism,<br />
specific learning disabilities, <strong>and</strong> alcohol/drug abuse or dependence; however the specific<br />
percentages in the sample cannot be determined. Some <strong>of</strong> the clients reported hearing<br />
impairments such as congenital conditions, traumatic brain injury, <strong>and</strong> cancer; however the<br />
specific percentages for these impairments in the sample also cannot be determined.<br />
4
5<br />
Nevada <strong>Department</strong> <strong>of</strong> <strong>Employment</strong>, <strong>Training</strong> <strong>and</strong> <strong>Rehabilitation</strong><br />
2011 General Client Satisfaction Survey<br />
Table 2: Gender, Age, Stratum, Disability Characteristics <strong>of</strong> the Vocational <strong>Rehabilitation</strong> Population<br />
Response<br />
Frequency<br />
(N) a<br />
Weighted<br />
Response<br />
Frequency<br />
Weighted<br />
Response<br />
Rate (%) c<br />
C.I. (95%)d<br />
Total 516 1241 100% 100.0 100.0<br />
Gender<br />
Male<br />
Female<br />
254<br />
262<br />
604<br />
637<br />
48.7<br />
51.3<br />
44.1<br />
46.7<br />
53.3<br />
55.9<br />
Age<br />
Stratum<br />
Disability Type<br />
Mobility<br />
Orthopedic/Neurological<br />
Impairments<br />
Other Hearing<br />
Impairments<br />
Other Mental<br />
Impairments<br />
Other Orthopedic<br />
Impairments<br />
Other Physical<br />
Impairments<br />
Other Visual<br />
Impairments<br />
Psychosocial<br />
Impairments<br />
Respiratory<br />
Impairments<br />
Deafness,<br />
Communication<br />
Auditory<br />
Deafness,<br />
Communication Visual<br />
6<br />
Nevada <strong>Department</strong> <strong>of</strong> <strong>Employment</strong>, <strong>Training</strong> <strong>and</strong> <strong>Rehabilitation</strong><br />
2011 General Client Satisfaction Survey<br />
19 45 3.6 1.9 5.3<br />
25 57 4.6 2.7 6.4<br />
6 14 1.1 0.2 2.1<br />
6 14 1.1 0.2 2.0<br />
37 92 7.4 5.0 9.8<br />
18 40 3.2 1.7 4.8<br />
80 191 15.4 12.1 18.6<br />
73 167 13.5 10.5 16.5<br />
30 73 5.9 3.8 8.1<br />
47 107 8.6 6.2 11.1<br />
Hearing Loss,<br />
Communication<br />
Auditory<br />
1 2 0.2 0.0 0.6<br />
Other 36 90 7.3 4.9 9.6
Mobility Orthopedic/Neurological Impairments<br />
Figure A1: Client's Primary Disability<br />
Other Mental Impairments<br />
Other Physical Impairments<br />
Cognitive Impairments<br />
Other Visual Impairments<br />
Psychosocial Impairments<br />
Blindness<br />
Other Orthopedic Impairments<br />
Hearing Loss, Communication Visual<br />
Hearing Loss, Communication Auditory<br />
Other Hearing Impairments<br />
Other Hearing Impairments<br />
Deafness, Communication Visual<br />
Manipulation / Dexterity<br />
Mobility <strong>and</strong> Manipulation<br />
General Physical Debilitation<br />
Deafness, Communication Auditory<br />
Respiratory Impairments<br />
No Impairments<br />
9.1%<br />
7.1%<br />
7.1%<br />
6.0%<br />
5.8%<br />
4.8%<br />
3.7%<br />
3.5%<br />
3.1%<br />
1.2%<br />
1.2%<br />
1.2%<br />
1.1%<br />
1.0%<br />
0.2%<br />
0.2%<br />
7<br />
Nevada <strong>Department</strong> <strong>of</strong> <strong>Employment</strong>, <strong>Training</strong> <strong>and</strong> <strong>Rehabilitation</strong><br />
2011 General Client Satisfaction Survey<br />
15.4%<br />
14.1%<br />
12.9%<br />
0% 5% 10% 15% 20%<br />
Primary Disability
Nevada <strong>Department</strong> <strong>of</strong> <strong>Employment</strong>, <strong>Training</strong> <strong>and</strong> <strong>Rehabilitation</strong><br />
2011 General Client Satisfaction Survey<br />
Satisfaction with the Vocational <strong>Rehabilitation</strong> Division<br />
Clients were asked several questions to assess their level <strong>of</strong> satisfaction with specific aspects <strong>of</strong><br />
the Vocational <strong>Rehabilitation</strong> Division. Overall, the majority <strong>of</strong> clients indicated that they were<br />
generally satisfied with the Division (see Figure 1). Tables Q1-Q4 in Appendix E also provides<br />
details <strong>of</strong> responses by gender, age, region, <strong>and</strong> current employment status.<br />
Approximately 75% percent <strong>of</strong> all clients were somewhat or very satisfied with the overall<br />
services they received from the Vocational <strong>Rehabilitation</strong> Division, whereas approximately 17%<br />
were somewhat or very dissatisfied (see also Table Q1 <strong>and</strong> Figure 1). A progressively lower<br />
percentage <strong>of</strong> clients were satisfied with the timeliness <strong>of</strong> the services they received from the<br />
Division (72% satisfied <strong>and</strong> 16% dissatisfied; see also Table Q2 <strong>and</strong> Figure 1), the amount <strong>of</strong><br />
choice between providers <strong>of</strong> services they felt they had (63% satisfied <strong>and</strong> 22% dissatisfied; see<br />
also Table Q3 <strong>and</strong> Figure 1), <strong>and</strong> the ability <strong>of</strong> the program to help clients get or keep a job<br />
(60% satisfied <strong>and</strong> 24% dissatisfied; see also Table Q4 <strong>and</strong> Figure 1).<br />
80%<br />
70%<br />
60%<br />
50%<br />
40%<br />
30%<br />
20%<br />
10%<br />
0%<br />
Figure 1: Client Satisfaction Ratings with<br />
Vocational <strong>Rehabilitation</strong> Division<br />
74.8%<br />
16.7% 16.0%<br />
71.5%<br />
Overall Services Timeliness <strong>of</strong><br />
Services<br />
8<br />
21.6%<br />
62.8%<br />
Amount <strong>of</strong><br />
Choice<br />
23.6%<br />
59.5%<br />
Ability to<br />
Get/Keep Job<br />
Very/Somewhat Dissatisfied Very/Somewhat Satisfied
Nevada <strong>Department</strong> <strong>of</strong> <strong>Employment</strong>, <strong>Training</strong> <strong>and</strong> <strong>Rehabilitation</strong><br />
2011 General Client Satisfaction Survey<br />
Of particular interest are the differences in satisfaction based on employment status <strong>and</strong> region<br />
<strong>of</strong> residence. In comparison to unemployed clients, a noticeably larger percentage <strong>of</strong> employed<br />
clients reported being ‘very satisfied’ across all satisfaction domains, with the exception <strong>of</strong> the<br />
overall services domain (see Figure 2 <strong>and</strong> Tables 1-4).<br />
70%<br />
60%<br />
50%<br />
40%<br />
30%<br />
20%<br />
10%<br />
0%<br />
Figure 2: Percentage <strong>of</strong> Clients who Reported<br />
being 'Very Satisfied' with Vocational<br />
<strong>Rehabilitation</strong> Division by <strong>Employment</strong> Status<br />
63.0%<br />
41.2%<br />
39.7%<br />
56.7%<br />
Overall Services Timeliness <strong>of</strong><br />
Services<br />
9<br />
33.6%<br />
48.1%<br />
Amount <strong>of</strong><br />
Choice<br />
26.8%<br />
Not Currently Employed Currently Employed<br />
58.2%<br />
Ability to<br />
Get/Keep Job
Nevada <strong>Department</strong> <strong>of</strong> <strong>Employment</strong>, <strong>Training</strong> <strong>and</strong> <strong>Rehabilitation</strong><br />
2011 General Client Satisfaction Survey<br />
Experiences with the Vocational <strong>Rehabilitation</strong> Program,<br />
Counselors, <strong>and</strong> Other Staff<br />
Vocational <strong>Rehabilitation</strong> clients were consistently positive in their assessments <strong>of</strong> their specific<br />
experiences with their counselors <strong>and</strong> other Vocational <strong>Rehabilitation</strong> staff. For each <strong>of</strong> the five<br />
specific items that asked about their experiences with their counselors, the majority <strong>of</strong> clients<br />
chose to agree with positive evaluations (see Figure 3). Approximately 78% agreed, either<br />
somewhat or strongly, that their counselors were underst<strong>and</strong>ing <strong>of</strong> their needs (see Table Q5a).<br />
Further, approximately 76% <strong>of</strong> clients indicated that their counselors were easy to contact (see<br />
Table Q5b), <strong>and</strong> most clients (82%) were satisfied with the way their counselors treated them<br />
(see Table Q5c). In fact, 76% indicated that they were satisfied with the amount <strong>of</strong> access they<br />
had to their counselors (see Table Q5e) <strong>and</strong> 85% agreed that their counselors treated them with<br />
respect (see Table Q5f).<br />
Assessment <strong>of</strong> Vocational <strong>Rehabilitation</strong> counselors varied by region (see Figure 3). When<br />
compared to Rural <strong>and</strong> Southern clients, a higher percentage <strong>of</strong> Northern clients strongly<br />
agreed with each question (see also Tables Q5a-Q5f).<br />
10
80%<br />
70%<br />
60%<br />
50%<br />
40%<br />
30%<br />
20%<br />
10%<br />
0%<br />
58.5%<br />
64.5%<br />
59.1%<br />
Counselor<br />
underst<strong>and</strong>ing <strong>of</strong><br />
needs (N=314)<br />
Figure 3: Experiences with VR Counselors by<br />
Region (General)<br />
49.1%<br />
57.5%<br />
56.1%<br />
Counselor easy to<br />
contact (N=272)<br />
61.1%<br />
11<br />
70.3%<br />
Nevada <strong>Department</strong> <strong>of</strong> <strong>Employment</strong>, <strong>Training</strong> <strong>and</strong> <strong>Rehabilitation</strong><br />
2011 General Client Satisfaction Survey<br />
67.3%<br />
49.4%<br />
57.9%<br />
56.2%<br />
69.0%<br />
74.8%<br />
65.6%<br />
Satisfied with way Satisfied with access to Counselor treated me<br />
counselor treated me<br />
(N=337)<br />
counselor (N=273) with respect (N=363)<br />
Southern Northern Rural<br />
*Percentage ‘Strongly Agreed' Reported
Nevada <strong>Department</strong> <strong>of</strong> <strong>Employment</strong>, <strong>Training</strong> <strong>and</strong> <strong>Rehabilitation</strong><br />
2011 General Client Satisfaction Survey<br />
Clients were equally happy with other <strong>Rehabilitation</strong> staff members, with approximately 80%<br />
agreeing, that they were satisfied with the way other Vocational <strong>Rehabilitation</strong> Staff treated them<br />
(see Figure 4 or Table Q5d). Approximately 8% <strong>of</strong> clients disagreed, either strongly or<br />
somewhat, with this statement.<br />
100%<br />
80%<br />
60%<br />
40%<br />
20%<br />
0%<br />
Ability to Choose<br />
8.4%<br />
Strongly/Somewhat<br />
Disagree<br />
Clients were somewhat less happy with the amount <strong>of</strong> choice they had during the vocational<br />
rehabilitation process. While the majority <strong>of</strong> clients (69%) agreed that they were able to choose<br />
the kind <strong>of</strong> help they received, a sizeable minority (18%) disagreed with that statement (see<br />
Figure 5 <strong>and</strong> Table Q5g).<br />
80%<br />
60%<br />
40%<br />
20%<br />
0%<br />
Figure 4: Satisfied with way Treated by<br />
other Vocational <strong>Rehabilitation</strong> Staff<br />
18.1%<br />
12<br />
79.1%<br />
Strongly/Somewhat<br />
Agree<br />
Figure 5: Clients' Perception <strong>of</strong> Ability to<br />
Choose the Kind <strong>of</strong> Help Received<br />
69.2%<br />
Strongly/Somewhat<br />
Disagree<br />
Strongly/Somewhat<br />
Agree
Nevada <strong>Department</strong> <strong>of</strong> <strong>Employment</strong>, <strong>Training</strong> <strong>and</strong> <strong>Rehabilitation</strong><br />
2011 General Client Satisfaction Survey<br />
Overall Satisfaction with Services Received from<br />
the Vocational <strong>Rehabilitation</strong> Program<br />
When respondents were initially asked to indicate their level <strong>of</strong> satisfaction with their services<br />
received from the Vocational <strong>Rehabilitation</strong> Division, approximately 75% <strong>of</strong> all clients were<br />
somewhat or very satisfied, compared with 17% who were somewhat or very dissatisfied (see<br />
Table Q1). Respondents were later asked a similar question with respect to the services they<br />
received from the Vocational <strong>Rehabilitation</strong> Program <strong>and</strong> their answers produced similar results;<br />
72% <strong>of</strong> clients either somewhat or strongly agreed while 18% either somewhat or strongly<br />
disagreed that they were satisfied with Program services (see Figure 6 or Table Q5h).<br />
Regionally, those in the Northern areas were more likely to strongly agree that they were<br />
satisfied with the Program services received (62%) compared to those in the Southern region<br />
(54%) <strong>and</strong> the Rural region (51%; see Table Q5h). Those who were currently employed were<br />
also more likely to strongly agree that they were satisfied with the services that they received<br />
(69%) than those that were unemployed (44%). These regional <strong>and</strong> employment status<br />
differences in Program service satisfaction are similar to those found when clients were asked<br />
to indicate if they were satisfied with Division services.<br />
80%<br />
70%<br />
60%<br />
50%<br />
40%<br />
30%<br />
20%<br />
10%<br />
0%<br />
Figure 6: Clients' Overall Satisfaction with<br />
Services Received from the Vocational<br />
<strong>Rehabilitation</strong> Program<br />
18.1%<br />
Strongly/Somewhat<br />
Disagree<br />
13<br />
72.4%<br />
Strongly/Somewhat Agree
Program Recommendation<br />
Nevada <strong>Department</strong> <strong>of</strong> <strong>Employment</strong>, <strong>Training</strong> <strong>and</strong> <strong>Rehabilitation</strong><br />
2011 General Client Satisfaction Survey<br />
Overall, 81% <strong>of</strong> clients said that they would recommend Nevada’s Vocational <strong>Rehabilitation</strong><br />
services to others who might need it. Nearly 14% said they would not recommend it, <strong>and</strong> 6%<br />
were non-committal (see Figure 7 or Table Q5i).<br />
90%<br />
80%<br />
70%<br />
60%<br />
50%<br />
40%<br />
30%<br />
20%<br />
10%<br />
0%<br />
Figure 7: Would Recommend Vocational<br />
<strong>Rehabilitation</strong> Services to Others in Need<br />
13.6%<br />
14<br />
80.5%<br />
Strongly/Somewhat Disagree Strongly/Somewhat Agree
Nevada <strong>Department</strong> <strong>of</strong> <strong>Employment</strong>, <strong>Training</strong> <strong>and</strong> <strong>Rehabilitation</strong><br />
2011 General Client Satisfaction Survey<br />
Specific Services: Client Utilization <strong>and</strong> Satisfaction<br />
See Figure 8 below for a compilation <strong>of</strong> the percentage <strong>of</strong> clients who utilized <strong>and</strong> rated each <strong>of</strong><br />
the services listed in the section below. See also Tables 6a, 7a, 8a, 9a, 10a, 12a <strong>and</strong> 13a.<br />
Figure 8: Vocational <strong>Rehabilitation</strong> Services used<br />
by Clients<br />
Assistive technology<br />
Counselor-based assessment<br />
Transportation<br />
Community-based assessment<br />
Post-employment<br />
On-the-job training<br />
Interpreter<br />
4.6%<br />
15<br />
28.2%<br />
24.6%<br />
30.8%<br />
44.5%<br />
59.0%<br />
57.0%<br />
0% 20% 40% 60% 80%<br />
Percentage <strong>of</strong> clients who used service
Counselor-Based Assessment<br />
Nevada <strong>Department</strong> <strong>of</strong> <strong>Employment</strong>, <strong>Training</strong> <strong>and</strong> <strong>Rehabilitation</strong><br />
2011 General Client Satisfaction Survey<br />
Counselor-based assessment includes things like job interest <strong>and</strong> aptitude tests, medical tests<br />
(e.g., checkups, x-rays), <strong>and</strong> other evaluations <strong>of</strong> clients’ abilities. Fifty-seven percent <strong>of</strong> clients<br />
said that they received counselor-based assessment services from the Vocational <strong>Rehabilitation</strong><br />
Program (see Figure 8 on the previous page or Table Q6a). Of the clients who received<br />
counselor-based assessment services, 42% rated the assessment services as excellent <strong>and</strong><br />
41% as good, while 11% <strong>of</strong> clients rated these services as fair <strong>and</strong> 5% rated them as poor (see<br />
Figure 9 or Table Q6b).<br />
45%<br />
40%<br />
35%<br />
30%<br />
25%<br />
20%<br />
15%<br />
10%<br />
5%<br />
0%<br />
Figure 9: Quality Rating <strong>of</strong><br />
Counselor-Based Assessment<br />
Services<br />
5.2%<br />
11.4%<br />
16<br />
41.3%<br />
41.6%<br />
Poor Fair Good Excellent
Community-Based Assessment<br />
Nevada <strong>Department</strong> <strong>of</strong> <strong>Employment</strong>, <strong>Training</strong> <strong>and</strong> <strong>Rehabilitation</strong><br />
2011 General Client Satisfaction Survey<br />
Community-based assessment services include things like trial work experiences <strong>and</strong><br />
assessments <strong>of</strong> clients’ behavior on the job. Approximately 31% <strong>of</strong> clients received communitybased<br />
assessment services from the Vocational <strong>Rehabilitation</strong> Program (see Figure 8 or Table<br />
Q7a). Of the 144 clients who received these services, 50% rated them as excellent, 29% as<br />
good, 14% as fair, <strong>and</strong> 8% as poor (see Figure 10 or Table Q7b).<br />
60%<br />
50%<br />
40%<br />
30%<br />
20%<br />
10%<br />
0%<br />
Figure 10: Quality Rating <strong>of</strong><br />
Community-Based Assessment<br />
Services<br />
7.5%<br />
13.5%<br />
17<br />
29.3%<br />
49.7%<br />
Poor Fair Good Excellent
Assistive Technology<br />
Nevada <strong>Department</strong> <strong>of</strong> <strong>Employment</strong>, <strong>Training</strong> <strong>and</strong> <strong>Rehabilitation</strong><br />
2011 General Client Satisfaction Survey<br />
The Vocational <strong>Rehabilitation</strong> Program provides clients with assistive technology services such<br />
as providing or purchasing devices to help with vision, hearing, communication, or changes to<br />
the clients’ homes or workplaces. More than half <strong>of</strong> all clients (59%) received assistive<br />
technology services from the Program (see Figure 8 or Table Q8a). Of the 310 clients who<br />
received these services, 54% rated the quality <strong>of</strong> the assistive technology services they<br />
received as excellent, 29% as good, 12% as fair, <strong>and</strong> 4% as poor (see Figure 11 or Table 8b).<br />
60%<br />
50%<br />
40%<br />
30%<br />
20%<br />
10%<br />
0%<br />
Figure 11: Quality Rating <strong>of</strong> Assistive<br />
Technology Devices Received<br />
4.1%<br />
12.1%<br />
18<br />
29.4%<br />
53.8%<br />
Poor Fair Good Excellent
Nevada <strong>Department</strong> <strong>of</strong> <strong>Employment</strong>, <strong>Training</strong> <strong>and</strong> <strong>Rehabilitation</strong><br />
2011 General Client Satisfaction Survey<br />
A complete list <strong>of</strong> the types <strong>of</strong> assistive technology devices received by clients can be found in<br />
Figure 12. The most prominent assistive technology devices received by clients were vision-<br />
2related devices (35%; see Table Q8ab), <strong>and</strong> mobility-related devices (24%; see Table Q8ac).<br />
Fifteen percent <strong>of</strong> the clients received hearing-related devices (see Table Q8aa), 13% <strong>of</strong> clients<br />
received home or workplace accessibility devices (see Table Q8ad), <strong>and</strong> 6% received<br />
communication devices (Table Q8ae). Approximately 5% <strong>of</strong> the clients reported receiving<br />
assistive technology services or devices that do not fit into one <strong>of</strong> the aforementioned categories<br />
(see Table Q8af).<br />
Figure 12: Type <strong>of</strong> Assistive<br />
Technology<br />
Received by Clients<br />
Vision-related devices<br />
Mobility-related devices<br />
Hearing-related devices<br />
Home or work accessibility<br />
devices<br />
Communication devices<br />
Other devices<br />
19<br />
5.9%<br />
5.1%<br />
15.0%<br />
13.2%<br />
24.1%<br />
35.0%<br />
0% 10% 20% 30% 40%<br />
Percentage <strong>of</strong> clients who received assistive technology device
Transportation<br />
Nevada <strong>Department</strong> <strong>of</strong> <strong>Employment</strong>, <strong>Training</strong> <strong>and</strong> <strong>Rehabilitation</strong><br />
2011 General Client Satisfaction Survey<br />
Transportation services include things like providing private or public transportation, attendant<br />
care fees, <strong>and</strong> paying for relocation expenses. Forty-five percent <strong>of</strong> clients reported receiving<br />
these types <strong>of</strong> services from the Vocational <strong>Rehabilitation</strong> program (see Figure 8 or Table Q9a<br />
on pg. 11). Fifty-six percent <strong>of</strong> clients rated the transportation services as excellent <strong>and</strong> 31%<br />
rated them as good, while only 11% rated them as fair, <strong>and</strong> 3% rated them as poor (see Figure<br />
13 or Table Q9b).<br />
60%<br />
50%<br />
40%<br />
30%<br />
20%<br />
10%<br />
0%<br />
2.5%<br />
Figure 13: Quality Rating <strong>of</strong><br />
Transportation Services<br />
10.6%<br />
20<br />
31.1%<br />
55.7%<br />
Poor Fair Good Excellent
Interpreter<br />
Nevada <strong>Department</strong> <strong>of</strong> <strong>Employment</strong>, <strong>Training</strong> <strong>and</strong> <strong>Rehabilitation</strong><br />
2011 General Client Satisfaction Survey<br />
The Vocational <strong>Rehabilitation</strong> Program also provides eligible clients with interpreter services<br />
(e.g., sign language interpretation, brailing). Only 5% <strong>of</strong> clients received interpreter services<br />
(see Figure 8 or Table Q10a). The vast majority <strong>of</strong> these clients were positive regarding<br />
interpreter services; 87% rated the quality <strong>of</strong> interpreter services as good (31%) or excellent<br />
(56%), in comparison to 14% who rated these services as poor (3%) or fair (11%; see Figure 14<br />
or Table Q10b). The clients that received interpreter services did not provide suggestions to<br />
improve the service.<br />
50%<br />
45%<br />
40%<br />
35%<br />
30%<br />
25%<br />
20%<br />
15%<br />
10%<br />
5%<br />
0%<br />
0.0%<br />
Figure 14: Quality Rating <strong>of</strong><br />
Interpreter Services<br />
18.7%<br />
21<br />
45.1%<br />
36.2%<br />
Poor Fair Good Excellent
On-the-Job <strong>Training</strong><br />
Nevada <strong>Department</strong> <strong>of</strong> <strong>Employment</strong>, <strong>Training</strong> <strong>and</strong> <strong>Rehabilitation</strong><br />
2011 General Client Satisfaction Survey<br />
Approximately 25% <strong>of</strong> clients received on-the-job training services from the Vocational<br />
<strong>Rehabilitation</strong> Program (see Figure 8 or Table Q12a). Of these 114 clients, 49% rated the<br />
quality <strong>of</strong> the on-the-job services as excellent, 28% as good, 13% as fair, <strong>and</strong> 10% rated the<br />
services as poor (see Figure 15 or Table Q12b).<br />
60%<br />
50%<br />
40%<br />
30%<br />
20%<br />
10%<br />
0%<br />
Figure 15: Quality Rating <strong>of</strong> On-the-<br />
Job <strong>Training</strong> Services<br />
10.2%<br />
13.1%<br />
22<br />
28.1%<br />
48.6%<br />
Poor Fair Good Excellent
Post-<strong>Employment</strong><br />
Nevada <strong>Department</strong> <strong>of</strong> <strong>Employment</strong>, <strong>Training</strong> <strong>and</strong> <strong>Rehabilitation</strong><br />
2011 General Client Satisfaction Survey<br />
Post-employment services from the Vocation <strong>Rehabilitation</strong> Program, such as computer<br />
classes, job coaching, additional training, assistive technology services, <strong>and</strong> providing<br />
employers with information, are designed to assist clients keep a job. Twenty-eight percent <strong>of</strong><br />
clients received post-employment services (see Figure 8 or Table Q13a). Of these 140 clients,<br />
35% reported that they were currently employed (see Table Q13a). Fifty-two percent <strong>of</strong> clients<br />
who received post-employment services rated them as excellent, 33% as good, 9% as fair, <strong>and</strong><br />
6% as poor (see Figure 16 or Table Q13b).<br />
60%<br />
50%<br />
40%<br />
30%<br />
20%<br />
10%<br />
0%<br />
Figure 16: Quality Rating <strong>of</strong> Post-<br />
<strong>Employment</strong> Services<br />
6.2%<br />
8.8%<br />
23<br />
33.1%<br />
51.9%<br />
Poor Fair Good Excellent
Currently Employed Clients<br />
Nevada <strong>Department</strong> <strong>of</strong> <strong>Employment</strong>, <strong>Training</strong> <strong>and</strong> <strong>Rehabilitation</strong><br />
2011 General Client Satisfaction Survey<br />
Just under half (49%) <strong>of</strong> all clients reported they were employed at the time <strong>of</strong> data collection<br />
(see Table Q15a). A slight majority <strong>of</strong> female clients (51%) reported being currently employed,<br />
whereas only 46% <strong>of</strong> male clients reported being employed. Of those who were employed, 42%<br />
said that they got their current job as a result <strong>of</strong> the services they received from the Vocational<br />
<strong>Rehabilitation</strong> Program (see Table Q15b). Of the 58% <strong>of</strong> clients (n = 146) who indicated they did<br />
not get their current job as a result <strong>of</strong> Vocational <strong>Rehabilitation</strong> Program services, only 13% (n =<br />
19) reported that they got any job as a result <strong>of</strong> Program services (see Table 15c).<br />
Of these 19 clients who reported that they got any job as a result <strong>of</strong> the services they received<br />
from the Vocational <strong>Rehabilitation</strong> Program, approximately half (53%, n = 10) reported that they<br />
were in a job that the Program helped place them in at the time that their case was closed (see<br />
Table 15d). Further, no clients were currently employed in that job (see Table Q15e). Of the<br />
who were not employed in the job that the Program helped place them in when their case was<br />
closed (see Table Q15e), four (42%) were still employed in the same career field as the job they<br />
were placed in (see Table Q15f). These four clients reported that his or her current job was<br />
better in pay or benefits than the job he or she had when his or her case was closed (see Table<br />
15g).<br />
<strong>Employment</strong> Benefits<br />
Those clients who were employed were also asked about the benefits they received from their<br />
employers (see Figure 17). Fifty-four percent received paid vacations with their current jobs (see<br />
Table Q16b). Just under half <strong>of</strong> all employed clients received paid federal or state holidays<br />
(47%; see Table Q16a) <strong>and</strong> health insurance (48%; see Table Q16c). Similarly, 39% received<br />
retirement plans (see Table Q16e) <strong>and</strong> 38% received paid sick leave (see Table Q16d).<br />
Twenty-four percent <strong>of</strong> clients received clothes or a uniform allowance (see Table Q16h) or<br />
meals (13%; see Table Q16f) as a benefit <strong>of</strong> their current job <strong>and</strong> only 2% received day care<br />
services (see Table Q16g). Approximately 4% <strong>of</strong> employed clients (n = 9) reported that they<br />
received other benefits not mentioned previously (see Table Q16i).<br />
24
Nevada <strong>Department</strong> <strong>of</strong> <strong>Employment</strong>, <strong>Training</strong> <strong>and</strong> <strong>Rehabilitation</strong><br />
2011 General Client Satisfaction Survey<br />
Figure 17: Benefits Received from<br />
Employers<br />
Paid Vacation<br />
Paid Federal or State Holidays<br />
Health Insurance<br />
Retirement Plan<br />
Paid Sick Leave<br />
Clothes/Uniform Allowance<br />
Meals<br />
Other<br />
Daycare<br />
1.6%<br />
Attitudes about Current <strong>Employment</strong><br />
Employed clients were asked several questions about their attitudes toward their current job<br />
(see Figure 18). The majority <strong>of</strong> clients who were employed agreed, either somewhat or<br />
strongly, that they got the kind <strong>of</strong> job that they wanted (69%; see Table Q17a), <strong>and</strong> that they<br />
liked their current jobs (79%; see Table Q17b). An overwhelming majority <strong>of</strong> clients (92%) also<br />
felt that they had the skills necessary to keep their current jobs (see Table Q17c). Fifty-three<br />
percent <strong>of</strong> clients agreed that the program had provided them with the services needed to get<br />
their current job, while 35% disagreed (see Table Q17d). Clients were slightly more positive<br />
about the next question; 62% agreed that the program provided services that helped them keep<br />
their current jobs, while 29% disagreed (see Table Q17e).<br />
25<br />
6.5%<br />
12.8%<br />
23.5%<br />
38.9%<br />
37.6%<br />
46.9%<br />
47.6%<br />
53.9%<br />
0% 10% 20% 30% 40% 50% 60%<br />
Percentage receiving benefit
Nevada <strong>Department</strong> <strong>of</strong> <strong>Employment</strong>, <strong>Training</strong> <strong>and</strong> <strong>Rehabilitation</strong><br />
2011 General Client Satisfaction Survey<br />
Figure 18: Attitudes about Current Job<br />
Got type <strong>of</strong> job wanted<br />
Like current job<br />
Think have skills to keep job<br />
Program provided services<br />
needed to GET job<br />
Program provided services<br />
needed to KEEP job<br />
3.6%<br />
9.8%<br />
Currently Unemployed Clients<br />
Clients who were not employed were given a list <strong>of</strong> reasons for their unemployment status <strong>and</strong><br />
asked to endorse the main reason they were unemployed (see Figure 19 or Tables Q18). The<br />
largest percentage <strong>of</strong> clients (21%) reported that they were unemployed because they were<br />
fired or laid <strong>of</strong>f from their previous job, <strong>and</strong> 18% reported that they were unable to find any job.<br />
Despite not being read as options to this question, nearly 13% <strong>of</strong> clients reported that the main<br />
reason they were unemployed was because <strong>of</strong> their disability <strong>and</strong> another 7% <strong>of</strong> clients stated<br />
that there was another reason not listed for their unemployment. Just over 6% <strong>of</strong> clients stated<br />
that they could not find a job that they were qualified for, were attending school, or that their<br />
employer could not accommodate their disability. A similar percentage <strong>of</strong> clients indicated that<br />
they were unemployed because they were retired (5%), for different medical reasons (5%), or<br />
were unable to find a desired job (4%). Less than 2% <strong>of</strong> clients reported that they were<br />
unemployed due to family commitments, did not want to lose their health insurance, lack <strong>of</strong><br />
transportation, or were volunteering.<br />
26<br />
19.4%<br />
34.8%<br />
28.9%<br />
52.7%<br />
68.7%<br />
61.5%<br />
79.2%<br />
91.5%<br />
0% 20% 40% 60% 80% 100%<br />
Somewhat/Strongly Disagree Somewhat/Strongly Agree
Figure 19: Main Reason Client is not Employed<br />
Fired or laid <strong>of</strong>f from previous job<br />
Couldn't find any job<br />
Disability<br />
Other<br />
Couldn't find a job I was qualified for<br />
Attending school<br />
Employer couldn't accommodate my disability<br />
Retired<br />
Other medical reason (not disability-related)<br />
Couldn't find the kind <strong>of</strong> job I wanted<br />
Couldn't work because <strong>of</strong> family commitments<br />
Didn't want to lose health insurance<br />
Lack <strong>of</strong> Transportation<br />
Volunteering<br />
Changed my mind about value <strong>of</strong> working<br />
Couldn't work because <strong>of</strong> other commitments<br />
0.4%<br />
0.4%<br />
0.0%<br />
1.5%<br />
1.5%<br />
1.3%<br />
27<br />
Nevada <strong>Department</strong> <strong>of</strong> <strong>Employment</strong>, <strong>Training</strong> <strong>and</strong> <strong>Rehabilitation</strong><br />
2011 General Client Satisfaction Survey<br />
4.9%<br />
4.1%<br />
6.3%<br />
6.2%<br />
5.4%<br />
7.1%<br />
6.4%<br />
12.3%<br />
18.3%<br />
20.8%<br />
0% 5% 10% 15% 20% 25%<br />
Percentage reporting as MAIN reason
Client Reactions <strong>and</strong> Suggestions<br />
Nevada <strong>Department</strong> <strong>of</strong> <strong>Employment</strong>, <strong>Training</strong> <strong>and</strong> <strong>Rehabilitation</strong><br />
2011 General Client Satisfaction Survey<br />
Survey respondents were given the opportunity to comment on the strengths <strong>of</strong> the program, as<br />
well as improvements that could be made to strengthen the program in the future. Common<br />
response themes provided by the clients are summarized in Appendix G. Typical improvements<br />
suggested included providing more councilors with disability experience, providing more<br />
structure/direction to clients, disability screening <strong>and</strong> verification, <strong>and</strong> updates/follow-ups with<br />
councilors. Typical strengths cited included the health support, social <strong>and</strong> work-related<br />
resources, courses, <strong>and</strong> assessments.<br />
Service Location<br />
Finally, survey respondents were asked which Vocational <strong>Rehabilitation</strong> location they received<br />
all or a majority <strong>of</strong> their services from (see Figure 20 <strong>and</strong> Table Q21). The largest percentage <strong>of</strong><br />
clients (46%) received Vocational <strong>Rehabilitation</strong> services from one <strong>of</strong> the four Las Vegas<br />
locations or from one <strong>of</strong> the two Reno locations (20%). Approximately 6% received services<br />
from one <strong>of</strong> the two Carson City <strong>of</strong>fices <strong>and</strong> another 6% from the Henderson location. Seven<br />
percent <strong>of</strong> clients received services in Sparks, 4% in Fallon, 3% in Elko, 2% in Ely, <strong>and</strong> 1% in<br />
Winnemucca. Another 3% indicated that they received all or the majority <strong>of</strong> rehabilitation<br />
services from another location not already mentioned in the preceding list (e.g., Pahrump, did<br />
not go into an <strong>of</strong>fice). Further, 3% <strong>of</strong> clients refused to answer this question or stated that they<br />
did not know which <strong>of</strong>fice they received services from.<br />
28
Las Vegas (3016 W. Charleston Blvd -…<br />
Reno (1325 Corporate Boulevard)<br />
Las Vegas (6161 W. Charleston Blvd)<br />
Reno (4001 South Virginia Street)<br />
Sparks (1675 East Prater Way)<br />
Las Vegas (3405 South Maryl<strong>and</strong>…<br />
Carson City (1933 North Carson Street)<br />
Henderson (119 Water Street)<br />
North Las Vegas (2827 Las Vegas…<br />
Fallon (121 Industrial Way)<br />
Don't Know/Refused<br />
Other<br />
Elko (172 6th Street)<br />
Ely (1500 Ave F #1)<br />
Winnemucca (475 West Haskell, #2)<br />
Carson City (1370 South Curry Street)<br />
Figure 20: Service Location<br />
29<br />
Nevada <strong>Department</strong> <strong>of</strong> <strong>Employment</strong>, <strong>Training</strong> <strong>and</strong> <strong>Rehabilitation</strong><br />
2011 General Client Satisfaction Survey<br />
7.5%<br />
7.3%<br />
6.7%<br />
5.9%<br />
5.8%<br />
5.8%<br />
4.3%<br />
3.5%<br />
3.4%<br />
2.5%<br />
2.5%<br />
2.4%<br />
1.2%<br />
0.4%<br />
12.9%<br />
28.0%<br />
0% 10% 20% 30%
Nevada <strong>Department</strong> <strong>of</strong> <strong>Employment</strong>, <strong>Training</strong> <strong>and</strong> <strong>Rehabilitation</strong><br />
2011 General Client Satisfaction Survey<br />
Appendix A:<br />
Post-Weighting<br />
Methodology<br />
30
Nevada <strong>Department</strong> <strong>of</strong> <strong>Employment</strong>, <strong>Training</strong> <strong>and</strong> <strong>Rehabilitation</strong><br />
2011 General Client Satisfaction Survey<br />
Post-Weighting Methodology<br />
Surveys are conducted to obtain a representative sample <strong>of</strong> the population. However, due to the<br />
nature <strong>of</strong> any sampling process, over-sampling some categories <strong>and</strong> under-sampling others is<br />
more likely to occur. In other words, the way a certain characteristic (such as region, sex, age<br />
etc.) <strong>of</strong> the sample is distributed may differ from the way it is distributed in the population which<br />
introduces bias into any estimate you may obtain from the sample data. To correct for these<br />
biases mathematically <strong>and</strong> to restore the population’s region, sex <strong>and</strong> age distribution in the<br />
sample, post-stratification weighting must be conducted. The post-stratification adjustment<br />
forces the sampling weights within each post stratum (region, sex <strong>and</strong> age in the Division<br />
sample) to the known Division population distribution. Post-stratification improves the precision<br />
<strong>of</strong> the sample estimators <strong>and</strong> serves as a correction for non-response <strong>and</strong> under-coverage<br />
error, which consequently induce a relative reduction in bias.<br />
Un-weighted rates from the survey are not influenced by the stratum, sex, <strong>and</strong> age distributions<br />
in the population. In particular, by using un-weighted rates, it is assumed implicitly, that every<br />
single person in the survey represents one <strong>and</strong> only one person in the whole population (which<br />
is not the case!). For example, if people <strong>of</strong> the age 18-24 were underrepresented in the survey,<br />
after adjusting for stratum, sex <strong>and</strong> age, these people <strong>of</strong> the age 18-24 years old will be granted<br />
a higher weight in order to overcome such under representation in the survey to account for<br />
differing distributions <strong>of</strong> stratum, sex <strong>and</strong> age within the entire population. So, to compensate for<br />
over-representation <strong>and</strong>/or under-representation in the sample, weighted rates must be used.<br />
W p<br />
�<br />
p<br />
p<br />
p p<br />
s<br />
The formula for the weights is: s where p is the population proportion, <strong>and</strong> is the<br />
sample proportion. The formula was used on the cell proportion from tables indicating the size<br />
<strong>of</strong> particular subpopulations based on known demographic characteristics (e.g., males aged 18<br />
– 24 living in Southern Nevada). After post-stratification, the weighting assured that the<br />
representation <strong>of</strong> certain subpopulations corresponded to figures from the population as shown<br />
in Table 2 in Appendix E.<br />
31
Nevada <strong>Department</strong> <strong>of</strong> <strong>Employment</strong>, <strong>Training</strong> <strong>and</strong> <strong>Rehabilitation</strong><br />
2011 General Client Satisfaction Survey<br />
Appendix B:<br />
General Client<br />
Satisfaction Survey<br />
32
General Client Satisfaction Survey<br />
Nevada <strong>Department</strong> <strong>of</strong> <strong>Employment</strong>, <strong>Training</strong> <strong>and</strong> <strong>Rehabilitation</strong><br />
2011 General Client Satisfaction Survey<br />
Introduction 1<br />
Hello, my name is [name] from the University <strong>of</strong> Nevada. I am calling on behalf <strong>of</strong> the<br />
Nevada <strong>Department</strong> <strong>of</strong> <strong>Employment</strong>, <strong>Training</strong>, <strong>and</strong> <strong>Rehabilitation</strong> for [respondent]. Each<br />
year we call clients who worked with vocational rehabilitation counselors to receive help<br />
with training or finding a job. We would like to know how you feel about the services<br />
provided to you by your Vocational <strong>Rehabilitation</strong> Program counselor.<br />
This information is confidential <strong>and</strong> [his/her] name will not be given to anyone. [His/Her]<br />
responses will be combined with information from other clients <strong>and</strong> given to the Nevada<br />
<strong>Rehabilitation</strong> Division so they can see how well the Division is doing <strong>and</strong> to determine<br />
how to improve the way they help people find the best job for them. The questions are<br />
brief, <strong>and</strong> should only take about 10 minutes to complete. For [respondent]s’<br />
participation, [he/she] will also be entered into a drawing for a chance to receive 1 <strong>of</strong> 4<br />
prepaid $50.00 VISA gift cards that can be used at any location that accepts VISA.<br />
Introducción 1<br />
Hola, mi nombre es [nombre] y estoy habl<strong>and</strong>o de la Universidad de Nevada de parte<br />
del Departamento de Nevada, para el empleo, entrenamiento y rehabilitación. Cada<br />
año le hablamos a clientes que han trabajado con consejeros de rehabilitación de<br />
formación pr<strong>of</strong>esional para recibir ayuda con entrenamiento o para encontrar un<br />
trabajo. Quisiéramos saber cómo se siente sobre los servicios que fueron<br />
proporcionados por su consejero del programa vocacional.<br />
Esta información es completamente confidencial y la información de [nombre] no será<br />
distribuida a otras personas. Las respuestas de [nombre] serán combinadas con la<br />
información de otros clientes para darle al Departamento de Nevada empleo,<br />
entrenamiento y rehabilitación la información necesaria para determinar cómo están<br />
haciendo su trabajo y como mejorar la manera de ayudar a las personas a encontrar el<br />
mejor trabajo para los clientes. Las preguntas son breves y solamente deberían tomar<br />
como 10 minutos. Cada cliente que participe será puesto en una rifa y tendrá la<br />
oportunidad de recibir 1 de 4 tarjetas de visas pre pagadas de 50.00 dólares que se<br />
podrán usar en cualquier localización que acepte visa.<br />
1)<br />
May I speak to [respondent]?<br />
1 - R is available (informant answered phone, transfer to R) (skip to Introduction<br />
2 - R is speaking (respondent answered phone) (skip to Introduction 4)<br />
3 - R has hearing impairment (skip to Hearing Impairment)<br />
4 - Call back set by Informant<br />
33
Nevada <strong>Department</strong> <strong>of</strong> <strong>Employment</strong>, <strong>Training</strong> <strong>and</strong> <strong>Rehabilitation</strong><br />
2011 General Client Satisfaction Survey<br />
5 - Caregiver or Parent/Guardian will complete survey for respondent (skip to<br />
Introduction 3)<br />
6 - Severe impairment/OR R unable to complete survey by phone OR WEB<br />
7 - Wrong number (IWER: Verify phone number) (skip to Verify Phone)<br />
8 - Language Barrier<br />
9 - Refused<br />
10 - Eligible respondent away for duration<br />
¿Puedo hablar con [Respondent]?<br />
1. R está disponible (Informante contesto el teléfono, se lo pasa al respóndente)<br />
2. R está habl<strong>and</strong>o (respóndente contesta el teléfono)<br />
3. R tiene discapacidad auditiva<br />
4. Informante fija la llamada de regreso<br />
5. Cuidador o Padres/Guardián va completar/terminar la encuesta para el<br />
respóndente<br />
6. Discapacidad grave/o R no puede terminar la encuesta por teléfono o de internet<br />
7. Número equivocado (entrevistador tiene que verificar en número)<br />
8. Impedimento de idioma<br />
9. Rechaza la entrevista<br />
10. R elegible no está disponible durante el estudio<br />
If person is not sure who DETR is, the Vocational <strong>Rehabilitation</strong> Program is, or<br />
whether or not they received services:<br />
If person says they did not receive services, PROBE: We show that you received<br />
services from the <strong>Rehabilitation</strong> Division between 10/1/09-9/30/10 (READ: October 1st,<br />
2009 <strong>and</strong> September 30th, 2010)<br />
Did your counselor write up ANY type <strong>of</strong> plan for services? For example, did they write<br />
up a plan for you to go to work, to go to training, for you to receive bus passes or any<br />
type <strong>of</strong> transportation, for a uniform, for school, for assistive technology, or maybe<br />
something else?<br />
Read if respondent still doesn’t underst<strong>and</strong> above question: By receiving services,<br />
we mean you went to the Vocational <strong>Rehabilitation</strong> program, were determined to be<br />
eligible for services, <strong>and</strong> received one or more <strong>of</strong> the following: an individual<br />
employment plan, counseling, evaluation, advice, or a product.<br />
PROBE: (if person says they have never heard <strong>of</strong> DETR or <strong>Rehabilitation</strong> Division)<br />
The <strong>Rehabilitation</strong> Division provides services for people with disabilities to help enable<br />
them to work <strong>and</strong> live independently. The <strong>Rehabilitation</strong> Division's vision is that <strong>of</strong> a<br />
barrier-free future where every individual in Nevada has equal vocational, employment,<br />
<strong>and</strong> independent living.<br />
34
Nevada <strong>Department</strong> <strong>of</strong> <strong>Employment</strong>, <strong>Training</strong> <strong>and</strong> <strong>Rehabilitation</strong><br />
2011 General Client Satisfaction Survey<br />
Si la persona no está segura/o que es DETR o el programa de rehabilitación vocacional<br />
o si recibieron servicios o no:<br />
Si la persona dice que no recibió servicios, PROBE: Nuestros archivos indican que<br />
usted recibió servicios del programa de la división de rehabilitación dentro el primero de<br />
octubre del año 2009 hasta el treinta de septiembre del 2010.<br />
Su consejero le escribió algún tipo de plan para servicios? Por ejemplo le escribieron<br />
un plan para que usted fuera al trabajo, ir a entrenar, para que usted recibiera un pase<br />
de bus u otro tipo de transportación, para un uniforme, para la escuela, para tecnología<br />
de asistencia u otro producto.<br />
Lea si el respondente todavía no entiende la pregunta ya mencionada: En recibir<br />
los servicios queremos decir que usted fue al programa de rehabilitación vocacional y<br />
fue declarado elegible para nuestros servicios y recibió uno o más de lo siguiente; un<br />
plan individual de empleo, orientación/apoyo psicológico, evaluación, consejo o<br />
producto.<br />
Investigar; (Si la persona dice que nunca han escuchado de DETR o la División<br />
de rehabilitación)<br />
La División de rehabilitación <strong>of</strong>rece servicios para la gente con discapacidades y les<br />
ayudara para que trabajen y que vivan independientemente. La visión de la División de<br />
rehabilitación es poder romper las barreras para que cada persona en Nevada tenga<br />
las mismas oportunidades vocacionales, de empleo, y de vivir independientemente.<br />
Introduction 2<br />
Hello, my name is [name], <strong>and</strong> I'm calling from the University <strong>of</strong> Nevada on behalf <strong>of</strong><br />
the Nevada <strong>Department</strong> <strong>of</strong> <strong>Employment</strong>, <strong>Training</strong>, <strong>and</strong> <strong>Rehabilitation</strong>. Every year, we<br />
contact clients who worked with our vocational rehabilitation counselors <strong>and</strong> received<br />
help with training or finding a job. We would like to know how you feel about the<br />
services provided to you by your Vocational <strong>Rehabilitation</strong> Program counselor. This<br />
information is confidential <strong>and</strong> your name will not be given to anyone. Your responses<br />
will be combined with information from other clients <strong>and</strong> given to the Nevada<br />
<strong>Rehabilitation</strong> Division so they can see how well the Division is doing <strong>and</strong> to determine<br />
how to improve the way they help people find the best job for them. The questions are<br />
brief, <strong>and</strong> should only take about 10 minutes to complete. For your participation, you<br />
will also be entered into a drawing for a chance to receive 1 <strong>of</strong> 4 prepaid $50.00 VISA<br />
gift cards that can be used at any location that accepts VISA. Would you be willing to<br />
participate in this interview now?<br />
Interviewer: If respondent says, "I have the information on the web, <strong>and</strong> I was<br />
35
Nevada <strong>Department</strong> <strong>of</strong> <strong>Employment</strong>, <strong>Training</strong> <strong>and</strong> <strong>Rehabilitation</strong><br />
2011 General Client Satisfaction Survey<br />
just going to do it online." Say, "Well if you have time now, it's actually easier to<br />
do the survey over the phone because I can help you through it. May we do the<br />
interview now?"<br />
If respondent says that they already did it on the web, thank them, <strong>and</strong> code<br />
out as 4.<br />
1 - Yes (skip to Impairment Check)<br />
2 - Set call back<br />
4 - No, I already completed it on the web<br />
7 - Ineligible/Did not receive services from DETR<br />
8 - Severe impairment/OR R unable to complete survey by phone OR WEB<br />
9 – Refused<br />
If person is not sure who DETR is, the Vocational <strong>Rehabilitation</strong> Program is, or<br />
whether or not they received services:<br />
If person says they did not receive services, PROBE: We show that you received<br />
services from the <strong>Rehabilitation</strong> Division between 10/1/09-9/30/10 (READ: October 1st,<br />
2009 <strong>and</strong> September 30th, 2010)<br />
Did your counselor write up ANY type <strong>of</strong> plan for services? For example, did they write<br />
up a plan for you to go to work, to go to training, for you to receive bus passes or any<br />
type <strong>of</strong> transportation, for a uniform, for school, for assistive technology, or maybe<br />
something else?<br />
Read if respondent still doesn’t underst<strong>and</strong> above question: By receiving<br />
services, we mean you went to the Vocational <strong>Rehabilitation</strong> program, were determined<br />
to be eligible for services, <strong>and</strong> received one or more <strong>of</strong> the following: an individual<br />
employment plan, counseling, evaluation, advice, or a product.<br />
PROBE: (if person says they have never heard <strong>of</strong> DETR or <strong>Rehabilitation</strong> Division)<br />
The <strong>Rehabilitation</strong> Division provides services for people with disabilities to help enable<br />
them to work <strong>and</strong> live independently. The <strong>Rehabilitation</strong> Division's vision is that <strong>of</strong> a<br />
barrier-free future where every individual in Nevada has equal vocational, employment,<br />
<strong>and</strong> independent living.<br />
Hola, mi nombre es [nombre] y estoy habl<strong>and</strong>o de la Universidad de Nevada de parte<br />
del Departamento de Nevada, empleo, entrenamiento y rehabilitación. Cada año le<br />
hablamos a clientes que han trabajado con consejeros de esta agencia para recibir<br />
ayuda con entrenamiento o para encontrar un trabajo. Quisiéramos saber cómo se<br />
siente de los servicios que fueron proporcionados por su consejero durante su<br />
36
Nevada <strong>Department</strong> <strong>of</strong> <strong>Employment</strong>, <strong>Training</strong> <strong>and</strong> <strong>Rehabilitation</strong><br />
2011 General Client Satisfaction Survey<br />
programa vocacional.<br />
Esta información es completamente confidencial y la información de [nombre] no será<br />
distribuida a otras personas. Las respuestas de [nombre] serán combinadas con la<br />
información de otros clientes para darle a Departamento de Nevada empleo,<br />
entrenamiento y rehabilitación la información necesaria para determinar cómo mejorar<br />
la manera de ayudar a las personas a encontrar un mejor trabajo para ellos. Las<br />
preguntas son breves y solamente deberían tomar como 10 minutos. Cada cliente que<br />
participe será puesto en una rifa y tendrá la oportunidad de recibir 1 de 4 visas pre<br />
pagadas de 50.00 dólares que se podrán usar en cualquier localización que acepte<br />
visa.<br />
Entrevistador: Si el R dice, “Ya tengo la información y lo voy hacer por la red.” Diga,<br />
“Pues si tiene tiempo en este momento es mas fácil hacer la encuesta por el teléfono<br />
ya que si tiene preguntas durante la encuesta le podre ayudar. Podemos hacer la<br />
encuesta en este momento?”<br />
Si el R le dice que ya lo hizo en la red, dele las gracias y asigne el numero 4.<br />
1. Si<br />
2. Llamada de regreso<br />
4. No, ya lo complete en la red<br />
7. No recibió servicios de DETR/No fue elegible<br />
8. Discapacidad grave/o R no puede terminar la encuesta por teléfono o la red<br />
9. Rechaza la entrevista<br />
Si la persona no está segura/o es quien es DETR o el programa de rehabilitación<br />
vocacional o si recibieron servicios o no:<br />
Si la persona dice que no recibió servicios, PROBE: Nuestros archivos indican que<br />
usted recibió servicios del programa de la división de rehabilitación dentro el primero de<br />
octubre del año 2009 hasta el treinta de septiembre del 2010.<br />
Su consejero le escribió algún tipo de plan para servicios? Por ejemplo le escribieron<br />
un plan para que usted fuera al trabajo, ir a entrenar, para que usted recibiera un pase<br />
de bus u otro tipo de transportación, para un uniforme, para la escuela, para tecnología<br />
de asistencia u otro producto.<br />
Lea si el respondente todavía no entiende la pregunta ya mencionada: En recibir<br />
los servicios queremos decir que usted fue al programa de rehabilitación vocacional y<br />
fue declarado elegible para nuestros servicios y recibió uno o más de lo siguiente; un<br />
plan individual de empleo, orientación/apoyo psicológico, evaluación, consejo o<br />
producto.<br />
Investigar; (si la persona dice que nunca han escuchado de DETR o la División de<br />
rehabilitación)<br />
37
Nevada <strong>Department</strong> <strong>of</strong> <strong>Employment</strong>, <strong>Training</strong> <strong>and</strong> <strong>Rehabilitation</strong><br />
2011 General Client Satisfaction Survey<br />
La División de rehabilitación <strong>of</strong>rece servicios para la gente con discapacidades para<br />
poder ayudarlos con trabajo y vivir independientemente. La visión de la División de<br />
rehabilitación es poder romper las barreras para un futuro en donde cada persona en<br />
Nevada tenga los mismos derechos y oportunidades vocacionales, de empleo, y de<br />
vivir independientemente.<br />
Introduction 3<br />
Every year, we contact clients who worked with our vocational rehabilitation<br />
counselors <strong>and</strong> received help with training or finding a job. Over the course <strong>of</strong> this<br />
interview, please respond as if you were the client receiving services from the<br />
<strong>Department</strong> <strong>of</strong> <strong>Employment</strong>, <strong>Training</strong>, <strong>and</strong> <strong>Rehabilitation</strong>.<br />
We would like to know about how you feel about the services provided to you by<br />
your Vocational <strong>Rehabilitation</strong> Program counselor. This information is confidential <strong>and</strong><br />
your name will not be given to anyone. Your responses will be combined with<br />
information from other clients <strong>and</strong> given to the Nevada <strong>Rehabilitation</strong> Division so they<br />
can see how well the Division is doing <strong>and</strong> to determine how to improve the way they<br />
help people find the best job for them.<br />
Again, please respond to the questions as if you were the client receiving services<br />
from our vocational rehabilitation counselors. For [respondent]s’ participation, [he/she]<br />
will also be entered into a drawing for a chance to receive 1 <strong>of</strong> 4 prepaid $50.00 VISA<br />
gift cards that can be used at any location that accepts VISA.<br />
Interviewer: If respondent says, "I have the information on the web, <strong>and</strong> I was<br />
just going to do it online." Say, "Well if you have time now, it's actually easier to<br />
do the survey over the phone because I can help you through it. May we do the<br />
interview now?"<br />
If respondent says that they already did it on the web, thank them, <strong>and</strong> code<br />
out as 4.<br />
1 - Continue (skip to Impairment Check)<br />
2 - Set call back<br />
4 - No, I already completed it on the web<br />
7 - Ineligible/Did not receive services from DETR<br />
9 – Refused<br />
If person is not sure who DETR is, the Vocational <strong>Rehabilitation</strong> Program is, or<br />
whether or not they received services:<br />
If person says they did not receive services, PROBE: We show that you received<br />
38
Nevada <strong>Department</strong> <strong>of</strong> <strong>Employment</strong>, <strong>Training</strong> <strong>and</strong> <strong>Rehabilitation</strong><br />
2011 General Client Satisfaction Survey<br />
services from the <strong>Rehabilitation</strong> Division between 10/1/09-9/30/10 (READ: October 1st,<br />
2009 <strong>and</strong> September 30th, 2010)<br />
Did your counselor write up ANY type <strong>of</strong> plan for services? For example, did they write<br />
up a plan for you to go to work, to go to training, for you to receive bus passes or any<br />
type <strong>of</strong> transportation, for a uniform, for school, for assistive technology, or maybe<br />
something else?<br />
Read if respondent still doesn’t underst<strong>and</strong> above question: By receiving<br />
services, we mean you went to the Vocational <strong>Rehabilitation</strong> program, were determined<br />
to be eligible for services, <strong>and</strong> received one or more <strong>of</strong> the following: an individual<br />
employment plan, counseling, evaluation, advice, or a product.<br />
PROBE: (if person says they have never heard <strong>of</strong> DETR or <strong>Rehabilitation</strong> Division)<br />
The <strong>Rehabilitation</strong> Division provides services for people with disabilities to help enable<br />
them to work <strong>and</strong> live independently. The <strong>Rehabilitation</strong> Division's vision is that <strong>of</strong> a<br />
barrier-free future where every individual in Nevada has equal vocational, employment,<br />
<strong>and</strong> independent living opportunities.<br />
Cada año contactamos clientes que han visto uno de nuestros consejeros del programa<br />
de rehabilitación vocacional para ayuda con entrenamiento o para encontrar un trabajo.<br />
Durante la entrevista por favor responda como si usted fuera el cliente que recibió los<br />
servicios del Departamento de Nevada, empleo, entrenamiento y rehabilitación.<br />
Quisiéramos saber cómo se siente de los servicios que fueron proporcionados por su<br />
consejero durante su programa vocacional. Esta información es completamente<br />
confidencial y la información de [nombre] no será distribuida a otras personas. Las<br />
respuestas de [nombre] serán combinadas con la información de otros clientes para<br />
darle a Departamento de Nevada empleo, entrenamiento y rehabilitación la información<br />
necesaria para determinar cómo mejorar la manera de ayudar a las personas a<br />
encontrar un mejor trabajo para ellos.<br />
Otra vez por favor responda las preguntas como si usted fuera el cliente que recibió los<br />
servicios de los consejeros del programa vocacional. Por la participación de<br />
[respondente] el/ella tendrá la oportunidad de recibir 1 de 4 visas pre pagadas de 50.00<br />
dólares que se podrán usar en cualquier localización que acepte visa.<br />
Entrevistador: Si el R dice, “Ya tengo la información y lo voy hacer por la red.” Diga,<br />
“Pues si tiene tiempo en este momento es mas fácil hacer la encuesta por el teléfono<br />
ya que si tiene preguntas durante la encuesta le podre ayudar. Podemos hacer la<br />
encuesta en este momento?”<br />
39
Nevada <strong>Department</strong> <strong>of</strong> <strong>Employment</strong>, <strong>Training</strong> <strong>and</strong> <strong>Rehabilitation</strong><br />
2011 General Client Satisfaction Survey<br />
Si el R le dice que ya lo hico en la red, dele las gracias y asigne el numero 4.<br />
1. Continúe<br />
2. Llamada de regreso<br />
4. No, ya lo complete en la internet<br />
7.No recibió servicios de DETR /No fue elegible<br />
9. Rechaza la entrevista<br />
Si la persona no está segura/o es quien es DETR o el programa de rehabilitación<br />
vocacional o si recibieron servicios o no:<br />
Si la persona dice que no recibió servicios, PROBE: Nuestros archivos indican que<br />
usted recibió servicios del programa de la división de rehabilitación dentro el primero de<br />
octubre del año 2009 hasta el treinta de septiembre del 2010.<br />
Su consejero le escribió algún tipo de plan para servicios? Por ejemplo le escribieron<br />
un plan para que usted fuera al trabajo, ir a entrenar, para que usted recibiera un pase<br />
de bus u otro tipo de transportación, para un uniforme, para la escuela, para tecnología<br />
de asistencia u otro producto.<br />
Lea si el respondente todavía no entiende la pregunta ya mencionada: En recibir<br />
los servicios queremos decir que usted fue al programa de rehabilitación vocacional y<br />
fue declarado elegible para nuestros servicios y recibió uno o más de lo siguiente; un<br />
plan individual de empleo, orientación/apoyo psicológico, evaluación, consejo o<br />
producto.<br />
Investigar; (si la persona dice que nunca han escuchado de DETR o la División de<br />
rehabilitación)<br />
La División de rehabilitación <strong>of</strong>rece servicios para la gente con discapacidades para<br />
poder ayudarlos con trabajo y vivir independientemente. La visión de la División de<br />
rehabilitación es poder romper las barreras para un futuro en donde cada persona en<br />
Nevada tenga los mismos derechos y oportunidades vocacionales, de empleo, y de<br />
vivir independientemente.<br />
Introduction 4<br />
Okay, as I mentioned, I'm calling from the University <strong>of</strong> Nevada on behalf <strong>of</strong> the<br />
Nevada <strong>Department</strong> <strong>of</strong> <strong>Employment</strong>, <strong>Training</strong>, <strong>and</strong> <strong>Rehabilitation</strong>. They would like to<br />
know about how you feel about the services provided to you by your Vocational<br />
<strong>Rehabilitation</strong> Program counselor. The questions are brief, <strong>and</strong> should only take about<br />
10 minutes to complete. For your participation, you will also be entered into a drawing<br />
for a chance to receive 1 <strong>of</strong> 4 prepaid $50.00 VISA gift cards that can be used at any<br />
location that accepts VISA. Would you be willing to participate in this interview now?<br />
40
Nevada <strong>Department</strong> <strong>of</strong> <strong>Employment</strong>, <strong>Training</strong> <strong>and</strong> <strong>Rehabilitation</strong><br />
2011 General Client Satisfaction Survey<br />
Interviewer: If respondent says, "I have the information on the web, <strong>and</strong> I was<br />
just going to do it online." Say, "Well if you have time now, it's actually easier to<br />
do the survey over the phone because I can help you through it. May we do the<br />
interview now?"<br />
If respondent says that they already did it on the web, thank them, <strong>and</strong> code<br />
out as 4.<br />
1 - Yes (skip to Impairment Check)<br />
2 - Set call back<br />
4 - No, I already completed it on the web<br />
7 - Ineligible/Did not receive services from DETR<br />
8 - Severe impairment/OR R unable to complete survey by phone OR WEB<br />
9 – Refused<br />
If person is not sure who DETR is, the Vocational <strong>Rehabilitation</strong> Program is, or<br />
whether or not they received services:<br />
If person says they did not receive services, PROBE: We show that you received<br />
services from the <strong>Rehabilitation</strong> Division between 10/1/09-9/30/10 (READ: October 1st,<br />
2009 <strong>and</strong> September 30th, 2010)<br />
Did your counselor write up ANY type <strong>of</strong> plan for services? For example, did they write<br />
up a plan for you to go to work, to go to training, for you to receive bus passes or any<br />
type <strong>of</strong> transportation, for a uniform, for school, for assistive technology, or maybe<br />
something else?<br />
Read if respondent still doesn’t underst<strong>and</strong> above question: By receiving<br />
services, we mean you went to the Vocational <strong>Rehabilitation</strong> program, were determined<br />
to be eligible for services, <strong>and</strong> received one or more <strong>of</strong> the following: an individual<br />
employment plan, counseling, evaluation, advice, or a product.<br />
PROBE: (if person says they have never heard <strong>of</strong> DETR or <strong>Rehabilitation</strong> Division)<br />
The <strong>Rehabilitation</strong> Division provides services for people with disabilities to help enable<br />
them to work <strong>and</strong> live independently. The <strong>Rehabilitation</strong> Division's vision is that <strong>of</strong> a<br />
barrier-free future where every individual in Nevada has equal vocational, employment,<br />
<strong>and</strong> independent living opportunities.<br />
Bueno como ya mencione estoy habl<strong>and</strong>o de la Universidad de Nevada de parte del<br />
Departamento de Nevada, empleo, entrenamiento y rehabilitación. Quisiéramos saber<br />
cómo se siente de los servicios que fueron proporcionados por su consejero durante su<br />
41
Nevada <strong>Department</strong> <strong>of</strong> <strong>Employment</strong>, <strong>Training</strong> <strong>and</strong> <strong>Rehabilitation</strong><br />
2011 General Client Satisfaction Survey<br />
programa vocacional. Las preguntas son breves y solamente deberían tomar como 10<br />
minutos. Cada cliente que participe será puesto en una rifa y tendrá la oportunidad de<br />
recibir 1 de 4 visas pre pagadas de 50.00 dólares que se podrán usar en cualquier<br />
localización que acepte visa. Podrá ayudarnos con la entrevista en este momento?<br />
Entrevistador: Si el R dice, “Ya tengo la información y lo voy hacer por la red.” Diga,<br />
“Pues si tiene tiempo en este momento es mas facil hacer la encuesta por el teléfono<br />
ya que si tiene preguntas durante la encuensta le podre ayudar. Podemos hacer la<br />
encuesta en este momento?”<br />
Si el R le dice que ya lo hico en la red, dele las gracias y asigne el numero 4.<br />
1. Si<br />
2. Llamada de regreso<br />
4. No, ya lo complete en la red<br />
7. No recibió servicios de DETR/No fue elegible<br />
8. Discapacidad grave/o R no puede terminar la encuesta por teléfono o la red<br />
9. Rechaza la entrevista<br />
Si la persona no está segura/o es quien es DETR o el programa de rehabilitación<br />
vocacional o si recibieron servicios o no:<br />
Si la persona dice que no recibió servicios, PROBE: Nuestros archivos indican que<br />
usted recibió servicios del programa de la división de rehabilitación dentro el primero de<br />
octubre del año 2009 hasta el treinta de septiembre del 2010.<br />
Su consejero le escribió algún tipo de plan para servicios? Por ejemplo le escribieron<br />
un plan para que usted fuera al trabajo, ir a entrenar, para que usted recibiera un pase<br />
de bus u otro tipo de transportación, para un uniforme, para la escuela, para tecnología<br />
de asistencia u otro producto.<br />
Lea si el respondente todavía no entiende la pregunta ya mencionada: En recibir<br />
los servicios queremos decir que usted fue al programa de rehabilitación vocacional y<br />
fue declarado elegible para nuestros servicios y recibió uno o más de lo siguiente; un<br />
plan individual de empleo, orientación/apoyo psicológico, evaluación, consejo o<br />
producto.<br />
Investigar; (si la persona dice que nunca han escuchado de DETR o la División de<br />
rehabilitación)<br />
La División de rehabilitación <strong>of</strong>rece servicios para la gente con discapacidades para<br />
poder ayudarlos con trabajo y vivir independientemente. La visión de la División de<br />
rehabilitación es poder romper las barreras para un futuro en donde cada persona en<br />
Nevada tenga los mismos derechos y oportunidades vocacionales, de empleo, y de<br />
vivir independientemente.<br />
42
Nevada <strong>Department</strong> <strong>of</strong> <strong>Employment</strong>, <strong>Training</strong> <strong>and</strong> <strong>Rehabilitation</strong><br />
2011 General Client Satisfaction Survey<br />
Hearing Impairment<br />
Interviewer: Read if informant is saying that respondent has a hearing<br />
impairment.<br />
[He/She] can fill out the survey online at www.crda.unr.edu/client <strong>and</strong> enter case ID<br />
#[case id].<br />
1 - Continue to memo<br />
Discapacidad Auditiva<br />
Entrevistador: Lea si el informante dice que el/la R tiene discapacidad auditiva.<br />
El/ella puede llenar la entrevista en la red el www.crda.unr.edu/client y entrar su<br />
identificación #[case id].<br />
1- Continuar con memo<br />
Web Information<br />
Okay, you can fill out the brief survey online at www.crda.unr.edu/client <strong>and</strong> enter<br />
case ID #[case id].<br />
1 - Impairment, gave web address<br />
2 - Not impaired, gave web address (Will call back if it's not completed online in<br />
one week)<br />
3 - Severe impairment/OR R unable to complete survey by phone OR WEB<br />
Información de red<br />
Bueno puede entrar a la red y llenar la breve encuesta el www.crda.unr.edu/client y<br />
entrar su identificación #[case id].<br />
1. Discapacidad, dirección de web fue <strong>of</strong>recida<br />
2. No tiene discapacidad, dirección de web fue <strong>of</strong>recida<br />
3. Discapacidad grave/o R no puede terminar la encuesta por teléfono o la red<br />
Verify Phone<br />
Let me verify your phone number, is this [primary phone] or [secondary phone]?<br />
1 - Yes<br />
2 - No (skip to Dial Screen)<br />
43
Nevada <strong>Department</strong> <strong>of</strong> <strong>Employment</strong>, <strong>Training</strong> <strong>and</strong> <strong>Rehabilitation</strong><br />
2011 General Client Satisfaction Survey<br />
Verificar número de teléfono<br />
Déjeme verificar su número de teléfono, es el [primer número] o [numero<br />
secundario]?<br />
1. Si<br />
2. No (Saltar ¿????)<br />
Answering Machine<br />
Hello, my name is [name] from the University <strong>of</strong> Nevada. I'm calling on behalf <strong>of</strong> the<br />
Nevada <strong>Department</strong> <strong>of</strong> <strong>Employment</strong>, <strong>Training</strong>, <strong>and</strong> <strong>Rehabilitation</strong>, to gather information<br />
about its services, particularly [respondent]'s experiences with the vocational<br />
rehabilitation counselor. We would like to know how you feel about the services<br />
provided to you by your Vocational <strong>Rehabilitation</strong> Program counselor.<br />
This information is confidential <strong>and</strong> [his/her] name will not be given to anyone. Please<br />
call us back to complete this brief 10 minute survey at 1-800-929-9079 (for local 784-<br />
6412), Monday through Friday 10am to 9pm, Saturday 10am to 5pm or Sunday 10am to<br />
5pm, <strong>and</strong> refer to client #[case id]. Or, you can fill out the brief survey online at<br />
www.crda.unr.edu/client, <strong>and</strong> reference client ID #[case id]. For your participation, you<br />
will also be entered into a drawing for a chance to receive 1 <strong>of</strong> 4 prepaid $50.00 VISA<br />
gift cards that can be used at any location that accepts VISA. Thank you for your time,<br />
<strong>and</strong> we look forward to hearing from you.<br />
1 - Message Left<br />
2 - No Message Left<br />
Hola mi nombre es [nombre] y estoy habl<strong>and</strong>o de la Universidad de Nevada. Estoy<br />
habl<strong>and</strong>o de parte de Nevada, empleo, entrenamiento y rehabilitación, para reunir<br />
información sobre los servicios, particularmente las experiencias de [respondente] con<br />
el consejero de rehabilitación vocacional. Quisiéramos saber cómo se siente de los<br />
servicios que fueron proporcionados por su consejero durante su programa vocacional.<br />
Esta información es completamente confidencial y su nombre no será distribuido a<br />
nadie. Por favor regrese la llamada para terminar esta breve encuesta de 10 minutos al<br />
1-800-929-9079 (local 784-6412), Lunes a Viernes de 10 de la mañana hasta las 9 de<br />
la noche y los sábados y domingos de las 10 a las 5 de la tarde y su número de<br />
referencia es #[case id]. O también puede llenar la breve encuesta por la red en el<br />
www.crda.unr.edu/client, y su referencia de cliente es ID #[case id]. Por su participación<br />
cada cliente que participe será puesto en una rifa y tendrá la oportunidad de recibir 1 de<br />
4 visas pre pagadas de 50.00 dólares que se podrán usar en cualquier localización que<br />
acepte visa.<br />
44
1. Dejo mensaje<br />
2. No dejo mensaje<br />
Nevada <strong>Department</strong> <strong>of</strong> <strong>Employment</strong>, <strong>Training</strong> <strong>and</strong> <strong>Rehabilitation</strong><br />
2011 General Client Satisfaction Survey<br />
Impairment Check<br />
Before we begin, do you have any impairment or condition that makes it difficult for<br />
you to complete this interview over the telephone?<br />
1 - Yes (read probe below) (skip to Offer Web Information)<br />
2 - No (continue with interview) (skip to Inf1)<br />
3 - No impairment but don't want to do it over the phone (read probe below) (skip to<br />
Web Information)<br />
Antes de comenzar tiene usted una discapacidad o condición que le impida terminar la<br />
encuesta por el teléfono?<br />
1. Si (lea la nota abajo) (Salte a <strong>of</strong>rece la información de web)<br />
2. No (continua con la entrevista)<br />
3. No tiene discapacidad, pero se rehúsa hacer la entrevista por el teléfono (lea la<br />
nota abajo) (Salte a la información de web)<br />
Interviewer: Before choosing option 1 or 3, say "Well it's actually easier to do<br />
the survey over the phone because I can help you through it. May we do the<br />
interview now?" If respondent still says they would like to do it over the web,<br />
choose 3, if they want to continue the interview choose 2, not 1.<br />
Entrevistador: Antes se seleccionar las opciones 1 o 3, diga “Pues si tiene tiempo en<br />
este momento es más fácil hacer la encuesta por el teléfono ya que si tiene preguntas<br />
durante la encuesta le podre ayudar. Podemos hacer la encuesta en este momento?”<br />
Si el respóndente todavía dice que prefiere hacer la entrevista por el internet,<br />
seleccione la opción 3, si prefiere continuar con la entrevista seleccione la opción 2, no<br />
1.<br />
Offer Web Information<br />
If you would prefer, you can complete this interview online. Would you like me to give<br />
you the website address <strong>and</strong> a user ID so that you can complete the interview this way?<br />
1 - Yes (skip to Web Information)<br />
2 - No, Continue over the phone (skip to Inf1)<br />
8 - Severe impairment/OR R unable to complete survey by phone OR WEB<br />
45
9 - No, Refused survey<br />
Nevada <strong>Department</strong> <strong>of</strong> <strong>Employment</strong>, <strong>Training</strong> <strong>and</strong> <strong>Rehabilitation</strong><br />
2011 General Client Satisfaction Survey<br />
Si prefiere, puede terminar la entrevista por el internet/red. Quiere que le de<br />
dirección del sitio web y su número de identificación para que pueda terminar la<br />
entrevista?<br />
1 - Si<br />
2 - No, continuar por teléfono<br />
8 - Discapacidad grave/o R no puede terminar la encuesta por teléfono o la red<br />
9 - Rechaza la entrevista<br />
SECTION 1: SATISFACTION WITH VOCATIONAL REHABILITATION PROGRAM<br />
Q1<br />
The first set <strong>of</strong> questions asks about your satisfaction level with the Vocational<br />
<strong>Rehabilitation</strong> Division. For each <strong>of</strong> the following questions, please rate your level <strong>of</strong><br />
satisfaction on a scale <strong>of</strong> one to five where ONE is very dissatisfied, TWO is somewhat<br />
dissatisfied, THREE is neither dissatisfied nor satisfied, FOUR is somewhat satisfied,<br />
<strong>and</strong> FIVE is very satisfied. The first question is...<br />
Overall, how dissatisfied or satisfied are you with the services you received from the<br />
Vocational <strong>Rehabilitation</strong> Division?<br />
RE-READ ONLY IF NECESSARY<br />
1 - very dissatisfied<br />
2 - somewhat dissatisfied<br />
3 - neither dissatisfied nor satisfied<br />
4 - somewhat satisfied or<br />
5 - very satisfied<br />
DO NOT READ<br />
8 - Don't Know<br />
9 - Refused<br />
46
Nevada <strong>Department</strong> <strong>of</strong> <strong>Employment</strong>, <strong>Training</strong> <strong>and</strong> <strong>Rehabilitation</strong><br />
2011 General Client Satisfaction Survey<br />
Q 1<br />
Las primeras preguntas son sobre su nivel de satisfacción con la división de<br />
rehabilitación vocacional. Para cada pregunta, por favor indique su nivel de satisfacción<br />
en una escala del uno al cinco en donde UNO es muy insatisfecho, DOS es algo<br />
insatisfecho, TRES es ni insatisfecho ni satisfecho, CUATRO es algo satisfecho y<br />
CINCO es muy satisfecho. La primera pregunta es...<br />
En general, que tan insatisfecho o satisfecho esta con los servicios que recibió de la<br />
División de rehabilitación vocacional?<br />
VUELVA A LEER SÓLO SI ES NECESARIO<br />
1. Muy insatisfecho<br />
2. Algo insatisfecho<br />
3. Ni insatisfecho ni statisfecho<br />
4. Algo satisfecho<br />
5. Muy satisfecho<br />
NO LEA<br />
8. No sabe / No está seguro/a<br />
9. Se niega a contestar<br />
Q2<br />
Overall, how dissatisfied or satisfied are you with the timeliness <strong>of</strong> the services you<br />
received from the Vocational <strong>Rehabilitation</strong> Division?<br />
RE-READ ONLY IF NECESSARY<br />
1 - very dissatisfied<br />
2 - somewhat dissatisfied<br />
3 - neither dissatisfied nor satisfied<br />
4 - somewhat satisfied or<br />
5 - very satisfied<br />
DO NOT READ<br />
8 - Don't Know<br />
9 - Refused<br />
En general, que tan insatisfecho/a o satisfecho esta con el tiempo, en que recibio los<br />
servicios de la división de rehabilitación vocacional?<br />
VUELVA A LEER SÓLO SI ES NECESARIO<br />
1 - Muy disatishfecho,<br />
47
2 - Algo distatisfecho<br />
3 - Ni disatisfecho ni statisfecho<br />
4 - Algo satisfecho<br />
5 - Muy satisfecho<br />
NO LEA<br />
8 - No sabe / No está seguro/a<br />
9 - Se niega a contestar<br />
Nevada <strong>Department</strong> <strong>of</strong> <strong>Employment</strong>, <strong>Training</strong> <strong>and</strong> <strong>Rehabilitation</strong><br />
2011 General Client Satisfaction Survey<br />
Q3<br />
How dissatisfied or satisfied are you with the amount <strong>of</strong> choice you have between<br />
providers <strong>of</strong> vocational rehabilitation services?<br />
PROBE: Providers are anyone who contributes to the client's program, for example,<br />
counselors, evaluators, job coaches, service coordinators, job developers, <strong>and</strong><br />
assessors.<br />
RE-READ ONLY IF NECESSARY<br />
1 - very dissatisfied<br />
2 - somewhat dissatisfied<br />
3 - neither dissatisfied nor satisfied<br />
4 - somewhat satisfied or<br />
5 - very satisfied<br />
DO NOT READ<br />
8 - Don't Know<br />
9 - Refused<br />
Q3<br />
Que tan insatisfecho o satisfecho está usted con la cantidad en que tenia para<br />
seleccionar entre proveedores de la división de rehabilitación vocacional?<br />
PROBE: Proveedores son cualquier persona que contribuyo al programa del cliente,<br />
por ejemplo, consejeros, evaluadores, entrenador de trabajo, coordinadores de<br />
servicios, promotor de trabajo y asesores.<br />
VUELVA A LEER SÓLO SI ES NECESARIO<br />
1 - Muy insatisfecho,<br />
2 - Algo insatisfecho<br />
48
3 - Ni insatisfecho ni statisfecho<br />
4 - Algo satisfecho<br />
5 - Muy satisfecho<br />
NO LEA<br />
8 - No sabe / No está seguro/a<br />
9 - Se niega a contestar<br />
Nevada <strong>Department</strong> <strong>of</strong> <strong>Employment</strong>, <strong>Training</strong> <strong>and</strong> <strong>Rehabilitation</strong><br />
2011 General Client Satisfaction Survey<br />
Q4<br />
How dissatisfied or satisfied are you with the ability <strong>of</strong> the Vocational <strong>Rehabilitation</strong><br />
Program to help you get or keep a job?<br />
RE-READ ONLY IF NECESSARY<br />
1 - very dissatisfied<br />
2 - somewhat dissatisfied<br />
3 - neither dissatisfied nor satisfied<br />
4 - somewhat satisfied or<br />
5 - very satisfied<br />
DO NOT READ<br />
8 - Don't Know<br />
9 - Refused<br />
Q4<br />
Que tan insatisfecho o satisfecho está usted con la habilidad del programa de<br />
rehabilitación vocacional en ayudarle a encontrar o mantener su trabajo?<br />
VUELVA A LEER SÓLO SI ES NECESARIO<br />
1 - Muy insatisfecho,<br />
2 - Algo insatisfecho<br />
3 - Ni insatisfecho ni satisfecho<br />
4 - Algo satisfecho<br />
5 - Muy satisfecho<br />
NO LEA<br />
8 - No sabe / No está seguro/a<br />
9 - Se niega a contestar<br />
Q5<br />
49
Nevada <strong>Department</strong> <strong>of</strong> <strong>Employment</strong>, <strong>Training</strong> <strong>and</strong> <strong>Rehabilitation</strong><br />
2011 General Client Satisfaction Survey<br />
I'm going to read you some statements about your experiences with the Vocational<br />
<strong>Rehabilitation</strong> Program that you may or may not agree with. For each statement, please<br />
rate your level <strong>of</strong> agreement or disagreement on a scale <strong>of</strong> one to five where ONE is<br />
strongly disagree, TWO is somewhat disagree, THREE is neither disagree nor agree,<br />
FOUR is somewhat agree, <strong>and</strong> FIVE is strongly agree. The first statement is...<br />
RE-READ ONLY IF NECESSARY<br />
1 - Strongly disagree<br />
2 - Somewhat disagree<br />
3 - Neither disagree nor agree<br />
4 - Somewhat agree<br />
5 - Strongly agree<br />
DO NOT READ<br />
8 - Don't Know<br />
9 - Refused<br />
a. My counselor was underst<strong>and</strong>ing <strong>of</strong> my needs.<br />
b. My counselor was easy for me to contact.<br />
c. I was satisfied with the way my counselor treated me.<br />
d. I was satisfied with the way other Vocational <strong>Rehabilitation</strong> staff, besides my<br />
counselor, treated me.<br />
e. I was satisfied with the amount <strong>of</strong> access I had to my counselor.<br />
f. My counselor treated me with respect during the vocational rehabilitation process.<br />
g. I was able to choose the kind <strong>of</strong> help that I received.<br />
h. I was satisfied overall with the services that I received.<br />
i. I would recommend Nevada's Vocational <strong>Rehabilitation</strong><br />
services to others if they needed the services.<br />
Q5<br />
Voy a leerle unas declaraciones sobre sus experiencias con el departamento de<br />
rehabilitación vocacional que a lo mejor este de acuerdo o no. Para cada declaración,<br />
por favor indique si esta de acuerdo o en des acuerdo en un escala del uno al cinco en<br />
donde un UNO esta muy en des acuerdo, DOS algo en des acuerdo, TRES ni en<br />
acuerdo o des acuerdo, CUATRO algo de acuerdo, y CINCO muy de acuerdo. La<br />
primera declaración es…<br />
VUELVA A LEER SÓLO SI ES NECESARIO<br />
1 - Muy en des acuerdo<br />
50
2 - Algo en des acuerdo<br />
3 - Ni en acuerdo o des acuerdo<br />
4 - Algo de acuerdo<br />
5 - Muy de acuerdo<br />
NO LEA<br />
8 - No sabe / No está seguro/a<br />
9 - Se niega a contestar<br />
Nevada <strong>Department</strong> <strong>of</strong> <strong>Employment</strong>, <strong>Training</strong> <strong>and</strong> <strong>Rehabilitation</strong><br />
2011 General Client Satisfaction Survey<br />
a. Mi consejero entendía mis necesidades.<br />
b. Mi consejero era fácil para contactar.<br />
c. Estaba satisfecho con como me trataba mi concejero.<br />
d. Estaba satisfecho con como me trataban los otros empleados de rehabilitación<br />
además de mi consejero.<br />
e. Estaba satisfecho con la cantidad de acceso a mi consejero.<br />
f. Mi consejero me trato con respeto, durante el proceso de rehabilitación vocacional.<br />
g. Pude escoger entre la ayuda que me <strong>of</strong>recieron.<br />
h. En general estuve satisfecho con los servicios que recibí.<br />
i. Recomendaría los servicios de rehabilitación vocacional de Nevada a otras personas<br />
si necesitan los servicios.<br />
SECTION 2: TYPES OF SERVICES VOCATIONAL REHABILITATION PROVIDES<br />
Inf2<br />
The next section asks about the various types <strong>of</strong> services that Vocational<br />
<strong>Rehabilitation</strong> Services provides.<br />
La próxima sección preguntara sobre los diferentes servicios que <strong>of</strong>rece el<br />
departamento de rehabilitación vocacional.<br />
Q6a<br />
COUNSELOR-BASED ASSESSMENT services include things like job interest <strong>and</strong><br />
aptitude tests, medical tests, like checkups <strong>and</strong> x-rays, <strong>and</strong> other evaluations <strong>of</strong> your<br />
abilities. Have you ever received any counselor-based assessment services from the<br />
vocational rehabilitation program?<br />
1 - Yes<br />
51
2 - No (skip to Q7a)<br />
DO NOT READ<br />
8 - Don't Know (skip to Q7a)<br />
9 - Refused (skip to Q7a)<br />
Nevada <strong>Department</strong> <strong>of</strong> <strong>Employment</strong>, <strong>Training</strong> <strong>and</strong> <strong>Rehabilitation</strong><br />
2011 General Client Satisfaction Survey<br />
Servicios de EVALUACIONES QUE HACEN LOS CONSEJEROS incluyen cosas como<br />
exámenes de sus interés de trabajo y prueba de aptitudes, exámenes médicos, como<br />
chequeos generales, rayos x, y otras evaluaciones de sus habilitadas. Ha recibido<br />
algunos servicios de evaluación de su consejero del programa de rehabilitación<br />
vocacional?<br />
Q6b<br />
How would you rate the quality <strong>of</strong> those counselor-based assessment services?<br />
Would you say they were poor, fair, good, or excellent?<br />
RE-READ ONLY IF NECESSARY<br />
1 - Poor<br />
2 - Fair<br />
3 - Good<br />
4 - Excellent<br />
DO NOT READ<br />
8 - Don't Know<br />
9 – Refused<br />
¿Como evaluaría la calidad de los servicios de evaluaciones que hacen los consejeros?<br />
¿Diría usted que fueron inferiores, aceptables, buenos o excelentes?<br />
VUELVA A LEER SÓLO SI ES NECESARIO<br />
1. Inferiores<br />
2. Aceptables<br />
3. Buenos<br />
4. Excelentes<br />
NO LEA<br />
8 - No sabe / No está seguro/a<br />
9 - Se niega a contestar<br />
52
Nevada <strong>Department</strong> <strong>of</strong> <strong>Employment</strong>, <strong>Training</strong> <strong>and</strong> <strong>Rehabilitation</strong><br />
2011 General Client Satisfaction Survey<br />
Q7a<br />
COMMUNITY-BASED ASSESSMENT services include things like trial work<br />
experiences, <strong>and</strong> assessments <strong>of</strong> your behavior on the job. Trial work experiences are<br />
different from on-the-job-training <strong>and</strong> include situations where you are paid by the<br />
Vocational <strong>Rehabilitation</strong> program while doing work for another employer. Have you<br />
ever received any community-based assessment services from the vocational<br />
rehabilitation program?<br />
1 - Yes<br />
2 - No (skip to Q8a)<br />
DO NOT READ<br />
8 - Don't Know (skip to Q8a)<br />
9 - Refused (skip to Q8a)<br />
EVALUACIÓN BASADAS EN LA COMUNIDAD son servicios que incluyen cosas como,<br />
un periodo temporario de trabajo y una evaluación de su conducta en ese trabajo. Las<br />
experiencias de un periodo corto de trabajo son diferentes que entrenamiento en el<br />
trabajo y incluye situaciones en donde se le pago a usted departe del departamento de<br />
Rehabilitación vocacional mientras trabajaba para otro trabajo/empresa. Ha recibido<br />
servicios de evaluación basada en la comunidad del programa de rehabilitación<br />
vocacional?<br />
1- No<br />
2- Si<br />
No lea:<br />
8 - No sabe / No está seguro/a<br />
9 - Se niega a contestar<br />
Q7b<br />
How would you rate the quality <strong>of</strong> those community-based assessment services?<br />
Would you say they were poor, fair, good, or excellent?<br />
RE-READ ONLY IF NECESSARY<br />
1 - Poor<br />
2 - Fair<br />
3 - Good or<br />
4 - Excellent<br />
53
DO NOT READ<br />
8 - Don't Know<br />
9 - Refused<br />
Nevada <strong>Department</strong> <strong>of</strong> <strong>Employment</strong>, <strong>Training</strong> <strong>and</strong> <strong>Rehabilitation</strong><br />
2011 General Client Satisfaction Survey<br />
¿Como describiera la calidad de los servicios de evaluación basada en la comunidad?<br />
¿Diría usted que eran inferiores, aceptables, buenos o excelentes?<br />
VUELVA A LEER SÓLO SI ES NECESARIO<br />
1. Inferiores<br />
2. Aceptables<br />
3. Buenos<br />
4. Excelentes<br />
NO LEA<br />
8 - No sabe / No está seguro/a<br />
9 - Se niega a contestar<br />
Q8a<br />
ASSISTIVE TECHNOLOGY services include things like providing or purchasing<br />
devices to help with vision, hearing, communication, or changes to your home or<br />
workplace.<br />
I'm going to read you a list <strong>of</strong> various TYPES <strong>of</strong> assistive technology devices you<br />
may have received. Please indicate with a simple "yes" or "no" whether or not you have<br />
received the following DEVICES:<br />
1 - Yes<br />
2 - No<br />
DO NOT READ<br />
8 - Don't Know<br />
9 – Refused<br />
La TECNOLOGÍA DE ASISTENCIA incluye servicios como proporcion<strong>and</strong>o o comprar<br />
aparatos que a lo mejor recibió para ayudar con la visión, audiencia, comunicación, o<br />
cambios a su hogar o lugar de trabajo.<br />
Le voy a leer un lista de varios TIPOS de la tecnología de asistencia que a lo mejor<br />
54
Nevada <strong>Department</strong> <strong>of</strong> <strong>Employment</strong>, <strong>Training</strong> <strong>and</strong> <strong>Rehabilitation</strong><br />
2011 General Client Satisfaction Survey<br />
recibió. Por favor índique con un simple “si” o “no” si recibió o no los siguientes<br />
APARATOS:<br />
1- Si<br />
2- No<br />
No lea:<br />
8 - No sabe / No está seguro/a<br />
9 - Se niega a contestar<br />
a. Devices to help with your hearing, for example, hearing aids, alert signal systems,<br />
telephone amplifiers or decoders.<br />
b. Devices to help with your vision, for example, glasses, specialized magnifiers,<br />
screen readers, talking equipment, or Braille equipment.<br />
c. Devices to help with getting around, for example, transportation, canes or<br />
wheelchairs, orthotics or prosthetics.<br />
d. Devices to help make your home or workplace more accessible, for example,<br />
specialized <strong>of</strong>fice equipment, foot stools, or book or copy holders.<br />
e. Devices to help with your communication, for example, h<strong>and</strong>-held digital recorders<br />
or an AAC box or iPhone.<br />
f. Devices to help with something else that was not already mentioned above<br />
a. Aparatos que le ayuden con su audiencia, por ejemplo audífonos, sistemas de<br />
alerta de la señal, amplificadores telefónicos o decodificadores<br />
b. Aparatos que le ayuden con su visión por ejemplo, gafas/lentes, lupas<br />
especializados, lectores de pantalla, habl<strong>and</strong>o equipo (tecnología que habla por la<br />
persona cu<strong>and</strong>o se oprime un botón), o equipo de braille<br />
c. Aparatos para ayudarle moverse, por ejemplo, transportación, baston o cilla de<br />
ruedas, aparatos ortopédico o prótesis<br />
d. Aparatos para hacer su hogar o lugar de trabajo mas accesible, por ejemplo,<br />
equipo de <strong>of</strong>icina especializada, reposapiés o taburete para los pies, o libros o<br />
estantería de guardar.<br />
e. Aparatos para ayudar con su comunicación, por ejemplo, grabadoras digitales de<br />
mano o sistema para grabar su voz para la computadora o un teléfono iPhone.<br />
f. Aparatos para ayudarlo con algo más que no se ha mencionado ya.<br />
INTERVIEWER NOTE: FOR OTHER, ASK "And what was the assistive technology<br />
DEVICE you received?"<br />
SPECIFY: [__________________________________________________](50<br />
characters)<br />
55
Nevada <strong>Department</strong> <strong>of</strong> <strong>Employment</strong>, <strong>Training</strong> <strong>and</strong> <strong>Rehabilitation</strong><br />
2011 General Client Satisfaction Survey<br />
NOTA PARA ENTREVISTADOR: PARA LA OPCIÓN OTRO, PREGUNTE “¿Y cuál<br />
fue el APARATO de tecnología de asistencia que recibió?”<br />
Especifique: [___________________________________________] (50<br />
characters)<br />
PROBE: IF PERSON SAYS THEY RECEIVED COMPUTER SOFTWARE OR<br />
HARDWARE, PLEASE ASK:<br />
“For which <strong>of</strong> the following categories did you receive the computer s<strong>of</strong>tware or<br />
hardware: hearing, vision, getting around, changes to your home or workplace,<br />
communication, or something else?”<br />
IF IT FALLS UNDER ONE OF THE ABOVE CATEGORIES: a) hearing; b) vision; c)<br />
getting around d) home or workplace e) communication, DO NOT CODE AS “OTHER”<br />
PROBE: SI LA PERSONA INDICA QUE RECIBIÓ PROGRAMAS INFORMÁTICOS O<br />
EQUIPO DE COMPUTACIÓN, POR FAVOR PREGUNTE: "Para cual de las<br />
siguientes categorías recibió programas informáticos o hardware: equipo para<br />
escuchar, la visión, para moverse, cambios a su casa o lugar de trabajo,<br />
comunicación o algo más?"<br />
SI LA RESPUESTA CAÍ EN UNA DE LA CATEGORÍAS: a) equipo para escuchar; b)<br />
visión; c) para moverse; d) casa o lugar de trabajo; e) comunicación. NO LO<br />
ASIGNE COMO "OTRO"<br />
Q8b<br />
Overall, how would you rate the quality <strong>of</strong> those assistive technology DEVICES you<br />
received? Would you say they were poor, fair, good, or excellent?<br />
IF PERSON SAYS SOMETHING ABOUT THE SERVICE OR THE PROVIDER, BUT<br />
NOT THE DEVICE, PROBE:<br />
“For this question, we are asking you to rate the device itself, not the person who<br />
provided the device to you or explained how to use the device.”<br />
RE-READ ONLY IF NECESSARY<br />
1 - Poor<br />
2 - Fair<br />
3 - Good or<br />
4 - Excellent<br />
56
DO NOT READ<br />
8 - Don't Know<br />
9 – Refused<br />
Nevada <strong>Department</strong> <strong>of</strong> <strong>Employment</strong>, <strong>Training</strong> <strong>and</strong> <strong>Rehabilitation</strong><br />
2011 General Client Satisfaction Survey<br />
En general como describiría la calidad de los aparatos de tecnología que recibió? Diría<br />
que fueron inferiores, aceptables, buenos o excelentes?<br />
SI LA PERSONA DICE, ALGO SOBRE EL SERVICIO O EL PROVEEDOR, PERO NO<br />
EL APARATO, PROBE: "Para esta pregunta, le estamos pidiendo que evalué el<br />
aparato, y no la persona que le dio el aparato o la persona que le explico cómo usar el<br />
aparato."<br />
1. Inferiores<br />
2. Aceptables<br />
3. Buenos<br />
4. Excelentes<br />
No lea:<br />
8 - No sabe / No está seguro/a<br />
9 - Se niega a contestar<br />
Q9a<br />
TRANSPORTATION services include things like providing private or public<br />
transportation, attendant care fees, or paying for relocation expenses. Have you ever<br />
received any transportation services from the vocational rehabilitation program?<br />
1 - Yes<br />
2 - No (skip to Q10a)<br />
DO NOT READ<br />
8 - Don't Know (skip to Q10a)<br />
9 - Refused (skip to Q10a)<br />
Servicios de TRANSPORTACIÓN incluyen cosas como, proveer transportación privada<br />
o publica, los honorarios para los cuidados de un asistente o pagar los gastos de<br />
reubicación. Ha recibido cualquier tipo de servicios de trasportación del programa de<br />
rehabilitación vocacional?<br />
57
1- Si<br />
2- No<br />
No lea:<br />
No sabe / No está seguro/a<br />
Se niega a contestar<br />
Nevada <strong>Department</strong> <strong>of</strong> <strong>Employment</strong>, <strong>Training</strong> <strong>and</strong> <strong>Rehabilitation</strong><br />
2011 General Client Satisfaction Survey<br />
Q9b<br />
How would you rate the quality <strong>of</strong> those transportation services? Would you say<br />
they were poor, fair, good, or excellent?<br />
RE-READ ONLY IF NECESSARY<br />
1 - Poor<br />
2 - Fair<br />
3 - Good or<br />
4 - Excellent<br />
DO NOT READ<br />
8 - Don't Know<br />
9 - Refused<br />
En general cómo describiría la calidad de los servicios de trasportación? Diría que<br />
fueron inferiores, aceptables, buenos o excelentes?<br />
VUELVA A LEER SÓLO SI ES NECESARIO<br />
1. inferiores<br />
2. Aceptables<br />
3. Buenos<br />
4. Excelentes<br />
No lea:<br />
8 - No sabe / No está seguro/a<br />
9 - Se niega a contestar<br />
Q10a<br />
Interpreter services include things like providing sign language interpretation <strong>and</strong><br />
brailling. Have you ever received any interpreter services from the vocational<br />
rehabilitation program?<br />
58
1 - Yes<br />
2 - No (skip to Q12a)<br />
DO NOT READ<br />
8 - Don't Know (skip to Q12a)<br />
9 - Refused (skip to Q12a)<br />
Nevada <strong>Department</strong> <strong>of</strong> <strong>Employment</strong>, <strong>Training</strong> <strong>and</strong> <strong>Rehabilitation</strong><br />
2011 General Client Satisfaction Survey<br />
Servicios de Intérprete incluye cosas como proporcion<strong>and</strong>o un intérprete y de lengua o<br />
señas y traducción a braille. Ha recibido cualquier tipo de servicios de intérprete del<br />
programa de rehabilitación vocacional?<br />
1- Si<br />
2- No<br />
No lea:<br />
No sabe / No está seguro/a<br />
Se niega a contestar<br />
Q10b<br />
How would you rate the quality <strong>of</strong> those interpreter services? Would you say they<br />
were poor, fair, good, or excellent?<br />
RE-READ ONLY IF NECESSARY<br />
1 - Poor<br />
2 - Fair<br />
3 - Good or<br />
4 - Excellent<br />
DO NOT READ<br />
8 - Don't Know<br />
9 – Refused<br />
Como describiría la calidad de los servicios de intérprete? Diría que fueron inferiores,<br />
aceptables, buenos o excelentes?<br />
1. inferiores<br />
2. Aceptables<br />
59
3. Buenos<br />
4. Excelentes<br />
No lea:<br />
8 - No sabe / No está seguro/a<br />
9 - Se niega a contestar<br />
Nevada <strong>Department</strong> <strong>of</strong> <strong>Employment</strong>, <strong>Training</strong> <strong>and</strong> <strong>Rehabilitation</strong><br />
2011 General Client Satisfaction Survey<br />
Q12a<br />
ON-THE-JOB TRAINING is different from community-based assessment <strong>and</strong><br />
includes situations where you worked as a paid employee.<br />
Have you ever received any ON-THE-JOB TRAINING services from the vocational<br />
rehabilitation program?<br />
1 - Yes<br />
2 - No (skip to Q13a)<br />
DO NOT READ<br />
8 - Don't Know (skip to Q13a)<br />
9 - Refused (skip to Q13a)<br />
ENTRENAMIENTO EN EL TRABAJO es diferente que una evaluaciónen la comunidad<br />
de trabajo y incluye situaciones en donde trabajo como un empleado pagado.<br />
Ha recibido cualquier tipo servicios de ENTRENAMIENTO DURANTE EL TRABAJO del<br />
programa de rehabilitación vocacional?<br />
1- Si<br />
2- No<br />
No lea:<br />
No sabe / No está seguro/a<br />
Se niega a contestar<br />
Q12b<br />
How would you rate the quality <strong>of</strong> those on-the-job training services? Would you say<br />
they were poor, fair, good, or excellent?<br />
RE-READ ONLY IF NECESSARY<br />
60
1 - Poor<br />
2 - Fair<br />
3 - Good or<br />
4 - Excellent<br />
DO NOT READ<br />
8 - Don't Know<br />
9 – Refused<br />
Nevada <strong>Department</strong> <strong>of</strong> <strong>Employment</strong>, <strong>Training</strong> <strong>and</strong> <strong>Rehabilitation</strong><br />
2011 General Client Satisfaction Survey<br />
Como describiría la calidad de esos servicios de entrenamiento en el trabajo? Diría que<br />
fueron inferiores, aceptables, buenos o excelentes?<br />
1. Inferiores<br />
2. Aceptables<br />
3. Buenos<br />
4. Excelentes<br />
No lea:<br />
No sabe / No está seguro/a<br />
Se niega a contestar<br />
Q13a<br />
POST-EMPLOYMENT services include things like providing help to you that would<br />
help you to keep a job.<br />
Post-employment services include, but are not limited to computer classes, job<br />
coaching, additional training, assistive technology devices, <strong>and</strong> providing additional<br />
information to employers.<br />
Have you ever received any post-employment services from the vocational rehabilitation<br />
program?<br />
1 - Yes<br />
2 - No (skip to Inf3)<br />
DO NOT READ<br />
8 - Don't Know (skip to Inf3)<br />
9 - Refused (skip to Inf3)<br />
Servicios de post empleo incluyen cosas como ayudándolo en mantener un trabajo.<br />
Servicios de post empleo pueden incluir clases de computación, entrenador de trabajo<br />
61
Nevada <strong>Department</strong> <strong>of</strong> <strong>Employment</strong>, <strong>Training</strong> <strong>and</strong> <strong>Rehabilitation</strong><br />
2011 General Client Satisfaction Survey<br />
particular, entrenamiento adicional, aparatos de tecnología, y darle información<br />
adicional a las empresas.<br />
¿Alguna vez ha recibido servicios de post empleo del programa de rehabilitación<br />
vocacional?<br />
1- Si<br />
2- No<br />
No lea:<br />
No sabe / No está seguro/a<br />
Se niega a contestar<br />
Q13b<br />
How would you rate the quality <strong>of</strong> those post-employment services? Would you say<br />
they were poor, fair, good, or excellent?<br />
RE-READ ONLY IF NECESSARY<br />
1 - Poor<br />
2 - Fair<br />
3 - Good or<br />
4 - Excellent<br />
DO NOT READ<br />
8 - Don't Know<br />
9 – Refused<br />
Como describiera la calidad de los servicios de post empleo? Diría que fueron<br />
inferiores, aceptables, buenos o excelentes?<br />
1. Inferiores<br />
2. Aceptables<br />
3. Buenos<br />
4. Excelentes<br />
No lea:<br />
No sabe / No está seguro/a<br />
Se niega a contestar<br />
SECTION 3: CURRENT EMPLOYMENT<br />
62
Nevada <strong>Department</strong> <strong>of</strong> <strong>Employment</strong>, <strong>Training</strong> <strong>and</strong> <strong>Rehabilitation</strong><br />
2011 General Client Satisfaction Survey<br />
Inf3<br />
The next section asks about your current employment.<br />
La próxima sección pregunta sobre su trabajo actual.<br />
Q15a<br />
Are you currently employed?<br />
1 - Yes<br />
2 - No (skip to Q18)<br />
DO NOT READ<br />
8 - Don't Know (skip to Q19)<br />
9 - Refused (skip to Q19)<br />
Actualmente esta trabaj<strong>and</strong>o?<br />
1- Si<br />
2- No<br />
No lea:<br />
No sabe / No está seguro/a<br />
Se niega a contestar<br />
Q15b<br />
Did you get your current job as a result <strong>of</strong> the services you received from the<br />
Vocational <strong>Rehabilitation</strong> Program?<br />
1 - Yes (skip to Inf4)<br />
2 - No (skip to Q15c)<br />
DO NOT READ<br />
8 - Don't Know (skip to Q15c)<br />
9 - Refused (skip to Q15c)<br />
Consiguió su trabajo actual debido a los servicios que recibió del programa de<br />
rehabilitación vocacional?<br />
1- Si<br />
63
2- No<br />
No lea:<br />
No sabe / No está seguro/a<br />
Se niega a contestar<br />
Nevada <strong>Department</strong> <strong>of</strong> <strong>Employment</strong>, <strong>Training</strong> <strong>and</strong> <strong>Rehabilitation</strong><br />
2011 General Client Satisfaction Survey<br />
Q15c<br />
Did you get ANY job as a result <strong>of</strong> the services you received from the Vocational<br />
<strong>Rehabilitation</strong> Program?<br />
1 – Yes (skip to 15d)<br />
2 – No (skip to Inf4)<br />
DO NOT READ<br />
8 - Don't Know (skip to Inf4)<br />
9 – Refused (skip to Inf4)<br />
Recibió algún trabajo debido a los servicios que recibió del programa de rehabilitación<br />
vocacional?<br />
1- Si<br />
2- No<br />
No lea:<br />
No sabe / No está seguro/a<br />
Se niega a contestar<br />
Q15d<br />
When your case was closed, were you in a job that the Vocational <strong>Rehabilitation</strong><br />
Program helped place you in?<br />
1 – Yes (skip to 15e)<br />
2 - No (skip to Inf4)<br />
DO NOT READ<br />
8 - Don't Know (skip to Inf4)<br />
9 - Refused (skip to Inf4)<br />
Cu<strong>and</strong>o su caso fue cerrado, usted estaba en un trabajo en la cual el programa de<br />
rehabilitación vocacional le ayudo obtener?<br />
64
Q15e<br />
Are you currently employed in that same job?<br />
1 - Yes (skip to Inf4)<br />
2 - No (skip to 15f)<br />
DO NOT READ<br />
8 - Don't Know (skip to Inf4)<br />
9 - Refused (skip to Inf4<br />
Actualmente esta en el mismo trabajo?<br />
1- Si<br />
2- No<br />
No lea:<br />
No sabe / No está seguro/a<br />
Se niega a contestar<br />
Nevada <strong>Department</strong> <strong>of</strong> <strong>Employment</strong>, <strong>Training</strong> <strong>and</strong> <strong>Rehabilitation</strong><br />
2011 General Client Satisfaction Survey<br />
Q15f<br />
Are you currently employed in the same career field as the job you were in when<br />
your case was closed?<br />
1 - Yes<br />
2 - No (skip to Inf4)<br />
DO NOT READ<br />
8 - Don't Know (skip to Inf4)<br />
9 - Refused (skip to Inf4)<br />
Actualmente esta empleado/a en la misma area o carrera de trabajo en cual su<br />
trabajo anterior cu<strong>and</strong>o su caso fue cerrado?<br />
Q15g<br />
Compared to the job you had when your case was closed, does your current job<br />
provide you with either equal or better pay, OR equal or better benefits?<br />
PROBE IF THEY ANSWER “EQUAL OR BETTER PAY,” OR “EQUAL or BETTER<br />
BENEFITS” SAY: We are looking for a “yes” or “no” answer.<br />
65
1 - Yes (skip to Inf4)<br />
2 - No (skip to Inf4)<br />
DO NOT READ<br />
8 - Don't Know (skip to Inf4)<br />
9 - Refused (skip to Inf4)<br />
Nevada <strong>Department</strong> <strong>of</strong> <strong>Employment</strong>, <strong>Training</strong> <strong>and</strong> <strong>Rehabilitation</strong><br />
2011 General Client Satisfaction Survey<br />
Comparado con su trabajo anterior cu<strong>and</strong>o su caso fue cerrado, su trabajo actual le da<br />
lo mismo o mejores salarios o lo mismos o mejor beneficios?<br />
PROBE SI CONTESTAN "LOS MISMOS o MEJORES SALARIOS," O "LOS MISMOS<br />
O MEJORES BENEFICIOS" DIGA: Estamos busc<strong>and</strong>o a un "sí" o "no" como respuesta.<br />
1- Si<br />
2- No<br />
No lea:<br />
No sabe / No está seguro/a<br />
Se niega a contestar<br />
SECTION 4: CURRENT EMPLOYMENT BENEFITS<br />
Inf4<br />
The next section asks about your current employment benefits.<br />
For the next set <strong>of</strong> questions, please answer with a simple "yes" or "no."<br />
Para la próxima sección le preguntara sobre su actual beneficios de empleo.<br />
Para las próximas preguntas, por favor conteste con un “si” o “no”.<br />
Q16<br />
Which, if any, <strong>of</strong> the following benefits do you receive as part <strong>of</strong> your current<br />
employment? Please respond with a "yes" or "no."<br />
1 - Yes<br />
2 - No<br />
DO NOT READ<br />
8 - Don't Know-<br />
9 - Refused<br />
66
a. Paid federal or state holidays<br />
b. Paid vacations<br />
c. Health insurance<br />
d. Paid sick leave<br />
e. Retirement plan<br />
f. Meals<br />
g. Daycare<br />
h. Clothes/Uniform allowance<br />
i. Other (specify)<br />
Nevada <strong>Department</strong> <strong>of</strong> <strong>Employment</strong>, <strong>Training</strong> <strong>and</strong> <strong>Rehabilitation</strong><br />
2011 General Client Satisfaction Survey<br />
INTERVIEWER NOTE: FOR OTHER, ASK "Are there any other benefits that you<br />
receive from your current job that I didn't mention?"<br />
SPECIFY: [__________________________________________________](50<br />
characters)<br />
Cuales en su caso de los siguientes beneficios recibe de su trabajo actual? Por favor<br />
responda con un “si” o “no”.<br />
1- Si<br />
2- No<br />
No lea:<br />
No sabe / No está seguro/a<br />
Se niega a contestar<br />
a. Día festivos del estado o federales pagados<br />
b. Vacaciones pagadas<br />
c. Seguro de salud<br />
d. Permisos remunerados por enfermedad<br />
e. Plan de retiro<br />
f. Comida<br />
g. Guardería infantil que se ocupa de los niños mientras sus padres trabajan<br />
h. Ropa/ Subsidio de uniforme<br />
i. Otro (especificar)<br />
Nota para Entrevistador: Para la opción Otro, pregunte “Hay otros beneficios que<br />
recibe de su trabajo actual que no mencione?”<br />
Especifique: [___________________________________________]<br />
Q17<br />
I'm going to read you some statements about your job that you may or may not<br />
67
Nevada <strong>Department</strong> <strong>of</strong> <strong>Employment</strong>, <strong>Training</strong> <strong>and</strong> <strong>Rehabilitation</strong><br />
2011 General Client Satisfaction Survey<br />
agree with. For each statement, please rate your level <strong>of</strong> agreement or disagreement on<br />
a scale <strong>of</strong> one to five where ONE is strongly disagree, TWO is somewhat disagree,<br />
THREE is neither disagree nor agree, FOUR is somewhat agree, <strong>and</strong> FIVE is strongly<br />
agree. The first statement is...<br />
RE-READ ONLY IF NECESSARY<br />
1 - Strongly disagree<br />
2 - Somewhat disagree<br />
3 - Neither disagree nor agree<br />
4 - Somewhat agree<br />
5 - Strongly agree<br />
DO NOT READ<br />
8 - Don't Know<br />
9 - Refused<br />
a. I got the kind <strong>of</strong> job I wanted.<br />
b. I like the job that I have now.<br />
c. I feel that I have the skills necessary to keep the job that I have now.<br />
d. The Vocational <strong>Rehabilitation</strong> Program provided me with the services I needed to<br />
GET the job that I have now.<br />
e. The Vocational <strong>Rehabilitation</strong> Program provided me with the services that I need<br />
to KEEP the job that I have<br />
now.<br />
(skip to Q19)<br />
Voy a leerle unas declaraciones sobre su trabajo que puede o no puede estar de<br />
acuerdo. Para cada declaración indique su nivel de estar de acuerdo o desacuerdo en<br />
una escala de uno a cinco en donde UNO es muy en des acuerdo, DOS es algo en des<br />
acuerdo, TRES es ni en acuerdo o des acuerdo, CUATRO algo de acuerdo o CINCO<br />
muy de acuerdo?<br />
1 - Muy en des acuerdo<br />
2 - Algo en des acuerdo<br />
3 - Ni en acuerdo o des acuerdo<br />
4 - Algo de acuerdo<br />
5 - Muy de acuerdoNo lea:<br />
68
Nevada <strong>Department</strong> <strong>of</strong> <strong>Employment</strong>, <strong>Training</strong> <strong>and</strong> <strong>Rehabilitation</strong><br />
2011 General Client Satisfaction Survey<br />
No sabe / No está seguro/a<br />
Se niega a contestar<br />
a. Recibe el tipo de trabajo que quería .<br />
b. Me gusta el trabajo que tengo hoy.<br />
c. Siento que tengo la necesarias habilidades para mantener el trabajo que tengo.<br />
d. El programa de rehabilitación vocacional siempre me dio los servicios para<br />
conseguir el trabajo que tengo hoy.<br />
e. El programa de rehabilitación vocacional siempre me dio los servicios que<br />
necesitaba para mantener el trabajo que tengo hoy.<br />
Q18<br />
What is the MAIN REASON you are not currently employed? Please allow me to<br />
read the entire list before answering, <strong>and</strong> choose ONLY ONE response.<br />
READ<br />
1 - Attending school<br />
2 - Volunteering<br />
3 - Employer could not accommodate my disability<br />
4 - Fired or laid <strong>of</strong>f from previous job<br />
5 - Could not find any job<br />
6 - Could not find the kind <strong>of</strong> job I wanted<br />
7 - Could not find a job I was qualified for<br />
8 - Lack <strong>of</strong> transportation<br />
9 - Could not work because <strong>of</strong> family commitments<br />
10 - Could not work because <strong>of</strong> other commitments<br />
11 - Did not want to lose health insurance from another source<br />
12 - Changed my mind about the value <strong>of</strong> working<br />
13 - Retired<br />
DO NOT READ<br />
77 - Other (specify)<br />
78 - Disability<br />
79 - Other medical reason (not disability-related)<br />
88 - Don't Know<br />
99 - Refused<br />
INTERVIEWER NOTE: Read 78 <strong>and</strong> 79 ONLY if respondent mentions their<br />
disability as a reason for not working; but be sure to read BOTH 78 <strong>and</strong> 79,<br />
PROBE: "So would the MAIN reason you are not currently employed be because<br />
<strong>of</strong> your disability or some other medical reason not disability related?"<br />
69
Nevada <strong>Department</strong> <strong>of</strong> <strong>Employment</strong>, <strong>Training</strong> <strong>and</strong> <strong>Rehabilitation</strong><br />
2011 General Client Satisfaction Survey<br />
THIS SPACE IS ONLY FOR CODE 77, “OTHER” SPECIFY:<br />
[__________________________________________________](50 characters)<br />
SECTION 5: NEEDED IMPROVEMENTS AND POSITIVE ASPECTS<br />
Cuál es la RAZÓN PRINCIPAL por la cual no tiene trabajo? Por favor deje que lea toda<br />
la lista antes de escoger una repuesta y SOLO escoja UNA.<br />
1. Estoy asistiendo a la escuela<br />
2. Voluntario<br />
3. Mi empleador no pudo acomodar mi discapacidad<br />
4. Despedido o lo descansaron del su trabajo anterior<br />
5. No puede encontrar trabajo<br />
6. No pude encontrar el tipo trabajo que deseo<br />
7. No puedo encontrar un trabajo en que estoy calificado para aplicar<br />
8. No tiene transportación<br />
9. No puede trabajar porque tiene compromisos de familia<br />
10. No puede trabar porque tiene otros compromisos<br />
11. No quiso perder su seguro de salud de otros fuentes<br />
12. Cambie mi opinión sobre el valor del trabajo<br />
13. Jubilado/a<br />
No lea<br />
Otro (especifique)<br />
Incapacidad<br />
Otras razones médicas (que no tengas que ver con su incapacidad)<br />
No sabe/No esta seguro/a<br />
Se niega a contestar<br />
NOTA PARA ENTREVISTADOR: Lee 78 y 79 SÓLO si el respondiente menciona la<br />
incapacidad como una razón para no trabajar, pero asegúrese de leer LOS DOS<br />
78 y 79. PROBE: "¿Entonces la razón PRINCIPAL por la que no está actualmente<br />
empleado es debida a su incapacidad o por algun otra razon medica no<br />
relacionada con una incapacidad?"<br />
ESTE ESPACIO ES SOLO PARA CODIGO 77, "OTRO" ESPECIFICAR:<br />
[__________________________________________________](50 characters)<br />
Q19<br />
Based on your own experiences with the vocational rehabilitation program, are there<br />
any specific CHANGES that you think could be made in order to IMPROVE the<br />
program?<br />
70
1 - To answer (specify)<br />
2 - No comments<br />
Nevada <strong>Department</strong> <strong>of</strong> <strong>Employment</strong>, <strong>Training</strong> <strong>and</strong> <strong>Rehabilitation</strong><br />
2011 General Client Satisfaction Survey<br />
Basada en sus experiencias con el programa de rehabilitación vocacional, hay<br />
CAMBIOS específicos que usted piensa que se puedan hacer para MEJORAR el<br />
programa?<br />
1. Contestar<br />
2. No hay comentarios<br />
Q20<br />
Based on your own experiences with the vocational rehabilitation program, are there<br />
any specific POSITIVE aspects that should be continued or exp<strong>and</strong>ed in the future?<br />
1 - To answer (specify)<br />
2 - No comments<br />
Basada en sus experiencias con el programa de rehabilitación vocacional, hay algun<br />
aspecto POSITIVO en cual usted cree que se debería continuar o exp<strong>and</strong>ir en el<br />
futuro?<br />
1. Contestar<br />
2. No hay comentarios<br />
Q21<br />
Which Vocational <strong>Rehabilitation</strong> location did you receive all OR a majority <strong>of</strong> your<br />
services from?<br />
De cual <strong>of</strong>icina de rehabilitación vocacional recibió toda o la mayoría de sus<br />
servicios?<br />
NOTE: You may only select one, if you received services from multiple locations,<br />
please select the location you received the majority <strong>of</strong> your services from.<br />
NOTA: Sólo se puede seleccionar uno, si ha recibido los servicios desde varias<br />
ubicaciones, por favor seleccione la ubicación donde obtuvo la mayoría de sus<br />
servicios.<br />
1. Carson City (1370 South Curry Street)<br />
2. Carson City (1933 North Carson Street)<br />
3. Elko (172 6th Street)<br />
4. Ely (1500 Ave F #1)<br />
5. Fallon (121 Industrial Way)<br />
6. Henderson (119 Water Street)<br />
7. Las Vegas (3016 West Charleston Boulevard - Suite 200; “West Bay”)<br />
8. Las Vegas (6161 West Charleston Boulevard; “Mental Health Campus”)<br />
71
Nevada <strong>Department</strong> <strong>of</strong> <strong>Employment</strong>, <strong>Training</strong> <strong>and</strong> <strong>Rehabilitation</strong><br />
2011 General Client Satisfaction Survey<br />
9. Las Vegas (3405 South Maryl<strong>and</strong> Parkway)<br />
10. North Las Vegas (2827 Las Vegas Boulevard North; “North Town”)<br />
11. Reno (1325 Corporate Boulevard; “Corporate Office”)<br />
12. Reno (4001 South Virginia Street; “Old Town Mall”)<br />
13. Sparks (1675 East Prater Way)<br />
14. Winnemucca (475 West Haskell, #2)<br />
15. Other [please enter here]<br />
Closing Statement<br />
Those are all the questions I have. I'd like to thank you on behalf <strong>of</strong> the <strong>Department</strong><br />
<strong>of</strong> <strong>Employment</strong>, <strong>Training</strong>, <strong>and</strong> <strong>Rehabilitation</strong> for answering these questions. Thanks<br />
again. Goodbye.<br />
Esas son todas las preguntas que tengo. Le doy las gracias de parte del departamento<br />
de empleo, entrenamiento, y rehabilitación por contestar mis preguntas. Gracias otra<br />
vez. Adiós.<br />
Interviewer: READ ONLY IF RESPONDENT HAS FURTHER QUESTIONS. If you<br />
have any questions about this survey, you may call my supervisor toll-free at 1-800-929-<br />
9079 or 1-775-784-6421.<br />
1 - To continue<br />
Entrevistador: Solamente lea si el Respondente tiene más preguntas. Si tiene más<br />
preguntas sobre la encuesta, puede llamar a mi supervisor gratis al 1-800-929-9079 o<br />
al 775-784-6421.<br />
1 - Para continuar<br />
72
Nevada <strong>Department</strong> <strong>of</strong> <strong>Employment</strong>, <strong>Training</strong> <strong>and</strong> <strong>Rehabilitation</strong><br />
2011 General Client Satisfaction Survey<br />
Appendix C:<br />
Cover Letter<br />
Invitations<br />
73
Appendix C1: Cover Letter Invitation to Clients<br />
January 4, 2011<br />
Dear Jane Doe,<br />
Nevada <strong>Department</strong> <strong>of</strong> <strong>Employment</strong>, <strong>Training</strong> <strong>and</strong> <strong>Rehabilitation</strong><br />
2011 General Client Satisfaction Survey<br />
The State <strong>of</strong> Nevada <strong>Rehabilitation</strong> Division, in cooperation with the University <strong>of</strong><br />
Nevada (UNR), Center for Research Design <strong>and</strong> Analysis, is conducting a survey <strong>of</strong><br />
individuals who have received our services. Every year, we contact people who worked<br />
with our vocational rehabilitation counselors <strong>and</strong> received help with training, finding a<br />
job, or going from school to work or post-educational activities. We are interested in<br />
knowing your opinions about the Vocational <strong>Rehabilitation</strong> Division, its services, <strong>and</strong> its<br />
employees, in order to improve our services in the future. Whether you feel that the<br />
service you received from the Vocational <strong>Rehabilitation</strong> Division was good or bad, we<br />
would like to find out what you think. There is no such thing as a right or wrong answer;<br />
we are only interested in your opinion.<br />
All <strong>of</strong> your responses are confidential <strong>and</strong> your name or any other identifying information<br />
will not be given to anyone at the Vocational <strong>Rehabilitation</strong> Division. UNR will compile<br />
all the responses <strong>and</strong> will share only the collective results with the Vocational<br />
<strong>Rehabilitation</strong> Division. UNR will then provide suggested actions necessary to examine<br />
the Vocational <strong>Rehabilitation</strong> Division processes based upon your input.<br />
As an incentive, the Vocational <strong>Rehabilitation</strong> Division is holding a drawing for four<br />
prepaid Visa gift cards valued at $50.00 each, which can be used at any location that<br />
accepts VISA. The winners will be selected from those who responded to the survey.<br />
The survey will be conducted by the University <strong>of</strong> Nevada, Reno, Center for Research<br />
Design <strong>and</strong> Analysis, <strong>and</strong> will include brief questions about your experiences with the<br />
Vocational <strong>Rehabilitation</strong> Division. An interviewer from the University <strong>of</strong> Nevada, Reno<br />
will be calling your household within the next 2-3 weeks to conduct the survey over the<br />
telephone. The interview will only take about 10 minutes <strong>of</strong> your time to complete. If the<br />
call comes at a busy time, please let the interviewer know a more convenient time.<br />
Remember, to be eligible for the VISA gift card you must participate in the survey.<br />
74
Nevada <strong>Department</strong> <strong>of</strong> <strong>Employment</strong>, <strong>Training</strong> <strong>and</strong> <strong>Rehabilitation</strong><br />
2011 General Client Satisfaction Survey<br />
If you would like more information about the survey, you may call 1-800-929-9079. If<br />
you would like to take the survey on the Internet instead, please take a moment to go to<br />
this web address: http://www.crda.unr.edu/client. This website also contains some<br />
Frequently Asked Questions (FAQs) about this study. The web-based survey also takes<br />
only about 10 minutes to complete. When you get to the website, the survey will ask you<br />
to enter your User ID number. Thank you in advance for your participation. Your User<br />
ID is 00000.<br />
Sincerely,<br />
Maureen Cole,<br />
Administrator<br />
75
Nevada <strong>Department</strong> <strong>of</strong> <strong>Employment</strong>, <strong>Training</strong> <strong>and</strong> <strong>Rehabilitation</strong><br />
2011 General Client Satisfaction Survey<br />
Appendix D:<br />
Website Information<br />
about Study<br />
76
Nevada <strong>Department</strong> <strong>of</strong> <strong>Employment</strong>, <strong>Training</strong> <strong>and</strong> <strong>Rehabilitation</strong><br />
2011 General Client Satisfaction Survey<br />
<strong>Department</strong> <strong>of</strong> <strong>Employment</strong>, <strong>Training</strong>, <strong>and</strong> <strong>Rehabilitation</strong> Client Survey<br />
[Click to view larger text] [Take the survey now] [Click to view letter]<br />
Frequently Asked Questions:<br />
What is the project about?<br />
DETR has enlisted the services <strong>of</strong> CRDA to help collect assessment information on client satisfaction <strong>of</strong> their services. Primarily, there are<br />
two surveys assessing client satisfaction, (1) vocational rehabilitation services, <strong>and</strong> (2) transition student services. The surveys are being<br />
conducted to assess the basic needs <strong>of</strong> individuals with disabilities who seek employment, <strong>and</strong> to assess or determine if new or modified<br />
services are needed in the future.<br />
Vocational rehabilitation survey (aka General Client Survey): (a) Determine satisfaction with vocational rehabilitation services (b) Gather<br />
basic information on consumer needs <strong>and</strong> on barriers to employment. Areas to be covered in the survey are; mobility, communication, selfcare,<br />
interpersonal skills, work tolerance (e.g., length <strong>of</strong> time person is able to work in work conditions <strong>and</strong> ability to perform functions in a<br />
work setting), <strong>and</strong> demographics.<br />
For your participation, you will also be entered into a drawing for a chance to receive 1 <strong>of</strong> 4 prepaid $50.00 VISA gift cards that can be used<br />
at any location that accepts VISA.<br />
• Link to take the online survey: [Take the survey now]<br />
Please click above to be taken to the <strong>Department</strong> <strong>of</strong> <strong>Employment</strong>, <strong>Training</strong> <strong>and</strong> <strong>Rehabilitation</strong> Client Survey. If the link does not take you<br />
there, copy the entire address below <strong>and</strong> paste it in the address line <strong>of</strong> your web browser. If you are having trouble accessing the online<br />
survey please call 1-800-929-9079 for assistance.<br />
https://www.cisweb1.unr.edu/survey/detrclient2011.aspx<br />
• What is the Vocational <strong>Rehabilitation</strong> Survey about?<br />
The Vocational <strong>Rehabilitation</strong> Survey is being assessed to collect information regarding client satisfaction on DETR services, such as (a)<br />
determining satisfaction with vocational rehabilitation services, <strong>and</strong> (b) gathering basic information on consumer needs <strong>and</strong> on barriers to<br />
employment.<br />
• Who is in charge <strong>of</strong> the project?<br />
The CRDA (Center for Research Design <strong>and</strong> Analysis) is conducting this study on behalf <strong>of</strong> DETR (DETR, the Nevada <strong>Department</strong> <strong>of</strong><br />
<strong>Employment</strong>, <strong>Training</strong> <strong>and</strong> <strong>Rehabilitation</strong>). The Principal Investigator is Dr. Veronica Dahir.<br />
• What kind <strong>of</strong> questions will you ask?<br />
The survey is a combination <strong>of</strong> open-<strong>and</strong> close-ended questions, which assess client satisfaction with DETR services. No identifying<br />
information will be collected.<br />
77
Nevada <strong>Department</strong> <strong>of</strong> <strong>Employment</strong>, <strong>Training</strong> <strong>and</strong> <strong>Rehabilitation</strong><br />
2011 General Client Satisfaction Survey<br />
• Who are you conducting the survey for?<br />
The study is being conducted for DETR, the Nevada <strong>Department</strong> <strong>of</strong> <strong>Employment</strong>, <strong>Training</strong> <strong>and</strong> <strong>Rehabilitation</strong>.<br />
• Who is funding the project?<br />
This project is funded by DETR, the Nevada <strong>Department</strong> <strong>of</strong> <strong>Employment</strong>, <strong>Training</strong> <strong>and</strong> <strong>Rehabilitation</strong>.<br />
• How can I verify that?<br />
You can contact Tammy M<strong>of</strong>fitt at the Nevada <strong>Department</strong> <strong>of</strong> <strong>Employment</strong>, <strong>Training</strong> <strong>and</strong> <strong>Rehabilitation</strong> at (775) 684-4060 to verify the<br />
current study. You may also contact CRDA to verify at (800) 929-9079.<br />
• How will these data be used?<br />
These data will be used to help the Nevada <strong>Department</strong> <strong>of</strong> <strong>Employment</strong>, <strong>Training</strong> <strong>and</strong> <strong>Rehabilitation</strong> assess their current services provided<br />
to clients, <strong>and</strong> assist in implementing or changing future services.<br />
• Can I get a copy <strong>of</strong> the results? Will the results be published?<br />
The results will be disseminated through the Nevada <strong>Department</strong> <strong>of</strong> <strong>Employment</strong>, <strong>Training</strong> <strong>and</strong> <strong>Rehabilitation</strong>. The results will not be<br />
publicly published.<br />
• Where did you get my name <strong>and</strong> phone number?<br />
Your name <strong>and</strong> number were provided to us by the Nevada <strong>Department</strong> <strong>of</strong> <strong>Employment</strong>, <strong>Training</strong> <strong>and</strong> <strong>Rehabilitation</strong> as a client <strong>of</strong> either<br />
vocational rehabilitation services or transition student services.<br />
• Why are you asking me to participate in this study?<br />
You are being invited to participate in this research project because you are a current or past client <strong>of</strong> the Nevada <strong>Department</strong> <strong>of</strong><br />
<strong>Employment</strong>, <strong>Training</strong> <strong>and</strong> <strong>Rehabilitation</strong>.<br />
• How did you pick me?<br />
Your name was provided to us by the Nevada <strong>Department</strong> <strong>of</strong> <strong>Employment</strong>, <strong>Training</strong> <strong>and</strong> <strong>Rehabilitation</strong> as a client <strong>of</strong> either vocational<br />
rehabilitation services or transition student services.<br />
• Will it be possible to identify me by inference?<br />
All the information you provide us will only be used in summary or aggregate form. No individual responses will be reported <strong>and</strong> no names<br />
will be connected to the data during data analysis.<br />
• Who will see my name or have access to my responses?<br />
Survey data, code sheets, <strong>and</strong> identifying information will be stored separately in secure file cabinets for five years. Access to the data will<br />
be restricted to project personnel at the Center for Research Design <strong>and</strong> Analysis, <strong>and</strong> the Nevada <strong>Department</strong> <strong>of</strong> <strong>Employment</strong>, <strong>Training</strong><br />
<strong>and</strong> <strong>Rehabilitation</strong>. CRDA <strong>and</strong> DETR will not be able to identify your personal responses.<br />
• Why can't I fill out a mail survey or a web-based survey?<br />
The current survey(s) are not available in a mail-survey format. There is a web-based survey, however, if you have an impairment that<br />
would prevent you from taking this via the phone. The link to the web-based survey is given above (or you can click here) <strong>and</strong> you can enter<br />
the case id number that was given to you.<br />
• I am on the Do Not Call List. Why are you calling me?<br />
The National Do Not Call List <strong>and</strong> Nevada's Do Not Call List applies to telemarketers, not to researchers or surveyors. We are not selling<br />
anything or asking for donations.<br />
• I already did this last year. Why are you calling me again?<br />
We underst<strong>and</strong> <strong>and</strong> appreciate your help with the previous year. Your answers helped DETR improve their services <strong>and</strong> that is why we are<br />
78
Nevada <strong>Department</strong> <strong>of</strong> <strong>Employment</strong>, <strong>Training</strong> <strong>and</strong> <strong>Rehabilitation</strong><br />
2011 General Client Satisfaction Survey<br />
calling you again. We conduct this study every year <strong>and</strong> we would appreciate your help once more, so that DETR can keep on improving<br />
their services in order to serve its clients with better satisfaction.<br />
The Principal Investigator for this project is Dr. Veronica Dahir, she is a faculty member here at the University <strong>of</strong> Nevada, Reno.<br />
If you have further questions about this project please call our 800 line at 1-800-929-9079.<br />
Overview <strong>of</strong> DETR Background Information<br />
DETR: <strong>Department</strong> <strong>of</strong> <strong>Employment</strong> <strong>Training</strong> <strong>and</strong> <strong>Rehabilitation</strong> (homepage)<br />
DETR is the acronym for the <strong>Department</strong> <strong>of</strong> <strong>Employment</strong>, <strong>Training</strong> <strong>and</strong> <strong>Rehabilitation</strong>.<br />
The <strong>Rehabilitation</strong> Division provides services for people with disabilities to help enable them to work <strong>and</strong> live independently. The Division<br />
also provides disability determinations for individuals who claim benefits under the Social Security Disability program. The <strong>Rehabilitation</strong><br />
Divisions vision is that <strong>of</strong> a barrier-free future where every individual in Nevada has equal vocational <strong>and</strong> independent living opportunity.<br />
Vocational <strong>Rehabilitation</strong> is a state <strong>and</strong> federally funded program that helps eligible people with disabilities become employed. An individual<br />
is eligible if: (1) Has a physical or mental impairment which constitutes or results in a substantial impediment to employment; <strong>and</strong> can<br />
benefit in terms <strong>of</strong> an employment outcome from vocational rehabilitation services <strong>and</strong> (2) Requires vocational rehabilitation services to<br />
prepare for, enter, engage in, or retain gainful employment consistent with the individual's strengths, resources, priorities, concerns,<br />
abilities, capabilities, <strong>and</strong> informed choice.<br />
About CRDA<br />
The Center for Research Design <strong>and</strong> Analysis (CRDA) is an academically-based, multidisciplinary research institute under the Vice<br />
President <strong>of</strong> Research at the University <strong>of</strong> Nevada, Reno. The institution, that was formerly known as Senator Alan Bible Center for Applied<br />
Research (SABCAR) <strong>and</strong> is now known as the Center for Research Design <strong>and</strong> Analysis (CRDA) was originally established in 1959 as the<br />
Bureau <strong>of</strong> Governmental Research. The Center's mission is to provide the most valid <strong>and</strong> reliable data possible across a broad spectrum <strong>of</strong><br />
data collection protocols <strong>and</strong> analysis activities. Since 1959 we have completed hundreds <strong>of</strong> r<strong>and</strong>om digit dial survey research projects<br />
ranging from sample sizes <strong>of</strong> 600 to 6000+ interviews.<br />
CRDA utilizes a wide range <strong>of</strong> data collection techniques for telephone, mail, <strong>and</strong> internet surveys. These techniques include a state-<strong>of</strong>-theart<br />
computer-assisted telephone interview (CATI) system <strong>and</strong> computer-assisted personal interview (CAPI) systems. In addition, the center<br />
uses TELEFORM, a sophisticated questionnaire design s<strong>of</strong>tware used to fully automate large scale questionnaire mail-out projects. The<br />
Center's staff provide expertise in survey research, psychometrics, univariate <strong>and</strong> multivariate statistical analysis, research design,<br />
sampling, mathematical modeling, <strong>and</strong> program evaluation. Many <strong>of</strong> the Center's research projects are aimed at solving problems <strong>and</strong><br />
providing data <strong>and</strong> information to state <strong>and</strong> federal agencies for use in program planning <strong>and</strong> resource allocation. The Center also provides<br />
in-house research support to faculty, students, <strong>and</strong> community-based groups.<br />
University <strong>of</strong> Nevada, Reno<br />
Maintained by: javierg@unr.edu<br />
Last Modified: January 21, 2011<br />
CENTER FOR RESEARCH DESIGN AND ANALYSIS/088<br />
Sarah H. Fleischmann Building (SFB)<br />
University <strong>of</strong> Nevada, Reno<br />
Reno, Nevada 89557-0017<br />
Phone: 1-800-929-9079 or 1-775-784-6412 for local calls<br />
Fax: 1-775-784-4506<br />
79
Nevada <strong>Department</strong> <strong>of</strong> <strong>Employment</strong>, <strong>Training</strong> <strong>and</strong> <strong>Rehabilitation</strong><br />
2011 General Client Satisfaction Survey<br />
Appendix E:<br />
List <strong>of</strong> Nevada Areas<br />
Called<br />
80
Nevada <strong>Department</strong> <strong>of</strong> <strong>Employment</strong>, <strong>Training</strong> <strong>and</strong> <strong>Rehabilitation</strong><br />
2011 General Client Satisfaction Survey<br />
Appendix E: Listing <strong>of</strong> Nevada Areas Called for General Client<br />
Satisfaction Survey<br />
Southern Nevada<br />
Boulder City<br />
Caliente<br />
Henderson<br />
La Crosse<br />
Las Vegas<br />
Laughlin<br />
Mesquite<br />
Nelson<br />
North Las Vegas<br />
Pahrump<br />
Park City<br />
S<strong>and</strong>y Valley<br />
Torrance<br />
Northern Nevada<br />
Carson City<br />
Denio<br />
Incline Village<br />
Lemon Valley<br />
McDermitt<br />
Reno<br />
Sparks<br />
Sun Valley<br />
Truckee<br />
Verdi<br />
Washoe Valley<br />
Rural Nevada<br />
81<br />
Battle Mountain<br />
Beowawe<br />
Carlin<br />
Dayton<br />
Elburz<br />
Elko<br />
Ely<br />
Eureka<br />
Fallon<br />
Fernley<br />
Gabbs<br />
Gardnerville<br />
Golconda<br />
Hawthorne<br />
Henrietta<br />
Imlay<br />
Lovelock<br />
Lund<br />
McGill<br />
Minden<br />
Moundhouse<br />
Ruth<br />
Silver Springs<br />
Spring Creek<br />
Stagecoach<br />
Stateline<br />
Virginia City<br />
Wadsworth<br />
Wellington<br />
Wells<br />
West Wendover<br />
Winnemucca<br />
Yerington
Nevada <strong>Department</strong> <strong>of</strong> <strong>Employment</strong>, <strong>Training</strong> <strong>and</strong> <strong>Rehabilitation</strong><br />
2011 General Client Satisfaction Survey<br />
Appendix F:<br />
Data Tables<br />
82
83<br />
Nevada <strong>Department</strong> <strong>of</strong> <strong>Employment</strong>, <strong>Training</strong> <strong>and</strong> <strong>Rehabilitation</strong><br />
2011 General Client Satisfaction Survey<br />
Table Q1: Overall, how dissatisfied or satisfied are you with the quality <strong>of</strong> the services you received from the Vocational <strong>Rehabilitation</strong> Program?<br />
Overall Total Total<br />
Q1<br />
Very Dissatisfied Somewhat Dissatisfied<br />
Neither Dissatisfied nor<br />
Satisfied Somewhat Satisfied Very Satisfied Total<br />
N % C.I.(95%) N % C.I.(95%) N % C.I.(95%) N % C.I.(95%) N % C.I.(95%) N % C.I.(95%)<br />
46 9.1% (6.5-11.7) 38 7.6% (5.2-10.0) 45 8.5% (6.0-10.9) 116 22.9% (19.1-26.7) 271 51.9% (47.3-56.4) 516 100.0% (_-_)<br />
Gender Male 24 9.3% (5.7-12.9) 20 7.6% (4.3-10.8) 20 7.0% (3.9-10.0) 50 20.3% (15.1-25.4) 140 55.9% (49.4-62.4) 254 48.7% (44.1-53.3)<br />
Female 22 9.0% (5.3-12.7) 18 7.6% (4.1-11.2) 25 9.9% (6.1-13.7) 66 25.5% (20.0-31.0) 131 48.0% (41.7-54.3) 262 51.3% (46.7-55.9)<br />
Total 46 9.1% (6.5-11.7) 38 7.6% (5.2-10.0) 45 8.5% (6.0-10.9) 116 22.9% (19.1-26.7) 271 51.9% (47.3-56.4) 516 100.0% (_-_)<br />
Age
84<br />
Nevada <strong>Department</strong> <strong>of</strong> <strong>Employment</strong>, <strong>Training</strong> <strong>and</strong> <strong>Rehabilitation</strong><br />
2011 General Client Satisfaction Survey<br />
Table Q1: Overall, how dissatisfied or satisfied are you with the quality <strong>of</strong> the services you received from the Vocational <strong>Rehabilitation</strong> Program?<br />
Q1<br />
Very Dissatisfied Somewhat Dissatisfied<br />
Neither Dissatisfied nor<br />
Satisfied Somewhat Satisfied Very Satisfied Total<br />
N % C.I.(95%) N % C.I.(95%) N % C.I.(95%) N % C.I.(95%) N % C.I.(95%) N % C.I.(95%)<br />
Ever received any transportation services Yes 13 5.3% (2.4-8.1) 11 5.4% (2.2-8.5) 13 5.3% (2.4-8.2) 58 27.5% (21.2-33.9) 123 56.5% (49.4-63.6) 218 44.9% (40.2-49.6)<br />
No 32 12.5% (8.3-16.6) 25 9.1% (5.5-12.7) 28 10.0% (6.4-13.7) 56 19.8% (15.0-24.6) 143 48.6% (42.6-54.7) 284 55.1% (50.4-59.8)<br />
Total 45 9.2% (6.6-11.9) 36 7.4% (5.0-9.9) 41 7.9% (5.5-10.3) 114 23.2% (19.4-27.1) 266 52.2% (47.5-56.8) 502 100.0% (_-_)<br />
Currently Employed Yes 10 4.0% (1.5-6.4) 15 6.6% (3.2-10.0) 12 4.9% (2.1-7.7) 52 21.5% (16.2-26.8) 159 63.0% (56.7-69.2) 248 48.6% (44.0-53.3)<br />
No 35 14.3% (9.7-18.9) 21 8.2% (4.7-11.7) 30 11.0% (7.1-15.0) 63 25.2% (19.5-30.9) 105 41.2% (34.5-47.9) 254 51.4% (46.7-56.0)<br />
Total 45 9.3% (6.6-11.9) 36 7.5% (5.0-9.9) 42 8.0% (5.6-10.5) 115 23.4% (19.5-27.3) 264 51.8% (47.2-56.5) 502 100.0% (_-_)
85<br />
Nevada <strong>Department</strong> <strong>of</strong> <strong>Employment</strong>, <strong>Training</strong> <strong>and</strong> <strong>Rehabilitation</strong><br />
2011 General Client Satisfaction Survey<br />
Table Q2: Overall, how dissatisfied or satisfied are you with the timeliness <strong>of</strong> the services you received from the Vocational <strong>Rehabilitation</strong> Division?<br />
Q2<br />
Very Dissatisfied Somewhat Dissatisfied<br />
Neither Dissatisfied nor<br />
Satisfied Somewhat Satisfied Very Satisfied Don't Know/Refused Total<br />
N % C.I.(95%) N % C.I.(95%) N % C.I.(95%) N % C.I.(95%) N % C.I.(95%) N % C.I.(95%) N % C.I.(95%)<br />
Overall Total Total 48 9.3% (6.7-12.0) 37 6.7% (4.6-8.9) 59 11.6% (8.7-14.5) 121 23.7% (19.9-27.6) 247 47.8% (43.2-52.4) 4 0.8% (0.0-1.7) 516 100.0% (_-_)<br />
Gender Male<br />
27<br />
10.1<br />
% (6.4-13.8) 19 7.1% (3.9-10.2) 19 7.0% (3.9-10.1) 65 25.2% (19.7-30.8) 121 49.3% (42.6-56.0) 3 1.3% (0.0-2.7) 254 48.7% (44.1-53.3)<br />
Female 21 8.6% (4.8-12.3) 18 6.4% (3.5-9.4) 40 16.0% (11.2-20.7) 56 22.3% (17.0-27.6) 126 46.3% (40.0-52.6) 1 0.4% (0.0-1.3) 262 51.3% (46.7-55.9)<br />
Total 48 9.3% (6.7-12.0) 37 6.7% (4.6-8.9) 59 11.6% (8.7-14.5) 121 23.7% (19.9-27.6) 247 47.8% (43.2-52.4) 4 0.8% (0.0-1.7) 516 100.0% (_-_)<br />
Age
86<br />
Nevada <strong>Department</strong> <strong>of</strong> <strong>Employment</strong>, <strong>Training</strong> <strong>and</strong> <strong>Rehabilitation</strong><br />
2011 General Client Satisfaction Survey<br />
Table Q2: Overall, how dissatisfied or satisfied are you with the timeliness <strong>of</strong> the services you received from the Vocational <strong>Rehabilitation</strong> Division?<br />
Q2<br />
Ever received any communitybased<br />
assessment<br />
Ever received any assistive<br />
technology<br />
Ever received any<br />
transportation services<br />
Very Dissatisfied Somewhat Dissatisfied<br />
Neither Dissatisfied nor<br />
Satisfied Somewhat Satisfied Very Satisfied Don't Know/Refused Total<br />
N % C.I.(95%) N % C.I.(95%) N % C.I.(95%) N % C.I.(95%) N % C.I.(95%) N % C.I.(95%) N % C.I.(95%)<br />
Yes 14 8.6% (4.1-13.0) 11 7.0% (2.9-11.1) 17 12.0% (6.3-17.6) 30 21.0% (14.0-28.1) 71 50.8% (41.7-59.9) 1 0.6% (0.0-1.8) 144 31.4% (26.8-36.0)<br />
No 32 9.5% (6.2-12.8) 25 6.7% (4.1-9.3) 41 11.5% (8.1-15.0) 88 25.2% (20.5-29.9) 168 46.4% (41.1-51.8) 2 0.6% (0.0-1.5) 356 68.6% (64.0-73.2)<br />
Total 46 9.2% (6.5-11.9) 36 6.8% (4.6-9.0) 58 11.7% (8.7-14.6) 118 23.9% (20.0-27.8) 239 47.8% (43.1-52.5) 3 0.6% (0.0-1.3) 500 100.0% (_-_)<br />
Yes 25 8.3% (5.0-11.5) 21 6.1% (3.5-8.8) 26 8.0% (5.0-11.1) 76 24.6% (19.5-29.6) 160 52.3% (46.3-58.3) 2 0.7% (0.0-1.7) 310 59.0% (54.5-63.5)<br />
No<br />
23<br />
10.9<br />
% (6.5-15.3) 16 7.6% (4.0-11.3) 33 16.7% (11.3-22.2) 45 22.5% (16.6-28.4) 87 41.3% (34.4-48.2) 2 1.0% (0.0-2.4) 206 41.0% (36.5-45.5)<br />
Total 48 9.3% (6.7-12.0) 37 6.7% (4.6-8.9) 59 11.6% (8.7-14.5) 121 23.7% (19.9-27.6) 247 47.8% (43.2-52.4) 4 0.8% (0.0-1.7) 516 100.0% (_-_)<br />
Yes 13 5.2% (2.4-8.0) 18 7.6% (4.1-11.2) 21 9.8% (5.6-14.0) 51 23.9% (17.9-29.9) 114 52.9% (45.7-60.1) 1 0.5% (0.0-1.6) 218 44.9% (40.2-49.6)<br />
No<br />
33<br />
12.4<br />
% (8.2-16.6) 17 5.8% (3.0-8.5) 37 13.1% (9.0-17.1) 66 23.5% (18.3-28.6) 128 44.2% (38.2-50.2) 3 1.1% (0.0-2.4) 284 55.1% (50.4-59.8)<br />
Total 46 9.2% (6.5-11.8) 35 6.6% (4.4-8.8) 58 11.6% (8.7-14.5) 117 23.7% (19.8-27.6) 242 48.1% (43.4-52.8) 4 0.9% (0.0-1.7) 502 100.0% (_-_)<br />
Currently Employed Yes 14 5.9% (2.7-9.1) 13 4.8% (2.2-7.4) 17 6.9% (3.7-10.2) 57 24.7% (19.0-30.4) 145 56.7% (50.3-63.1) 2 1.0% (0.0-2.4) 248 48.6% (44.0-53.3)<br />
No<br />
32<br />
12.3<br />
% (8.1-16.5) 22 8.4% (4.9-11.8) 40 15.6% (10.9-20.3) 62 23.3% (17.9-28.7) 96 39.7% (32.9-46.4) 2 0.8% (0.0-1.8) 254 51.4% (46.7-56.0)<br />
Total 46 9.2% (6.5-11.8) 35 6.6% (4.4-8.8) 57 11.4% (8.5-14.3) 119 24.0% (20.1-27.9) 241 47.9% (43.3-52.6) 4 0.9% (0.0-1.7) 502 100.0% (_-_)
87<br />
Nevada <strong>Department</strong> <strong>of</strong> <strong>Employment</strong>, <strong>Training</strong> <strong>and</strong> <strong>Rehabilitation</strong><br />
2011 General Client Satisfaction Survey<br />
Table Q3: How dissatisfied or satisfied are you with the amount <strong>of</strong> choice you have between providers <strong>of</strong> vocational rehabilitation services?<br />
Q3<br />
Very Dissatisfied Somewhat Dissatisfied<br />
Neither Dissatisfied nor<br />
Satisfied Somewhat Satisfied Very Satisfied Don't Know/Refused Total<br />
N % C.I.(95%) N % C.I.(95%) N % C.I.(95%) N % C.I.(95%) N % C.I.(95%) N % C.I.(95%) N % C.I.(95%)<br />
Overall Total Total 63 12.2% (9.3-15.2) 49 9.4% (6.8-12.0) 74 14.4% (11.2-17.5) 118 22.6% (18.9-26.4) 206 40.2% (35.6-44.8) 6 1.2% (0.1-2.2) 516 100.0% (_-_)<br />
Gender Male 37 14.3% (9.9-18.7) 26 9.5% (5.9-13.1) 32 12.5% (8.3-16.6) 50 19.5% (14.5-24.5) 105 43.0% (36.3-49.8) 4 1.2% (0.0-2.4) 254 48.7% (44.1-53.3)<br />
Female 26 10.3% (6.4-14.2) 23 9.3% (5.5-13.1) 42 16.2% (11.5-20.8) 68 25.6% (20.1-31.1) 101 37.5% (31.4-43.6) 2 1.1% (0.0-2.9) 262 51.3% (46.7-55.9)<br />
Total 63 12.2% (9.3-15.2) 49 9.4% (6.8-12.0) 74 14.4% (11.2-17.5) 118 22.6% (18.9-26.4) 206 40.2% (35.6-44.8) 6 1.2% (0.1-2.2) 516 100.0% (_-_)<br />
Age
88<br />
Nevada <strong>Department</strong> <strong>of</strong> <strong>Employment</strong>, <strong>Training</strong> <strong>and</strong> <strong>Rehabilitation</strong><br />
2011 General Client Satisfaction Survey<br />
Table Q3: How dissatisfied or satisfied are you with the amount <strong>of</strong> choice you have between providers <strong>of</strong> vocational rehabilitation services?<br />
Q3<br />
Ever received any assistive<br />
technology<br />
Ever received any<br />
transportation services<br />
Very Dissatisfied Somewhat Dissatisfied<br />
Neither Dissatisfied nor<br />
Satisfied Somewhat Satisfied Very Satisfied Don't Know/Refused Total<br />
N % C.I.(95%) N % C.I.(95%) N % C.I.(95%) N % C.I.(95%) N % C.I.(95%) N % C.I.(95%) N % C.I.(95%)<br />
Yes 32 10.0% (6.6-13.4) 29 9.6% (6.1-13.1) 41 13.3% (9.3-17.2) 75 23.7% (18.7-28.7) 127 41.5% (35.5-47.6) 6 2.0% (0.2-3.8) 310 59.0% (54.5-63.5)<br />
No 31 15.5% (10.3-20.7) 20 9.2% (5.2-13.2) 33 15.9% (10.8-21.1) 43 21.0% (15.3-26.8) 79 38.3% (31.5-45.2) 0 . (.-.) 206 41.0% (36.5-45.5)<br />
Total 63 12.2% (9.3-15.2) 49 9.4% (6.8-12.0) 74 14.4% (11.2-17.5) 118 22.6% (18.9-26.4) 206 40.2% (35.6-44.8) 6 1.2% (0.1-2.2) 516 100.0% (_-_)<br />
Yes 16 6.7% (3.4-10.0) 22 9.8% (5.8-13.8) 29 13.3% (8.6-18.0) 48 21.1% (15.5-26.7) 101 48.5% (41.2-55.8) 2 0.7% (0.0-1.6) 218 44.9% (40.2-49.6)<br />
No 45 16.8% (12.2-21.4) 24 8.7% (5.2-12.2) 45 16.0% (11.6-20.4) 65 22.8% (17.8-27.8) 102 34.4% (28.8-40.1) 3 1.3% (0.0-3.0) 284 55.1% (50.4-59.8)<br />
Total 61 12.3% (9.3-15.3) 46 9.2% (6.5-11.8) 74 14.8% (11.6-18.0) 113 22.0% (18.3-25.8) 203 40.7% (36.1-45.4) 5 1.0% (0.0-2.0) 502 100.0% (_-_)<br />
Currently Employed Yes 18 6.9% (3.8-10.0) 11 5.0% (1.9-8.0) 32 13.2% (8.8-17.6) 63 25.2% (19.7-30.8) 121 48.1% (41.6-54.5) 3 1.6% (0.0-3.6) 248 48.6% (44.0-53.3)<br />
No 43 17.4% (12.5-22.4) 36 13.4% (9.2-17.7) 42 16.3% (11.6-21.1) 51 18.9% (14.0-23.8) 81 33.6% (26.9-40.3) 1 0.2% (0.0-0.7) 254 51.4% (46.7-56.0)<br />
Total 61 12.3% (9.3-15.3) 47 9.3% (6.7-12.0) 74 14.8% (11.6-18.0) 114 22.0% (18.3-25.7) 202 40.7% (36.0-45.3) 4 0.9% (0.0-1.9) 502 100.0% (_-_)
89<br />
Nevada <strong>Department</strong> <strong>of</strong> <strong>Employment</strong>, <strong>Training</strong> <strong>and</strong> <strong>Rehabilitation</strong><br />
2011 General Client Satisfaction Survey<br />
Table Q4: How dissatisfied or satisfied are you with the ability <strong>of</strong> the Vocational <strong>Rehabilitation</strong> Program to help you get or keep a job?<br />
Q4<br />
Overall Total Total<br />
Gender Male<br />
Female<br />
Total<br />
Age
90<br />
Nevada <strong>Department</strong> <strong>of</strong> <strong>Employment</strong>, <strong>Training</strong> <strong>and</strong> <strong>Rehabilitation</strong><br />
2011 General Client Satisfaction Survey<br />
Table Q4: How dissatisfied or satisfied are you with the ability <strong>of</strong> the Vocational <strong>Rehabilitation</strong> Program to help you get or keep a job?<br />
Ever received any<br />
counselor-based<br />
assessment<br />
Ever received any<br />
community-based<br />
assessment<br />
Q4<br />
Ever received any<br />
assistive technology<br />
Ever received any<br />
transportation services<br />
Yes<br />
No<br />
Total<br />
Yes<br />
No<br />
Total<br />
Yes<br />
No<br />
Total<br />
Yes<br />
No<br />
Total<br />
Currently Employed Yes<br />
No<br />
Total<br />
Very Dissatisfied Somewhat Dissatisfied<br />
Neither Dissatisfied nor<br />
Satisfied Somewhat Satisfied Very Satisfied Don't Know/Refused Total<br />
N % C.I.(95%) N % C.I.(95%) N % C.I.(95%) N % C.I.(95%) N %<br />
33 11.3% (7.5-15.0) 21 7.3% (4.2-10.4) 37 13.2% (9.0-17.3) 52 17.8% (13.2-22.4) 136 48.5%<br />
47 23.8% (17.6-30.0) 14 7.0% (3.4-10.7) 27 13.8% (8.7-18.8) 38 18.1% (12.7-23.4) 72 32.7%<br />
84 16.5% (13.1-19.9) 36 7.3% (4.9-9.6) 69 13.8% (10.7-17.0) 92 17.6% (14.2-21.1) 214 41.6%<br />
23 15.0% (9.1-20.8) 9 6.4% (2.2-10.6) 13 9.1% (4.0-14.2) 23 15.7% (9.5-22.0) 75 53.2%<br />
60 17.5% (13.3-21.7) 26 7.6% (4.7-10.4) 55 16.1% (12.1-20.1) 68 18.9% (14.7-23.1) 132 35.7%<br />
83 16.7% (13.3-20.1) 35 7.2% (4.8-9.6) 68 13.9% (10.7-17.1) 91 17.9% (14.4-21.4) 207 41.2%<br />
39 12.2% (8.4-16.0) 21 6.8% (3.9-9.8) 39 12.6% (8.7-16.4) 61 19.5% (14.9-24.2) 137 44.9%<br />
45 22.3% (16.4-28.2) 15 7.7% (3.8-11.5) 31 15.7% (10.4-21.1) 31 14.5% (9.7-19.4) 80 37.8%<br />
84 16.4% (13.0-19.7) 36 7.2% (4.9-9.5) 70 13.9% (10.7-17.0) 92 17.5% (14.1-20.9) 217 42.0%<br />
24 10.9% (6.6-15.1) 14 6.3% (3.0-9.6) 27 12.8% (7.9-17.6) 44 19.8% (14.2-25.3) 104 48.2%<br />
58 21.0% (16.0-26.1) 22 8.3% (4.9-11.7) 40 14.6% (10.3-18.9) 45 15.4% (11.1-19.7) 107 36.6%<br />
82 16.5% (13.1-19.9) 36 7.4% (5.0-9.8) 67 13.8% (10.6-17.0) 89 17.4% (13.9-20.8) 211 41.8%<br />
23 9.4% (5.5-13.2) 9 4.0% (1.4-6.6) 23 9.8% (5.9-13.7) 40 16.4% (11.6-21.1) 147 58.2%<br />
59 23.3% (17.8-28.8) 27 10.6% (6.7-14.6) 45 17.9% (12.9-22.9) 48 17.4% (12.7-22.1) 65 26.8%<br />
82 16.5% (13.1-19.9) 36 7.4% (5.0-9.8) 68 13.9% (10.7-17.1) 88 16.9% (13.6-20.3) 212 42.1%<br />
C.I.(95<br />
%) N % C.I.(95%) N % C.I.(95%)<br />
(42.2-<br />
54.8) 5 1.9% (0.2-3.7) 284 57.0% (52.4-61.5)<br />
(26.2-<br />
39.2) 11 4.7% (1.9-7.5) 209 39.4% (34.9-43.8)<br />
(37.0-<br />
46.2) 17 3.1% (1.6-4.7) 512 100.0% (_-_)<br />
(44.1-<br />
62.2) 1 0.6% (0.0-1.8) 144 31.4% (26.8-36.0)<br />
(30.6-<br />
40.8) 15 4.2% (2.1-6.3) 356 68.6% (64.0-73.2)<br />
(36.6-<br />
45.9) 16 3.1% (1.5-4.6) 500 100.0% (_-_)<br />
(38.9-<br />
51.0) 13 3.9% (1.7-6.0) 310 59.0% (54.5-63.5)<br />
(31.0-<br />
44.5) 4 2.0% (0.0-4.0) 206 41.0% (36.5-45.5)<br />
(37.4-<br />
46.6) 17 3.1% (1.6-4.6) 516 100.0% (_-_)<br />
(40.9-<br />
55.4) 5 2.2% (0.2-4.1) 218 44.9% (40.2-49.6)<br />
(30.8-<br />
42.4) 12 4.1% (1.7-6.4) 284 55.1% (50.4-59.8)<br />
(37.1-<br />
46.4) 17 3.2% (1.7-4.7) 502 100.0% (_-_)<br />
(51.9-<br />
64.6) 6 2.2% (0.4-4.1) 248 48.6% (44.0-53.3)<br />
(20.3-<br />
33.3) 10 3.9% (1.5-6.4) 254 51.4% (46.7-56.0)<br />
(37.5-<br />
46.7) 16 3.1% (1.6-4.6) 502 100.0% (_-_)
Table Q5a: My counselor was underst<strong>and</strong>ing <strong>of</strong> my needs.<br />
Q5a<br />
Strongly Disagree Somewhat Disagree<br />
91<br />
Nevada <strong>Department</strong> <strong>of</strong> <strong>Employment</strong>, <strong>Training</strong> <strong>and</strong> <strong>Rehabilitation</strong><br />
2011 General Client Satisfaction Survey<br />
Neither Agree Nor<br />
Disagree Somewhat Agree Strongly Agree Total<br />
N % C.I.(95%) N % C.I.(95%) N % C.I.(95%) N % C.I.(95%) N % C.I.(95%) N % C.I.(95%)<br />
Overall Total Total 40 7.6% (5.3-9.9) 35 6.7% (4.5-8.9) 43 8.1% (5.7-10.5) 84 17.1% (13.6-20.5) 314 60.6% (56.1-65.0) 516 100.0% (_-_)<br />
Gender Male 21 8.0% (4.7-11.4) 14 5.1% (2.4-7.7) 21 8.1% (4.7-11.5) 40 15.4% (10.9-20.0) 158 63.4% (57.2-69.6) 254 48.7% (44.1-53.3)<br />
Female 19 7.1% (3.9-10.3) 21 8.3% (4.8-11.8) 22 8.1% (4.7-11.5) 44 18.6% (13.4-23.8) 156 57.9% (51.6-64.2) 262 51.3% (46.7-55.9)<br />
Total 40 7.6% (5.3-9.9) 35 6.7% (4.5-8.9) 43 8.1% (5.7-10.5) 84 17.1% (13.6-20.5) 314 60.6% (56.1-65.0) 516 100.0% (_-_)<br />
Age
92<br />
Nevada <strong>Department</strong> <strong>of</strong> <strong>Employment</strong>, <strong>Training</strong> <strong>and</strong> <strong>Rehabilitation</strong><br />
2011 General Client Satisfaction Survey<br />
Ever received any transportation services Yes 11 4.2% (1.7-6.7) 12 5.3% (2.3-8.2) 14 6.7% (3.2-10.1) 35 16.8% (11.4-22.1) 146 67.1% (60.5-73.8) 218 44.9% (40.2-49.6)<br />
No 27 10.1% (6.4-13.8) 20 7.0% (4.0-10.1) 28 9.4% (6.0-12.9) 48 17.7% (13.0-22.4) 161 55.7% (49.7-61.7) 284 55.1% (50.4-59.8)<br />
Total 38 7.5% (5.1-9.8) 32 6.2% (4.1-8.4) 42 8.2% (5.7-10.6) 83 17.3% (13.7-20.8) 307 60.8% (56.3-65.4) 502 100.0% (_-_)<br />
Currently Employed Yes 10 3.8% (1.4-6.2) 11 4.4% (1.8-7.0) 18 7.2% (3.9-10.5) 33 13.9% (9.4-18.4) 176 70.7% (64.8-76.5) 248 48.6% (44.0-53.3)<br />
No 28 10.9% (7.0-14.9) 22 8.4% (4.9-11.8) 25 9.4% (5.7-13.0) 49 19.7% (14.5-24.9) 130 51.7% (45.0-58.3) 254 51.4% (46.7-56.0)<br />
Total 38 7.5% (5.1-9.8) 33 6.4% (4.2-8.6) 43 8.3% (5.9-10.8) 82 16.9% (13.4-20.3) 306 60.9% (56.4-65.4) 502 100.0% (_-_)
Table Q5b: My counselor was easy for me to contact.<br />
Q5b<br />
Strongly Disagree Somewhat Disagree<br />
93<br />
Nevada <strong>Department</strong> <strong>of</strong> <strong>Employment</strong>, <strong>Training</strong> <strong>and</strong> <strong>Rehabilitation</strong><br />
2011 General Client Satisfaction Survey<br />
Neither Agree Nor<br />
Disagree Somewhat Agree Strongly Agree Don't Know/Refused Total<br />
N % C.I.(95%) N % C.I.(95%) N % C.I.(95%) N % C.I.(95%) N % C.I.(95%) N % C.I.(95%) N % C.I.(95%)<br />
Overall Total Total 43 8.7% (6.1-11.3) 35 5.9% (3.9-7.8) 47 9.1% (6.5-11.7) 115 22.7% (18.9-26.5) 272 52.8% (48.2-57.3) 3 0.9% (0.0-1.9) 515 100.0% (_-_)<br />
Gender Male 25 9.9% (6.1-13.7) 15 5.7% (2.8-8.6) 19 6.9% (3.8-10.0) 54 20.9% (15.7-26.0) 140 56.2% (49.7-62.8) 1 0.4% (0.0-1.2) 254 48.8% (44.2-53.4)<br />
Female 18 7.6% (4.1-11.1) 20 6.0% (3.4-8.7) 28 11.2% (7.2-15.3) 61 24.4% (18.9-29.9) 132 49.4% (43.1-55.8) 2 1.3% (0.0-3.2) 261 51.2% (46.6-55.8)<br />
Total 43 8.7% (6.1-11.3) 35 5.9% (3.9-7.8) 47 9.1% (6.5-11.7) 115 22.7% (18.9-26.5) 272 52.8% (48.2-57.3) 3 0.9% (0.0-1.9) 515 100.0% (_-_)<br />
Age
Table Q5b: My counselor was easy for me to contact.<br />
Q5b<br />
Ever received any transportation<br />
services<br />
Strongly Disagree Somewhat Disagree<br />
94<br />
Nevada <strong>Department</strong> <strong>of</strong> <strong>Employment</strong>, <strong>Training</strong> <strong>and</strong> <strong>Rehabilitation</strong><br />
2011 General Client Satisfaction Survey<br />
Neither Agree Nor<br />
Disagree Somewhat Agree Strongly Agree Don't Know/Refused Total<br />
N % C.I.(95%) N % C.I.(95%) N % C.I.(95%) N % C.I.(95%) N % C.I.(95%) N % C.I.(95%) N % C.I.(95%)<br />
Yes 14 6.0% (2.9-9.1) 15 6.0% (2.9-9.1) 16 7.5% (3.9-11.1) 44 19.8% (14.3-25.3) 128 60.3% (53.4-67.2) 1 0.4% (0.0-1.3) 218 44.9% (40.2-49.6)<br />
No 28 11.1% (7.1-15.0) 19 5.6% (3.1-8.2) 28 9.9% (6.3-13.5) 68 24.9% (19.6-30.2) 139 47.3% (41.3-53.3) 2 1.2% (0.0-3.0) 284 55.1% (50.4-59.8)<br />
Total 42 8.8% (6.2-11.4) 34 5.8% (3.8-7.8) 44 8.8% (6.2-11.4) 112 22.6% (18.8-26.4) 267 53.1% (48.5-57.8) 3 0.9% (0.0-1.9) 502 100.0% (_-_)<br />
Currently Employed Yes 14 5.3% (2.5-8.0) 11 3.6% (1.5-5.8) 17 6.9% (3.6-10.1) 55 23.5% (17.9-29.0) 149 59.3% (53.0-65.7) 2 1.4% (0.0-3.4) 248 48.6% (44.0-53.3)<br />
No 28 12.2% (7.8-16.5) 23 7.9% (4.6-11.2) 28 10.9% (6.9-14.9) 56 21.7% (16.5-27.0) 118 46.9% (40.2-53.7) 1 0.4% (0.0-1.1) 254 51.4% (46.7-56.0)<br />
Total 42 8.8% (6.2-11.4) 34 5.8% (3.8-7.8) 45 9.0% (6.4-11.5) 111 22.6% (18.7-26.4) 267 53.0% (48.3-57.6) 3 0.9% (0.0-1.9) 502 100.0% (_-_)
Table Q5c: I was satisfied with the way my counselor treated me.<br />
Q5c<br />
Strongly Disagree Somewhat Disagree<br />
95<br />
Nevada <strong>Department</strong> <strong>of</strong> <strong>Employment</strong>, <strong>Training</strong> <strong>and</strong> <strong>Rehabilitation</strong><br />
2011 General Client Satisfaction Survey<br />
Neither Agree Nor<br />
Disagree Somewhat Agree Strongly Agree Don't Know/Refused Total<br />
N % C.I.(95%) N % C.I.(95%) N % C.I.(95%) N % C.I.(95%) N % C.I.(95%) N % C.I.(95%) N % C.I.(95%)<br />
Overall Total Total 44 8.4% (5.9-10.8) 20 3.6% (2.0-5.2) 31 5.5% (3.5-7.4) 82 17.1% (13.6-20.6) 337 65.0% (60.6-69.3) 1 0.4% (0.0-1.3) 515 100.0% (_-_)<br />
Gender Male 24 9.0% (5.5-12.6) 9 3.2% (1.1-5.3) 15 5.3% (2.6-8.1) 35 14.2% (9.8-18.7) 171 68.2% (62.3-74.2) 0 . (.-.) 254 48.8% (44.2-53.4)<br />
Female 20 7.7% (4.4-11.1) 11 4.0% (1.6-6.4) 16 5.6% (2.8-8.4) 47 19.9% (14.6-25.2) 166 61.9% (55.7-68.1) 1 0.9% (0.0-2.5) 261 51.2% (46.6-55.8)<br />
Total 44 8.4% (5.9-10.8) 20 3.6% (2.0-5.2) 31 5.5% (3.5-7.4) 82 17.1% (13.6-20.6) 337 65.0% (60.6-69.3) 1 0.4% (0.0-1.3) 515 100.0% (_-_)<br />
Age
Table Q5c: I was satisfied with the way my counselor treated me.<br />
Q5c<br />
Ever received any transportation<br />
services<br />
Strongly Disagree Somewhat Disagree<br />
96<br />
Nevada <strong>Department</strong> <strong>of</strong> <strong>Employment</strong>, <strong>Training</strong> <strong>and</strong> <strong>Rehabilitation</strong><br />
2011 General Client Satisfaction Survey<br />
Neither Agree Nor<br />
Disagree Somewhat Agree Strongly Agree Don't Know/Refused Total<br />
N % C.I.(95%) N % C.I.(95%) N % C.I.(95%) N % C.I.(95%) N % C.I.(95%) N % C.I.(95%) N % C.I.(95%)<br />
Yes 13 5.5% (2.5-8.5) 5 2.0% (0.2-3.8) 11 4.3% (1.7-6.8) 37 18.1% (12.7-23.6) 152 70.1% (63.7-76.5) 0 . (.-.) 218 44.9% (40.2-49.6)<br />
No 30 10.8% (7.1-14.6) 15 5.1% (2.5-7.7) 17 5.9% (3.1-8.8) 43 16.2% (11.7-20.8) 178 61.1% (55.2-67.0) 1 0.8% (0.0-2.4) 284 55.1% (50.4-59.8)<br />
Total 43 8.4% (5.9-10.9) 20 3.7% (2.1-5.3) 28 5.2% (3.2-7.1) 80 17.1% (13.6-20.6) 330 65.1% (60.7-69.5) 1 0.4% (0.0-1.3) 502 100.0% (_-_)<br />
Currently Employed Yes 13 4.7% (2.1-7.2) 8 3.0% (0.9-5.1) 6 2.3% (0.5-4.2) 29 12.4% (8.1-16.6) 191 76.7% (71.3-82.2) 1 0.9% (0.0-2.7) 248 48.6% (44.0-53.3)<br />
No 30 12.0% (7.9-16.2) 12 4.4% (1.9-6.9) 24 8.5% (5.0-11.9) 50 20.8% (15.5-26.1) 138 54.3% (47.7-60.9) 0 . (.-.) 254 51.4% (46.7-56.0)<br />
Total 43 8.4% (6.0-10.9) 20 3.7% (2.1-5.4) 30 5.5% (3.5-7.5) 79 16.7% (13.2-20.1) 329 65.2% (60.8-69.6) 1 0.4% (0.0-1.3) 502 100.0% (_-_)
Table Q5d: I was satisfied with the way other Vocational <strong>Rehabilitation</strong> staff, besides my counselor, treated me.<br />
Q5d<br />
Strongly Disagree Somewhat Disagree<br />
97<br />
Nevada <strong>Department</strong> <strong>of</strong> <strong>Employment</strong>, <strong>Training</strong> <strong>and</strong> <strong>Rehabilitation</strong><br />
2011 General Client Satisfaction Survey<br />
Neither Agree Nor<br />
Disagree Somewhat Agree Strongly Agree Don't Know/Refused Total<br />
N % C.I.(95%) N % C.I.(95%) N % C.I.(95%) N % C.I.(95%) N % C.I.(95%) N % C.I.(95%) N % C.I.(95%)<br />
Overall Total Total 23 4.6% (2.7-6.5) 21 3.8% (2.1-5.4) 58 11.1% (8.4-13.9) 119 23.9% (20.0-27.8) 284 55.2% (50.7-59.8) 9 1.4% (0.4-2.3) 514 100.0% (_-_)<br />
Gender Male 15 6.0% (3.0-8.9) 10 3.6% (1.4-5.9) 27 10.3% (6.5-14.1) 46 18.8% (13.7-23.8) 149 59.3% (52.9-65.8) 6 2.0% (0.3-3.6) 253 48.8% (44.1-53.4)<br />
Female 8 3.3% (0.8-5.8) 11 3.9% (1.5-6.2) 31 11.9% (7.9-16.0) 73 28.7% (22.9-34.5) 135 51.3% (45.0-57.7) 3 0.9% (0.0-1.8) 261 51.2% (46.6-55.9)<br />
Total 23 4.6% (2.7-6.5) 21 3.8% (2.1-5.4) 58 11.1% (8.4-13.9) 119 23.9% (20.0-27.8) 284 55.2% (50.7-59.8) 9 1.4% (0.4-2.3) 514 100.0% (_-_)<br />
Age
Table Q5d: I was satisfied with the way other Vocational <strong>Rehabilitation</strong> staff, besides my counselor, treated me.<br />
Q5d<br />
Ever received any transportation<br />
services<br />
Strongly Disagree Somewhat Disagree<br />
98<br />
Nevada <strong>Department</strong> <strong>of</strong> <strong>Employment</strong>, <strong>Training</strong> <strong>and</strong> <strong>Rehabilitation</strong><br />
2011 General Client Satisfaction Survey<br />
Neither Agree Nor<br />
Disagree Somewhat Agree Strongly Agree Don't Know/Refused Total<br />
N % C.I.(95%) N % C.I.(95%) N % C.I.(95%) N % C.I.(95%) N % C.I.(95%) N % C.I.(95%) N % C.I.(95%)<br />
Yes 4 1.7% (0.0-3.3) 6 2.4% (0.4-4.4) 20 9.5% (5.4-13.5) 49 22.8% (16.9-28.7) 135 62.6% (55.7-69.4) 3 1.1% (0.0-2.5) 217 44.8% (40.1-49.5)<br />
No 18 6.9% (3.7-10.1) 14 4.8% (2.3-7.3) 34 11.9% (8.0-15.7) 69 25.5% (20.1-30.9) 143 49.3% (43.3-55.4) 6 1.7% (0.3-3.0) 284 55.2% (50.5-59.9)<br />
Total 22 4.5% (2.6-6.5) 20 3.7% (2.1-5.3) 54 10.8% (8.0-13.6) 118 24.3% (20.3-28.2) 278 55.3% (50.6-59.9) 9 1.4% (0.5-2.4) 501 100.0% (_-_)<br />
Currently Employed Yes 10 4.2% (1.6-6.8) 5 1.7% (0.2-3.2) 20 8.2% (4.7-11.7) 52 22.5% (16.9-28.0) 157 62.2% (55.9-68.5) 4 1.3% (0.0-2.6) 248 48.7% (44.1-53.4)<br />
No 12 4.9% (2.0-7.8) 15 5.6% (2.8-8.5) 36 13.9% (9.5-18.3) 65 25.2% (19.6-30.8) 120 48.8% (42.1-55.5) 5 1.5% (0.1-2.9) 253 51.3% (46.6-55.9)<br />
Total 22 4.6% (2.6-6.5) 20 3.7% (2.1-5.4) 56 11.1% (8.3-13.9) 117 23.9% (20.0-27.8) 277 55.3% (50.7-59.9) 9 1.4% (0.5-2.4) 501 100.0% (_-_)
Table Q5e: I was satisfied with the amount <strong>of</strong> access I had to my counselor.<br />
Q5e<br />
Strongly Disagree Somewhat Disagree<br />
99<br />
Nevada <strong>Department</strong> <strong>of</strong> <strong>Employment</strong>, <strong>Training</strong> <strong>and</strong> <strong>Rehabilitation</strong><br />
2011 General Client Satisfaction Survey<br />
Neither Agree Nor<br />
Disagree Somewhat Agree Strongly Agree Total<br />
N % C.I.(95%) N % C.I.(95%) N % C.I.(95%) N % C.I.(95%) N % C.I.(95%) N % C.I.(95%)<br />
Overall Total Total 43 8.5% (6.0-11.0) 28 4.9% (3.0-6.7) 60 11.1% (8.3-13.8) 111 22.5% (18.7-26.3) 273 53.1% (48.5-57.7) 515 100.0% (_-_)<br />
Gender Male 23 8.5% (5.1-11.9) 13 4.9% (2.2-7.5) 28 10.4% (6.6-14.2) 54 21.6% (16.3-26.8) 136 54.7% (48.1-61.3) 254 48.8% (44.2-53.4)<br />
Female 20 8.5% (4.8-12.2) 15 4.8% (2.3-7.4) 32 11.7% (7.8-15.7) 57 23.3% (17.9-28.8) 137 51.6% (45.2-57.9) 261 51.2% (46.6-55.8)<br />
Total 43 8.5% (6.0-11.0) 28 4.9% (3.0-6.7) 60 11.1% (8.3-13.8) 111 22.5% (18.7-26.3) 273 53.1% (48.5-57.7) 515 100.0% (_-_)<br />
Age
Table Q5e: I was satisfied with the amount <strong>of</strong> access I had to my counselor.<br />
Q5e<br />
Strongly Disagree Somewhat Disagree<br />
100<br />
Nevada <strong>Department</strong> <strong>of</strong> <strong>Employment</strong>, <strong>Training</strong> <strong>and</strong> <strong>Rehabilitation</strong><br />
2011 General Client Satisfaction Survey<br />
Neither Agree Nor<br />
Disagree Somewhat Agree Strongly Agree Total<br />
N % C.I.(95%) N % C.I.(95%) N % C.I.(95%) N % C.I.(95%) N % C.I.(95%) N % C.I.(95%)<br />
Ever received any transportation services Yes 14 5.9% (2.8-9.0) 7 2.9% (0.7-5.2) 24 10.3% (6.2-14.3) 41 19.6% (14.0-25.2) 132 61.3% (54.4-68.2) 218 44.9% (40.2-49.6)<br />
No 29 11.0% (7.1-15.0) 19 6.1% (3.3-8.8) 33 11.4% (7.6-15.2) 68 25.0% (19.7-30.3) 135 46.5% (40.5-52.5) 284 55.1% (50.4-59.8)<br />
Total 43 8.7% (6.1-11.3) 26 4.7% (2.9-6.5) 57 10.9% (8.1-13.7) 109 22.6% (18.7-26.4) 267 53.1% (48.5-57.8) 502 100.0% (_-_)<br />
Currently Employed Yes 12 4.7% (2.0-7.3) 8 2.7% (0.8-4.6) 22 8.8% (5.2-12.4) 51 21.8% (16.4-27.2) 155 62.0% (55.8-68.3) 248 48.6% (44.0-53.3)<br />
No 31 12.6% (8.2-17.0) 18 6.6% (3.5-9.6) 36 13.2% (9.0-17.4) 56 22.3% (17.0-27.7) 113 45.3% (38.6-52.1) 254 51.4% (46.7-56.0)<br />
Total 43 8.7% (6.1-11.3) 26 4.7% (2.9-6.5) 58 11.0% (8.3-13.8) 107 22.1% (18.3-25.9) 268 53.4% (48.8-58.1) 502 100.0% (_-_)
Table Q5f: My counselor treated me with respect during the vocational rehabilitation process.<br />
Q5f<br />
Strongly Disagree Somewhat Disagree<br />
101<br />
Nevada <strong>Department</strong> <strong>of</strong> <strong>Employment</strong>, <strong>Training</strong> <strong>and</strong> <strong>Rehabilitation</strong><br />
2011 General Client Satisfaction Survey<br />
Neither Agree Nor<br />
Disagree Somewhat Agree Strongly Agree Don't Know/Refused Total<br />
N % C.I.(95%) N % C.I.(95%) N % C.I.(95%) N % C.I.(95%) N % C.I.(95%) N % C.I.(95%) N % C.I.(95%)<br />
Overall Total Total 24 4.9% (2.9-6.9) 19 3.3% (1.8-4.8) 34 6.5% (4.3-8.6) 73 14.6% (11.4-17.8) 363 70.5% (66.4-74.7) 1 0.2% (0.0-0.6) 514 100.0% (_-_)<br />
Gender Male 13 5.2% (2.4-8.0) 11 3.7% (1.5-5.8) 17 6.5% (3.4-9.6) 32 12.6% (8.4-16.8) 180 71.6% (65.9-77.4) 1 0.4% (0.0-1.2) 254 48.9% (44.3-53.5)<br />
Female 11 4.6% (1.9-7.4) 8 3.0% (0.9-5.1) 17 6.4% (3.4-9.5) 41 16.4% (11.6-21.3) 183 69.5% (63.6-75.4) 0 . (.-.) 260 51.1% (46.5-55.7)<br />
Total 24 4.9% (2.9-6.9) 19 3.3% (1.8-4.8) 34 6.5% (4.3-8.6) 73 14.6% (11.4-17.8) 363 70.5% (66.4-74.7) 1 0.2% (0.0-0.6) 514 100.0% (_-_)<br />
Age
Table Q5f: My counselor treated me with respect during the vocational rehabilitation process.<br />
Q5f<br />
Ever received any transportation<br />
services<br />
Strongly Disagree Somewhat Disagree<br />
102<br />
Nevada <strong>Department</strong> <strong>of</strong> <strong>Employment</strong>, <strong>Training</strong> <strong>and</strong> <strong>Rehabilitation</strong><br />
2011 General Client Satisfaction Survey<br />
Neither Agree Nor<br />
Disagree Somewhat Agree Strongly Agree Don't Know/Refused Total<br />
N % C.I.(95%) N % C.I.(95%) N % C.I.(95%) N % C.I.(95%) N % C.I.(95%) N % C.I.(95%) N % C.I.(95%)<br />
Yes 5 2.2% (0.2-4.2) 8 3.2% (1.0-5.4) 13 5.3% (2.4-8.3) 28 12.9% (8.3-17.5) 164 76.4% (70.5-82.2) 0 . (.-.) 218 45.0% (40.3-49.7)<br />
No 19 7.3% (4.1-10.6) 10 3.3% (1.2-5.4) 19 7.2% (4.0-10.3) 43 15.8% (11.3-20.4) 191 66.0% (60.2-71.8) 1 0.4% (0.0-1.1) 283 55.0% (50.3-59.7)<br />
Total 24 5.0% (3.0-7.0) 18 3.3% (1.7-4.8) 32 6.4% (4.2-8.5) 71 14.5% (11.3-17.8) 355 70.7% (66.5-74.8) 1 0.2% (0.0-0.6) 501 100.0% (_-_)<br />
Currently Employed Yes 7 2.6% (0.7-4.6) 7 2.7% (0.7-4.7) 7 2.9% (0.7-5.1) 28 11.4% (7.3-15.5) 199 80.3% (75.2-85.4) 0 . (.-.) 248 48.7% (44.1-53.4)<br />
No 17 7.3% (3.9-10.7) 11 3.8% (1.5-6.1) 26 9.9% (6.1-13.6) 44 17.9% (12.8-22.9) 154 60.8% (54.3-67.2) 1 0.4% (0.0-1.1) 253 51.3% (46.6-55.9)<br />
Total 24 5.0% (3.0-7.0) 18 3.3% (1.7-4.8) 33 6.5% (4.3-8.7) 72 14.7% (11.4-18.0) 353 70.3% (66.1-74.5) 1 0.2% (0.0-0.6) 501 100.0% (_-_)
Table Q5g: I was able to choose the kind <strong>of</strong> help that I received.<br />
Q5g<br />
Strongly Disagree Somewhat Disagree<br />
103<br />
Nevada <strong>Department</strong> <strong>of</strong> <strong>Employment</strong>, <strong>Training</strong> <strong>and</strong> <strong>Rehabilitation</strong><br />
2011 General Client Satisfaction Survey<br />
Neither Agree Nor<br />
Disagree Somewhat Agree Strongly Agree Don't Know/Refused Total<br />
N % C.I.(95%) N % C.I.(95%) N % C.I.(95%) N % C.I.(95%) N % C.I.(95%) N % C.I.(95%) N % C.I.(95%)<br />
Overall Total Total 60 11.7% (8.7-14.6) 35 6.4% (4.3-8.5) 57 11.1% (8.3-13.9) 97 19.1% (15.5-22.6) 256 50.1% (45.5-54.8) 9 1.6% (0.5-2.6) 514 100.0% (_-_)<br />
Gender Male 32 11.8% (7.8-15.8) 15 5.6% (2.8-8.4) 29 11.6% (7.6-15.7) 40 16.0% (11.2-20.7) 131 53.2% (46.6-59.8) 6 1.8% (0.3-3.3) 253 48.7% (44.1-53.3)<br />
Female 28 11.5% (7.3-15.8) 20 7.2% (4.1-10.4) 28 10.7% (6.8-14.5) 57 22.0% (16.7-27.3) 125 47.3% (41.0-53.6) 3 1.3% (0.0-2.9) 261 51.3% (46.7-55.9)<br />
Total 60 11.7% (8.7-14.6) 35 6.4% (4.3-8.5) 57 11.1% (8.3-13.9) 97 19.1% (15.5-22.6) 256 50.1% (45.5-54.8) 9 1.6% (0.5-2.6) 514 100.0% (_-_)<br />
Age
Table Q5g: I was able to choose the kind <strong>of</strong> help that I received.<br />
Q5g<br />
Ever received any assistive<br />
technology<br />
Ever received any<br />
transportation services<br />
Strongly Disagree Somewhat Disagree<br />
104<br />
Nevada <strong>Department</strong> <strong>of</strong> <strong>Employment</strong>, <strong>Training</strong> <strong>and</strong> <strong>Rehabilitation</strong><br />
2011 General Client Satisfaction Survey<br />
Neither Agree Nor<br />
Disagree Somewhat Agree Strongly Agree Don't Know/Refused Total<br />
N % C.I.(95%) N % C.I.(95%) N % C.I.(95%) N % C.I.(95%) N % C.I.(95%) N % C.I.(95%) N % C.I.(95%)<br />
Yes 28 8.1% (5.1-11.1) 18 5.7% (3.0-8.3) 36 11.7% (8.0-15.4) 54 17.9% (13.3-22.5) 168 55.2% (49.2-61.2) 6 1.5% (0.3-2.7) 310 59.3% (54.8-63.8)<br />
No 32 16.8% (11.3-22.3) 17 7.5% (4.0-11.1) 21 10.4% (6.1-14.6) 43 20.8% (15.1-26.5) 88 42.8% (35.8-49.8) 3 1.7% (0.0-3.7) 204 40.7% (36.2-45.2)<br />
Total 60 11.7% (8.7-14.6) 35 6.4% (4.3-8.5) 57 11.1% (8.3-13.9) 97 19.1% (15.5-22.6) 256 50.1% (45.5-54.8) 9 1.6% (0.5-2.6) 514 100.0% (_-_)<br />
Yes 14 6.3% (2.9-9.7) 13 5.5% (2.5-8.5) 30 13.2% (8.6-17.8) 38 17.9% (12.5-23.3) 122 56.9% (49.8-64.0) 1 0.3% (0.0-0.8) 218 44.9% (40.2-49.6)<br />
No 44 15.9% (11.4-20.5) 20 6.9% (3.9-9.9) 26 9.7% (6.1-13.3) 58 20.3% (15.5-25.2) 128 44.5% (38.5-50.4) 8 2.7% (0.7-4.7) 284 55.1% (50.4-59.8)<br />
Total 58 11.6% (8.6-14.6) 33 6.2% (4.1-8.4) 56 11.3% (8.4-14.1) 96 19.2% (15.6-22.9) 250 50.0% (45.4-54.7) 9 1.6% (0.5-2.7) 502 100.0% (_-_)<br />
Currently Employed Yes 16 6.0% (3.0-8.9) 9 3.7% (1.3-6.0) 24 9.8% (6.0-13.6) 39 15.9% (11.1-20.8) 158 64.0% (57.8-70.2) 2 0.6% (0.0-1.5) 248 48.6% (44.0-53.3)<br />
No 42 17.0% (12.0-22.0) 25 9.1% (5.5-12.6) 33 13.0% (8.7-17.3) 55 21.1% (15.9-26.3) 92 37.3% (30.6-44.0) 7 2.5% (0.5-4.5) 254 51.4% (46.7-56.0)<br />
Total 58 11.6% (8.7-14.6) 34 6.4% (4.3-8.6) 57 11.4% (8.6-14.3) 94 18.6% (15.1-22.2) 250 50.3% (45.7-55.0) 9 1.6% (0.5-2.7) 502 100.0% (_-_)
Table Q5h: I was satisfied overall with the services that I received.<br />
Q5h<br />
Strongly Disagree Somewhat Disagree<br />
105<br />
Nevada <strong>Department</strong> <strong>of</strong> <strong>Employment</strong>, <strong>Training</strong> <strong>and</strong> <strong>Rehabilitation</strong><br />
2011 General Client Satisfaction Survey<br />
Neither Agree Nor<br />
Disagree Somewhat Agree Strongly Agree Don't Know/Refused Total<br />
N % C.I.(95%) N % C.I.(95%) N % C.I.(95%) N % C.I.(95%) N % C.I.(95%) N % C.I.(95%) N % C.I.(95%)<br />
Overall Total Total 55 10.8% (8.0-13.6) 38 7.3% (5.0-9.6) 48 9.2% (6.6-11.7) 82 16.1% (12.8-19.5) 289 56.3% (51.8-60.9) 1 0.2% (0.0-0.6) 513 100.0% (_-_)<br />
Gender Male 28 10.8% (6.9-14.6) 21 7.8% (4.5-11.1) 20 7.6% (4.3-10.9) 36 14.5% (9.9-19.0) 146 59.0% (52.5-65.4) 1 0.4% (0.0-1.2) 252 48.7% (44.1-53.3)<br />
Female 27 10.9% (6.8-15.0) 17 6.8% (3.6-10.1) 28 10.7% (6.8-14.6) 46 17.7% (12.8-22.6) 143 53.9% (47.5-60.2) 0 . (.-.) 261 51.3% (46.7-55.9)<br />
Total 55 10.8% (8.0-13.6) 38 7.3% (5.0-9.6) 48 9.2% (6.6-11.7) 82 16.1% (12.8-19.5) 289 56.3% (51.8-60.9) 1 0.2% (0.0-0.6) 513 100.0% (_-_)<br />
Age
Table Q5h: I was satisfied overall with the services that I received.<br />
Q5h<br />
Ever received any assistive<br />
technology<br />
Ever received any transportation<br />
services<br />
Strongly Disagree Somewhat Disagree<br />
106<br />
Nevada <strong>Department</strong> <strong>of</strong> <strong>Employment</strong>, <strong>Training</strong> <strong>and</strong> <strong>Rehabilitation</strong><br />
2011 General Client Satisfaction Survey<br />
Neither Agree Nor<br />
Disagree Somewhat Agree Strongly Agree Don't Know/Refused Total<br />
N % C.I.(95%) N % C.I.(95%) N % C.I.(95%) N % C.I.(95%) N % C.I.(95%) N % C.I.(95%) N % C.I.(95%)<br />
Yes 22 6.8% (3.9-9.6) 23 7.5% (4.4-10.5) 30 9.1% (5.9-12.4) 47 15.2% (10.9-19.4) 186 61.1% (55.3-66.9) 1 0.3% (0.0-1.0) 309 59.2% (54.7-63.7)<br />
No 33 16.7% (11.3-22.1) 15 7.1% (3.5-10.7) 18 9.2% (5.1-13.4) 35 17.5% (12.1-23.0) 103 49.4% (42.3-56.5) 0 . (.-.) 204 40.8% (36.3-45.3)<br />
Total 55 10.8% (8.0-13.6) 38 7.3% (5.0-9.6) 48 9.2% (6.6-11.7) 82 16.1% (12.8-19.5) 289 56.3% (51.8-60.9) 1 0.2% (0.0-0.6) 513 100.0% (_-_)<br />
Yes 14 5.9% (2.9-9.0) 14 6.3% (3.0-9.6) 20 8.5% (4.8-12.2) 36 16.4% (11.2-21.6) 134 62.9% (56.1-69.8) 0 . (.-.) 218 44.9% (40.3-49.6)<br />
No 40 15.0% (10.6-19.5) 22 7.8% (4.6-11.0) 26 9.6% (6.0-13.2) 45 16.1% (11.7-20.6) 149 51.1% (45.0-57.1) 1 0.4% (0.0-1.1) 283 55.1% (50.4-59.7)<br />
Total 54 10.9% (8.1-13.8) 36 7.1% (4.8-9.5) 46 9.1% (6.5-11.7) 81 16.2% (12.9-19.6) 283 56.4% (51.8-61.0) 1 0.2% (0.0-0.6) 501 100.0% (_-_)<br />
Currently Employed Yes 16 6.3% (3.2-9.3) 10 4.0% (1.5-6.4) 15 5.9% (2.9-8.8) 35 14.5% (9.9-19.1) 172 69.4% (63.5-75.3) 0 . (.-.) 248 48.7% (44.0-53.3)<br />
No 38 15.4% (10.7-20.1) 27 10.5% (6.6-14.4) 32 12.4% (8.2-16.6) 45 17.1% (12.3-21.9) 110 44.2% (37.4-51.0) 1 0.4% (0.0-1.1) 253 51.3% (46.7-56.0)<br />
Total 54 11.0% (8.1-13.8) 37 7.3% (5.0-9.7) 47 9.2% (6.6-11.8) 80 15.8% (12.5-19.1) 282 56.5% (51.9-61.0) 1 0.2% (0.0-0.6) 501 100.0% (_-_)
Table Q5i: I would recommend Nevada’s Vocational <strong>Rehabilitation</strong> services to others if they needed the services.<br />
Q5i<br />
Strongly Disagree Somewhat Disagree<br />
107<br />
Nevada <strong>Department</strong> <strong>of</strong> <strong>Employment</strong>, <strong>Training</strong> <strong>and</strong> <strong>Rehabilitation</strong><br />
2011 General Client Satisfaction Survey<br />
Neither Agree Nor<br />
Disagree Somewhat Agree Strongly Agree Don't Know/Refused Total<br />
N % C.I.(95%) N % C.I.(95%) N % C.I.(95%) N % C.I.(95%) N % C.I.(95%) N % C.I.(95%) N % C.I.(95%)<br />
Overall Total Total 51 10.1% (7.3-12.8) 18 3.5% (1.9-5.1) 31 5.6% (3.6-7.7) 53 10.3% (7.5-13.1) 358 70.2% (66.1-74.4) 2 0.3% (0.0-0.8) 513 100.0% (_-_)<br />
Gender Male 22 8.1% (4.8-11.5) 9 3.3% (1.1-5.5) 15 5.6% (2.8-8.4) 23 8.5% (5.1-12.0) 183 74.0% (68.5-79.5) 1 0.4% (0.0-1.2) 253 48.8% (44.2-53.4)<br />
Female 29 11.9% (7.7-16.2) 9 3.6% (1.2-5.9) 16 5.7% (2.9-8.5) 30 12.0% (7.7-16.2) 175 66.6% (60.5-72.6) 1 0.3% (0.0-0.8) 260 51.2% (46.6-55.8)<br />
Total 51 10.1% (7.3-12.8) 18 3.5% (1.9-5.1) 31 5.6% (3.6-7.7) 53 10.3% (7.5-13.1) 358 70.2% (66.1-74.4) 2 0.3% (0.0-0.8) 513 100.0% (_-_)<br />
Age
Table Q5i: I would recommend Nevada’s Vocational <strong>Rehabilitation</strong> services to others if they needed the services.<br />
Q5i<br />
Ever received any transportation<br />
services<br />
Strongly Disagree Somewhat Disagree<br />
108<br />
Nevada <strong>Department</strong> <strong>of</strong> <strong>Employment</strong>, <strong>Training</strong> <strong>and</strong> <strong>Rehabilitation</strong><br />
2011 General Client Satisfaction Survey<br />
Neither Agree Nor<br />
Disagree Somewhat Agree Strongly Agree Don't Know/Refused Total<br />
N % C.I.(95%) N % C.I.(95%) N % C.I.(95%) N % C.I.(95%) N % C.I.(95%) N % C.I.(95%) N % C.I.(95%)<br />
Yes 15 6.8% (3.4-10.1) 4 1.8% (0.0-3.5) 12 5.0% (2.1-7.8) 22 9.7% (5.6-13.8) 165 76.8% (71.0-82.6) 0 . (.-.) 218 44.9% (40.2-49.6)<br />
No 36 13.2% (9.0-17.4) 12 4.3% (1.9-6.8) 17 6.0% (3.1-8.8) 31 11.2% (7.3-15.0) 186 64.8% (59.0-70.6) 2 0.6% (0.0-1.5) 284 55.1% (50.4-59.8)<br />
Total 51 10.3% (7.5-13.1) 16 3.2% (1.6-4.7) 29 5.5% (3.5-7.5) 53 10.5% (7.7-13.3) 351 70.2% (66.0-74.4) 2 0.3% (0.0-0.8) 502 100.0% (_-_)<br />
Currently Employed Yes 17 6.6% (3.5-9.7) 6 2.5% (0.5-4.5) 6 2.5% (0.5-4.5) 26 10.9% (6.7-15.0) 192 77.2% (71.8-82.7) 1 0.3% (0.0-0.8) 248 48.6% (44.0-53.3)<br />
No 34 13.8% (9.3-18.4) 11 4.1% (1.6-6.6) 24 8.6% (5.2-12.1) 26 9.4% (5.8-12.9) 158 63.7% (57.4-69.9) 1 0.4% (0.0-1.1) 254 51.4% (46.7-56.0)<br />
Total 51 10.3% (7.5-13.1) 17 3.3% (1.7-5.0) 30 5.6% (3.6-7.7) 52 10.1% (7.4-12.8) 350 70.3% (66.1-74.4) 2 0.3% (0.0-0.8) 502 100.0% (_-_)
109<br />
Nevada <strong>Department</strong> <strong>of</strong> <strong>Employment</strong>, <strong>Training</strong> <strong>and</strong> <strong>Rehabilitation</strong><br />
2011 General Client Satisfaction Survey<br />
Table Q6a: Have you ever received any counselor-based assessment services from the vocational rehabilitation program?<br />
Q6a<br />
Yes No Don't Know/Refused Total<br />
N % C.I.(95%) N % C.I.(95%) N % C.I.(95%) N % C.I.(95%)<br />
Overall Total Total 284 57.0% (52.4-61.5) 209 39.4% (34.9-43.8) 19 3.7% (2.0-5.3) 512 100.0% (_-_)<br />
Gender Male 141 58.2% (51.8-64.7) 104 38.8% (32.5-45.1) 8 3.0% (0.9-5.1) 253 48.9% (44.3-53.5)<br />
Female 143 55.7% (49.4-62.1) 105 40.0% (33.7-46.2) 11 4.3% (1.7-6.9) 259 51.1% (46.5-55.7)<br />
Total 284 57.0% (52.4-61.5) 209 39.4% (34.9-43.8) 19 3.7% (2.0-5.3) 512 100.0% (_-_)<br />
Age
110<br />
Nevada <strong>Department</strong> <strong>of</strong> <strong>Employment</strong>, <strong>Training</strong> <strong>and</strong> <strong>Rehabilitation</strong><br />
2011 General Client Satisfaction Survey<br />
Table Q6a: Have you ever received any counselor-based assessment services from the vocational rehabilitation program?<br />
Q6a<br />
Yes No Don't Know/Refused Total<br />
N % C.I.(95%) N % C.I.(95%) N % C.I.(95%) N % C.I.(95%)<br />
Ever received any transportation services Yes 151 69.8% (63.4-76.2) 57 25.7% (19.6-31.8) 10 4.5% (1.7-7.2) 218 44.9% (40.2-49.6)<br />
No 129 47.0% (41.0-53.1) 147 50.2% (44.2-56.2) 8 2.8% (0.7-4.8) 284 55.1% (50.4-59.8)<br />
Total 280 57.2% (52.7-61.8) 204 39.2% (34.7-43.7) 18 3.5% (1.9-5.2) 502 100.0% (_-_)<br />
Currently Employed Yes 151 62.1% (55.9-68.4) 92 35.6% (29.4-41.7) 5 2.3% (0.3-4.3) 248 48.6% (44.0-53.3)<br />
No 129 52.4% (45.8-59.1) 111 42.5% (35.9-49.0) 14 5.1% (2.4-7.8) 254 51.4% (46.7-56.0)<br />
Total 280 57.2% (52.6-61.7) 203 39.1% (34.6-43.6) 19 3.7% (2.0-5.5) 502 100.0% (_-_)
Table Q6b: How would you rate the quality <strong>of</strong> those counselor-based assessment services?<br />
Q6b<br />
Overall Total Total<br />
Gender Male<br />
Age
Table Q6b: How would you rate the quality <strong>of</strong> those counselor-based assessment services?<br />
Q6b<br />
112<br />
Nevada <strong>Department</strong> <strong>of</strong> <strong>Employment</strong>, <strong>Training</strong> <strong>and</strong> <strong>Rehabilitation</strong><br />
2011 General Client Satisfaction Survey<br />
Poor Fair Good Excellent Don't Know/Refused Total<br />
N % C.I.(95%) N % C.I.(95%) N % C.I.(95%) N % C.I.(95%) N % C.I.(95%) N % C.I.(95%)<br />
Ever received any assistive technology Yes 7 4.0% (0.8-7.2) 22 10.9% (6.4-15.5) 74 43.1% (34.9-51.3) 80 41.1% (33.4-48.7) 2 0.9% (0.0-2.2) 185 65.2% (59.3-71.1)<br />
No 8 7.4% (2.3-12.4) 12 12.2% (5.6-18.8) 36 37.8% (27.9-47.8) 41 42.5% (32.4-52.7) 0 . (.-.) 97 34.8% (28.9-40.7)<br />
Total 15 5.2% (2.4-7.9) 34 11.4% (7.6-15.1) 110 41.3% (34.9-47.7) 121 41.6% (35.5-47.7) 2 0.6% (0.0-1.4) 282 100.0% (_-_)<br />
Ever received any transportation services Yes 7 4.8% (1.0-8.7) 11 7.2% (3.0-11.4) 66 46.0% (36.9-55.1) 65 41.5% (32.9-50.1) 1 0.5% (0.0-1.4) 150 54.5% (48.2-60.8)<br />
No 7 5.1% (1.3-8.8) 23 16.6% (10.2-23.1) 44 36.5% (27.8-45.3) 55 41.8% (33.0-50.5) 0 . (.-.) 129 45.5% (39.2-51.8)<br />
Total 14 4.9% (2.2-7.6) 34 11.5% (7.7-15.3) 110 41.7% (35.2-48.1) 120 41.6% (35.5-47.8) 1 0.3% (0.0-0.8) 279 100.0% (_-_)<br />
Currently Employed Yes 4 2.5% (0.1-5.0) 16 10.9% (5.7-16.1) 60 41.3% (33.1-49.5) 70 45.3% (37.1-53.6) 0 . (.-.) 150 52.6% (46.3-59.0)<br />
No 10 6.6% (2.5-10.7) 18 12.3% (6.7-17.9) 50 42.5% (32.5-52.5) 50 38.1% (28.9-47.2) 1 0.5% (0.0-1.6) 129 47.4% (41.0-53.7)<br />
Total 14 4.5% (2.1-6.8) 34 11.5% (7.7-15.3) 110 41.9% (35.4-48.3) 120 41.9% (35.7-48.1) 1 0.3% (0.0-0.8) 279 100.0% (_-_)
113<br />
Nevada <strong>Department</strong> <strong>of</strong> <strong>Employment</strong>, <strong>Training</strong> <strong>and</strong> <strong>Rehabilitation</strong><br />
2011 General Client Satisfaction Survey<br />
Table Q7a: Have you ever received any community-based assessment services from the vocational rehabilitation program?<br />
Q7a<br />
Yes No Don't Know/Refused Total<br />
N % C.I.(95%) N % C.I.(95%) N % C.I.(95%) N % C.I.(95%)<br />
Overall Total Total 144 30.8% (26.3-35.3) 356 67.2% (62.7-71.8) 10 2.0% (0.7-3.2) 510 100.0% (_-_)<br />
Gender Male 62 26.7% (20.2-33.3) 185 71.2% (64.6-77.8) 5 2.1% (0.2-3.9) 252 48.9% (44.3-53.5)<br />
Female 82 34.7% (28.5-40.9) 171 63.5% (57.2-69.7) 5 1.9% (0.2-3.5) 258 51.1% (46.5-55.7)<br />
Total 144 30.8% (26.3-35.3) 356 67.2% (62.7-71.8) 10 2.0% (0.7-3.2) 510 100.0% (_-_)<br />
Age
114<br />
Nevada <strong>Department</strong> <strong>of</strong> <strong>Employment</strong>, <strong>Training</strong> <strong>and</strong> <strong>Rehabilitation</strong><br />
2011 General Client Satisfaction Survey<br />
No 64 23.9% (18.7-29.2) 217 75.1% (69.8-80.4) 3 1.0% (0.0-2.1) 284 55.1% (50.4-59.8)<br />
Total 142 30.9% (26.4-35.4) 350 67.1% (62.5-71.7) 10 2.0% (0.7-3.2) 502 100.0% (_-_)<br />
Currently Employed Yes 69 29.7% (23.7-35.7) 176 69.0% (63.0-75.1) 3 1.3% (0.0-2.7) 248 48.6% (44.0-53.3)<br />
No 73 31.5% (24.8-38.2) 174 65.8% (59.0-72.5) 7 2.7% (0.7-4.7) 254 51.4% (46.7-56.0)<br />
Total 142 30.7% (26.1-35.2) 350 67.4% (62.8-71.9) 10 2.0% (0.7-3.2) 502 100.0% (_-_)
Table Q7b: How would you rate the quality <strong>of</strong> those community-based assessment services?<br />
Q7b<br />
115<br />
Nevada <strong>Department</strong> <strong>of</strong> <strong>Employment</strong>, <strong>Training</strong> <strong>and</strong> <strong>Rehabilitation</strong><br />
2011 General Client Satisfaction Survey<br />
Poor Fair Good Excellent Total<br />
N % C.I.(95%) N % C.I.(95%) N % C.I.(95%) N % C.I.(95%) N % C.I.(95%)<br />
Overall Total Total 10 7.5% (2.7-12.2) 20 13.5% (7.7-19.2) 44 29.3% (21.4-37.3) 71 49.7% (40.5-58.9) 145 100.0% (_-_)<br />
Gender Male 6 9.2% (1.9-16.6) 6 8.9% (1.8-16.1) 19 27.8% (15.8-39.8) 31 54.0% (39.3-68.8) 62 42.2% (32.9-51.4)<br />
Female 4 6.2% (0.0-12.4) 14 16.8% (8.5-25.1) 25 30.5% (20.0-40.9) 40 46.6% (35.3-57.8) 83 57.8% (48.6-67.1)<br />
Total 10 7.5% (2.7-12.2) 20 13.5% (7.7-19.2) 44 29.3% (21.4-37.3) 71 49.7% (40.5-58.9) 145 100.0% (_-_)<br />
Age
Table Q7b: How would you rate the quality <strong>of</strong> those community-based assessment services?<br />
Q7b<br />
116<br />
Nevada <strong>Department</strong> <strong>of</strong> <strong>Employment</strong>, <strong>Training</strong> <strong>and</strong> <strong>Rehabilitation</strong><br />
2011 General Client Satisfaction Survey<br />
Poor Fair Good Excellent Total<br />
N % C.I.(95%) N % C.I.(95%) N % C.I.(95%) N % C.I.(95%) N % C.I.(95%)<br />
Ever received any community-based assessment Yes 10 7.5% (2.8-12.3) 20 13.6% (7.8-19.3) 43 28.9% (21.0-36.8) 71 50.0% (40.8-59.2) 144 99.4% (98.1-100.0)<br />
No 0 . (.-.) 0 . (.-.) 1 100.0% (100.0-100.0) 0 . (.-.) 1 0.6% (0.0-1.9)<br />
Total 10 7.5% (2.7-12.2) 20 13.5% (7.7-19.2) 44 29.3% (21.4-37.3) 71 49.7% (40.5-58.9) 145 100.0% (_-_)<br />
Ever received any assistive technology Yes 5 6.9% (0.9-12.9) 7 9.4% (2.4-16.4) 19 27.5% (15.6-39.3) 36 56.2% (42.3-70.1) 67 47.8% (38.5-57.0)<br />
No 5 8.0% (0.8-15.2) 13 17.2% (8.5-25.9) 25 31.0% (20.5-41.6) 35 43.8% (32.4-55.2) 78 52.2% (43.0-61.5)<br />
Total 10 7.5% (2.7-12.2) 20 13.5% (7.7-19.2) 44 29.3% (21.4-37.3) 71 49.7% (40.5-58.9) 145 100.0% (_-_)<br />
Ever received any transportation services Yes 3 5.0% (0.0-10.8) 11 13.0% (5.4-20.5) 23 26.2% (16.0-36.3) 42 55.9% (43.4-68.5) 79 57.6% (48.7-66.5)<br />
No 7 11.1% (3.2-19.0) 8 13.3% (4.5-22.1) 20 32.9% (20.6-45.3) 29 42.6% (30.1-55.1) 64 42.4% (33.5-51.3)<br />
Total 10 7.6% (2.8-12.4) 19 13.1% (7.4-18.8) 43 29.0% (21.1-37.0) 71 50.3% (41.1-59.5) 143 100.0% (_-_)<br />
Currently Employed Yes 4 5.4% (0.2-10.6) 6 8.8% (1.9-15.8) 24 35.9% (24.0-47.9) 35 49.9% (37.6-62.2) 69 46.8% (37.7-56.0)<br />
No 6 9.6% (1.8-17.5) 14 18.1% (8.9-27.3) 19 23.3% (13.1-33.4) 35 48.9% (35.3-62.6) 74 53.2% (44.0-62.3)<br />
Total 10 7.6% (2.8-12.5) 20 13.8% (7.9-19.6) 43 29.2% (21.2-37.2) 70 49.4% (40.1-58.6) 143 100.0% (_-_)
Table Q8a: Have you ever received any assistive technology services?<br />
Q8a<br />
117<br />
Nevada <strong>Department</strong> <strong>of</strong> <strong>Employment</strong>, <strong>Training</strong> <strong>and</strong> <strong>Rehabilitation</strong><br />
2011 General Client Satisfaction Survey<br />
Yes No Total<br />
N % C.I.(95%) N % C.I.(95%) N % C.I.(95%)<br />
Overall Total Total 310 59.0% (54.5-63.5) 206 41.0% (36.5-45.5) 516 100.0% (_-_)<br />
Gender Male 155 61.0% (54.6-67.4) 99 39.0% (32.6-45.4) 254 48.7% (44.1-53.3)<br />
Female 155 57.0% (50.7-63.3) 107 43.0% (36.7-49.3) 262 51.3% (46.7-55.9)<br />
Total 310 59.0% (54.5-63.5) 206 41.0% (36.5-45.5) 516 100.0% (_-_)<br />
Age
118<br />
Nevada <strong>Department</strong> <strong>of</strong> <strong>Employment</strong>, <strong>Training</strong> <strong>and</strong> <strong>Rehabilitation</strong><br />
2011 General Client Satisfaction Survey<br />
Ever received any transportation services Yes 145 65.2% (58.4-72.0) 73 34.8% (28.0-41.6) 218 44.9% (40.2-49.6)<br />
No 161 55.8% (49.8-61.8) 123 44.2% (38.2-50.2) 284 55.1% (50.4-59.8)<br />
Total 306 60.0% (55.5-64.5) 196 40.0% (35.5-44.5) 502 100.0% (_-_)<br />
Currently Employed Yes 163 65.2% (59.1-71.4) 85 34.8% (28.6-40.9) 248 48.6% (44.0-53.3)<br />
No 141 54.2% (47.6-60.9) 113 45.8% (39.1-52.4) 254 51.4% (46.7-56.0)<br />
Total 304 59.6% (55.0-64.1) 198 40.4% (35.9-45.0) 502 100.0% (_-_)
Table Q8aa: Have you ever received any devices to help with your hearing?<br />
Q8aa<br />
119<br />
Nevada <strong>Department</strong> <strong>of</strong> <strong>Employment</strong>, <strong>Training</strong> <strong>and</strong> <strong>Rehabilitation</strong><br />
2011 General Client Satisfaction Survey<br />
Yes No Don't Know/Refused Total<br />
N % C.I.(95%) N % C.I.(95%) N % C.I.(95%) N % C.I.(95%)<br />
Overall Total Total 83 15.0% (11.9-18.1) 425 84.7% (81.6-87.9) 1 0.2% (0.0-0.7) 509 100.0% (_-_)<br />
Gender Male 33 13.1% (8.7-17.4) 218 86.4% (82.0-90.8) 1 0.5% (0.0-1.5) 252 49.0% (44.4-53.6)<br />
Female 50 16.9% (12.3-21.4) 207 83.1% (78.6-87.7) 0 . (.-.) 257 51.0% (46.4-55.6)<br />
Total 83 15.0% (11.9-18.1) 425 84.7% (81.6-87.9) 1 0.2% (0.0-0.7) 509 100.0% (_-_)<br />
Age
Table Q8aa: Have you ever received any devices to help with your hearing?<br />
Q8aa<br />
120<br />
Nevada <strong>Department</strong> <strong>of</strong> <strong>Employment</strong>, <strong>Training</strong> <strong>and</strong> <strong>Rehabilitation</strong><br />
2011 General Client Satisfaction Survey<br />
Yes No Don't Know/Refused Total<br />
N % C.I.(95%) N % C.I.(95%) N % C.I.(95%) N % C.I.(95%)<br />
Ever received any assistive technology Yes 83 25.2% (20.1-30.2) 225 74.4% (69.4-79.5) 1 0.4% (0.0-1.2) 309 59.7% (55.2-64.2)<br />
No 0 . (.-.) 200 100.0% (100.0-100.0) 0 . (.-.) 200 40.3% (35.8-44.8)<br />
Total 83 15.0% (11.9-18.1) 425 84.7% (81.6-87.9) 1 0.2% (0.0-0.7) 509 100.0% (_-_)<br />
Ever received any transportation services Yes 29 11.9% (7.7-16.2) 187 87.5% (83.1-91.9) 1 0.6% (0.0-1.6) 217 44.7% (40.1-49.4)<br />
No 54 17.9% (13.3-22.5) 230 82.1% (77.5-86.7) 0 . (.-.) 284 55.3% (50.6-59.9)<br />
Total 83 15.2% (12.1-18.4) 417 84.5% (81.3-87.7) 1 0.2% (0.0-0.7) 501 100.0% (_-_)<br />
Currently Employed Yes 55 21.3% (16.0-26.5) 192 78.2% (73.0-83.5) 1 0.5% (0.0-1.5) 248 48.8% (44.1-53.4)<br />
No 27 9.4% (5.8-12.9) 226 90.6% (87.1-94.2) 0 . (.-.) 253 51.2% (46.6-55.9)<br />
Total 82 15.2% (12.0-18.4) 418 84.6% (81.4-87.8) 1 0.2% (0.0-0.7) 501 100.0% (_-_)
Table Q8ab: Have you ever received any devices to help with your vision?<br />
Q8ab<br />
121<br />
Nevada <strong>Department</strong> <strong>of</strong> <strong>Employment</strong>, <strong>Training</strong> <strong>and</strong> <strong>Rehabilitation</strong><br />
2011 General Client Satisfaction Survey<br />
Yes No Total<br />
N % C.I.(95%) N % C.I.(95%) N % C.I.(95%)<br />
Overall Total Total 178 35.0% (30.5-39.5) 332 65.0% (60.5-69.5) 510 100.0% (_-_)<br />
Gender Male 86 34.1% (27.4-40.8) 166 65.9% (59.2-72.6) 252 48.9% (44.3-53.5)<br />
Female 92 35.9% (29.8-42.0) 166 64.1% (58.0-70.2) 258 51.1% (46.5-55.7)<br />
Total 178 35.0% (30.5-39.5) 332 65.0% (60.5-69.5) 510 100.0% (_-_)<br />
Age
Table Q8ab: Have you ever received any devices to help with your vision?<br />
Q8ab<br />
122<br />
Nevada <strong>Department</strong> <strong>of</strong> <strong>Employment</strong>, <strong>Training</strong> <strong>and</strong> <strong>Rehabilitation</strong><br />
2011 General Client Satisfaction Survey<br />
Yes No Total<br />
N % C.I.(95%) N % C.I.(95%) N % C.I.(95%)<br />
Ever received any community-based assessment Yes 37 28.5% (19.2-37.7) 107 71.5% (62.3-80.8) 144 31.4% (26.8-36.0)<br />
No 135 37.3% (32.1-42.5) 221 62.7% (57.5-67.9) 356 68.6% (64.0-73.2)<br />
Total 172 34.5% (30.0-39.1) 328 65.5% (60.9-70.0) 500 100.0% (_-_)<br />
Ever received any assistive technology Yes 178 58.6% (52.7-64.5) 132 41.4% (35.5-47.3) 310 59.8% (55.3-64.3)<br />
No 0 . (.-.) 200 100.0% (100.0-100.0) 200 40.2% (35.7-44.7)<br />
Total 178 35.0% (30.5-39.5) 332 65.0% (60.5-69.5) 510 100.0% (_-_)<br />
Ever received any transportation services Yes 83 37.5% (30.2-44.8) 135 62.5% (55.2-69.8) 218 44.9% (40.2-49.6)<br />
No 93 33.3% (27.6-39.1) 191 66.7% (60.9-72.4) 284 55.1% (50.4-59.8)<br />
Total 176 35.2% (30.6-39.8) 326 64.8% (60.2-69.4) 502 100.0% (_-_)<br />
Currently Employed Yes 86 35.4% (29.1-41.6) 162 64.6% (58.4-70.9) 248 48.6% (44.0-53.3)<br />
No 90 35.3% (28.6-41.9) 164 64.7% (58.1-71.4) 254 51.4% (46.7-56.0)<br />
Total 176 35.3% (30.7-39.9) 326 64.7% (60.1-69.3) 502 100.0% (_-_)
Table Q8ac: Have you ever received any devices to help with getting around?<br />
Q8ac<br />
123<br />
Nevada <strong>Department</strong> <strong>of</strong> <strong>Employment</strong>, <strong>Training</strong> <strong>and</strong> <strong>Rehabilitation</strong><br />
2011 General Client Satisfaction Survey<br />
Yes No Don't Know/Refused Total<br />
N % C.I.(95%) N % C.I.(95%) N % C.I.(95%) N % C.I.(95%)<br />
Overall Total Total 114 24.1% (19.8-28.3) 393 75.7% (71.4-80.0) 1 0.2% (0.0-0.7) 508 100.0% (_-_)<br />
Gender Male 60 25.8% (19.3-32.4) 191 74.2% (67.6-80.7) 0 . (.-.) 251 48.9% (44.2-53.5)<br />
Female 54 22.4% (16.9-27.8) 202 77.2% (71.7-82.6) 1 0.5% (0.0-1.4) 257 51.1% (46.5-55.8)<br />
Total 114 24.1% (19.8-28.3) 393 75.7% (71.4-80.0) 1 0.2% (0.0-0.7) 508 100.0% (_-_)<br />
Age
Table Q8ac: Have you ever received any devices to help with getting around?<br />
Q8ac<br />
124<br />
Nevada <strong>Department</strong> <strong>of</strong> <strong>Employment</strong>, <strong>Training</strong> <strong>and</strong> <strong>Rehabilitation</strong><br />
2011 General Client Satisfaction Survey<br />
Yes No Don't Know/Refused Total<br />
N % C.I.(95%) N % C.I.(95%) N % C.I.(95%) N % C.I.(95%)<br />
Ever received any assistive technology Yes 114 40.2% (34.1-46.4) 195 59.8% (53.6-65.9) 0 . (.-.) 309 59.8% (55.3-64.3)<br />
No 0 . (.-.) 198 99.4% (98.2-100.0) 1 0.6% (0.0-1.8) 199 40.2% (35.7-44.7)<br />
Total 114 24.1% (19.8-28.3) 393 75.7% (71.4-80.0) 1 0.2% (0.0-0.7) 508 100.0% (_-_)<br />
Ever received any transportation services Yes 80 38.8% (31.4-46.2) 136 60.7% (53.3-68.1) 1 0.5% (0.0-1.6) 217 44.7% (40.1-49.4)<br />
No 32 12.1% (8.0-16.2) 252 87.9% (83.8-92.0) 0 . (.-.) 284 55.3% (50.6-59.9)<br />
Total 112 24.0% (19.7-28.3) 388 75.7% (71.4-80.0) 1 0.2% (0.0-0.7) 501 100.0% (_-_)<br />
Currently Employed Yes 52 22.1% (16.7-27.6) 195 77.3% (71.8-82.9) 1 0.5% (0.0-1.5) 248 48.8% (44.1-53.4)<br />
No 59 25.0% (18.5-31.5) 194 75.0% (68.5-81.5) 0 . (.-.) 253 51.2% (46.6-55.9)<br />
Total 111 23.6% (19.3-27.9) 389 76.1% (71.9-80.4) 1 0.2% (0.0-0.7) 501 100.0% (_-_)
125<br />
Nevada <strong>Department</strong> <strong>of</strong> <strong>Employment</strong>, <strong>Training</strong> <strong>and</strong> <strong>Rehabilitation</strong><br />
2011 General Client Satisfaction Survey<br />
Table Q8ad: Have you ever received any devices to help make your home or workplace more accessible?<br />
Q8ad<br />
Yes No Don't Know/Refused Total<br />
N % C.I.(95%) N % C.I.(95%) N % C.I.(95%) N % C.I.(95%)<br />
Overall Total Total 64 13.2% (9.5-16.8) 443 86.6% (83.0-90.2) 1 0.2% (0.0-0.7) 508 100.0% (_-_)<br />
Gender Male 40 17.5% (11.3-23.7) 210 82.0% (75.7-88.2) 1 0.5% (0.0-1.5) 251 48.9% (44.2-53.5)<br />
Female 24 9.0% (5.4-12.5) 233 91.0% (87.5-94.6) 0 . (.-.) 257 51.1% (46.5-55.8)<br />
Total 64 13.2% (9.5-16.8) 443 86.6% (83.0-90.2) 1 0.2% (0.0-0.7) 508 100.0% (_-_)<br />
Age
126<br />
Nevada <strong>Department</strong> <strong>of</strong> <strong>Employment</strong>, <strong>Training</strong> <strong>and</strong> <strong>Rehabilitation</strong><br />
2011 General Client Satisfaction Survey<br />
Table Q8ad: Have you ever received any devices to help make your home or workplace more accessible?<br />
Q8ad<br />
Yes No Don't Know/Refused Total<br />
N % C.I.(95%) N % C.I.(95%) N % C.I.(95%) N % C.I.(95%)<br />
Ever received any transportation services Yes 35 17.6% (10.8-24.3) 181 81.9% (75.1-88.7) 1 0.6% (0.0-1.6) 217 44.7% (40.1-49.4)<br />
No 27 9.3% (5.8-12.7) 257 90.7% (87.3-94.2) 0 . (.-.) 284 55.3% (50.6-59.9)<br />
Total 62 13.0% (9.3-16.6) 438 86.8% (83.1-90.4) 1 0.2% (0.0-0.7) 501 100.0% (_-_)<br />
Currently Employed Yes 35 14.2% (9.7-18.7) 212 85.3% (80.7-89.9) 1 0.5% (0.0-1.5) 248 48.8% (44.1-53.4)<br />
No 27 11.9% (6.2-17.6) 226 88.1% (82.4-93.8) 0 . (.-.) 253 51.2% (46.6-55.9)<br />
Total 62 13.0% (9.4-16.7) 438 86.7% (83.1-90.4) 1 0.2% (0.0-0.7) 501 100.0% (_-_)
Table Q8ae: Have you ever received any devices to help with your communication?<br />
Q8ae<br />
127<br />
Nevada <strong>Department</strong> <strong>of</strong> <strong>Employment</strong>, <strong>Training</strong> <strong>and</strong> <strong>Rehabilitation</strong><br />
2011 General Client Satisfaction Survey<br />
Yes No Don't Know/Refused Total<br />
N % C.I.(95%) N % C.I.(95%) N % C.I.(95%) N % C.I.(95%)<br />
Overall Total Total 30 5.9% (3.8-8.0) 476 93.9% (91.7-96.0) 1 0.2% (0.0-0.7) 507 100.0% (_-_)<br />
Gender Male 11 4.4% (1.8-6.9) 239 95.1% (92.4-97.9) 1 0.5% (0.0-1.5) 251 49.0% (44.3-53.6)<br />
Female 19 7.3% (4.0-10.7) 237 92.7% (89.3-96.0) 0 . (.-.) 256 51.0% (46.4-55.7)<br />
Total 30 5.9% (3.8-8.0) 476 93.9% (91.7-96.0) 1 0.2% (0.0-0.7) 507 100.0% (_-_)<br />
Age
Table Q8ae: Have you ever received any devices to help with your communication?<br />
Q8ae<br />
128<br />
Nevada <strong>Department</strong> <strong>of</strong> <strong>Employment</strong>, <strong>Training</strong> <strong>and</strong> <strong>Rehabilitation</strong><br />
2011 General Client Satisfaction Survey<br />
Yes No Don't Know/Refused Total<br />
N % C.I.(95%) N % C.I.(95%) N % C.I.(95%) N % C.I.(95%)<br />
Ever received any transportation services Yes 20 8.7% (4.9-12.4) 195 90.8% (86.9-94.7) 1 0.6% (0.0-1.6) 216 44.6% (39.9-49.3)<br />
No 9 3.4% (1.1-5.7) 275 96.6% (94.3-98.9) 0 . (.-.) 284 55.4% (50.7-60.1)<br />
Total 29 5.8% (3.6-7.9) 470 94.0% (91.8-96.2) 1 0.2% (0.0-0.7) 500 100.0% (_-_)<br />
Currently Employed Yes 23 9.7% (5.8-13.6) 223 89.8% (85.8-93.8) 1 0.5% (0.0-1.5) 247 48.7% (44.0-53.3)<br />
No 6 2.0% (0.4-3.7) 247 98.0% (96.3-99.6) 0 . (.-.) 253 51.3% (46.7-56.0)<br />
Total 29 5.8% (3.7-7.9) 470 94.0% (91.8-96.1) 1 0.2% (0.0-0.7) 500 100.0% (_-_)
129<br />
Nevada <strong>Department</strong> <strong>of</strong> <strong>Employment</strong>, <strong>Training</strong> <strong>and</strong> <strong>Rehabilitation</strong><br />
2011 General Client Satisfaction Survey<br />
Table Q8af: Have you ever received any devices to help with something else that was not already mentioned above?<br />
Q8af<br />
Yes No Don't Know/Refused Total<br />
N % C.I.(95%) N % C.I.(95%) N % C.I.(95%) N % C.I.(95%)<br />
Overall Total Total 28 5.1% (3.2-7.1) 476 94.2% (92.1-96.2) 3 0.7% (0.0-1.4) 507 100.0% (_-_)<br />
Gender Male 14 5.6% (2.7-8.6) 235 93.9% (90.8-96.9) 1 0.5% (0.0-1.5) 250 48.8% (44.2-53.4)<br />
Female 14 4.7% (2.2-7.1) 241 94.5% (91.8-97.2) 2 0.8% (0.0-2.0) 257 51.2% (46.6-55.8)<br />
Total 28 5.1% (3.2-7.1) 476 94.2% (92.1-96.2) 3 0.7% (0.0-1.4) 507 100.0% (_-_)<br />
Age
130<br />
Nevada <strong>Department</strong> <strong>of</strong> <strong>Employment</strong>, <strong>Training</strong> <strong>and</strong> <strong>Rehabilitation</strong><br />
2011 General Client Satisfaction Survey<br />
Table Q8af: Have you ever received any devices to help with something else that was not already mentioned above?<br />
Q8af<br />
Yes No Don't Know/Refused Total<br />
N % C.I.(95%) N % C.I.(95%) N % C.I.(95%) N % C.I.(95%)<br />
Ever received any transportation services Yes 13 5.3% (2.4-8.3) 201 93.1% (89.8-96.5) 3 1.5% (0.0-3.3) 217 44.7% (40.1-49.4)<br />
No 14 4.7% (2.2-7.2) 270 95.3% (92.8-97.8) 0 . (.-.) 284 55.3% (50.6-59.9)<br />
Total 27 5.0% (3.1-6.9) 471 94.3% (92.3-96.3) 3 0.7% (0.0-1.5) 501 100.0% (_-_)<br />
Currently Employed Yes 16 6.3% (3.3-9.4) 230 92.7% (89.4-96.0) 2 1.0% (0.0-2.4) 248 48.8% (44.1-53.4)<br />
No 11 3.8% (1.5-6.0) 241 95.8% (93.4-98.2) 1 0.4% (0.0-1.2) 253 51.2% (46.6-55.9)<br />
Total 27 5.0% (3.1-6.9) 471 94.3% (92.3-96.3) 3 0.7% (0.0-1.5) 501 100.0% (_-_)
Table Q8b: Overall, how would you rate the quality <strong>of</strong> those assistive technology DEVICES you received?<br />
Q8b<br />
131<br />
Nevada <strong>Department</strong> <strong>of</strong> <strong>Employment</strong>, <strong>Training</strong> <strong>and</strong> <strong>Rehabilitation</strong><br />
2011 General Client Satisfaction Survey<br />
Poor Fair Good Excellent Don't Know/Refused Total<br />
N % C.I.(95%) N % C.I.(95%) N % C.I.(95%) N % C.I.(95%) N % C.I.(95%) N % C.I.(95%)<br />
Overall Total Total 14 4.1% (1.9-6.3) 37 12.1% (8.3-16.0) 90 29.4% (24.0-34.8) 167 53.8% (47.8-59.8) 1 0.4% (0.0-1.2) 310 100.0% (_-_)<br />
Gender Male 10 5.8% (2.2-9.4) 19 12.0% (6.7-17.2) 41 25.7% (18.5-32.9) 86 55.4% (46.9-64.0) 1 0.8% (0.0-2.3) 158 51.4% (45.4-57.5)<br />
Female 4 2.3% (0.0-4.7) 18 12.3% (6.7-17.9) 49 33.3% (25.3-41.2) 81 52.1% (43.7-60.5) 0 . (.-.) 152 48.6% (42.5-54.6)<br />
Total 14 4.1% (1.9-6.3) 37 12.1% (8.3-16.0) 90 29.4% (24.0-34.8) 167 53.8% (47.8-59.8) 1 0.4% (0.0-1.2) 310 100.0% (_-_)<br />
Age
Table Q8b: Overall, how would you rate the quality <strong>of</strong> those assistive technology DEVICES you received?<br />
Q8b<br />
Ever received any transportation<br />
services<br />
132<br />
Nevada <strong>Department</strong> <strong>of</strong> <strong>Employment</strong>, <strong>Training</strong> <strong>and</strong> <strong>Rehabilitation</strong><br />
2011 General Client Satisfaction Survey<br />
Poor Fair Good Excellent Don't Know/Refused Total<br />
N % C.I.(95%) N % C.I.(95%) N % C.I.(95%) N % C.I.(95%) N % C.I.(95%) N % C.I.(95%)<br />
Yes 7 4.2% (1.1-7.4) 17 12.7% (6.8-18.6) 42 26.3% (19.0-33.7) 81 56.0% (47.1-64.8) 1 0.8% (0.0-2.4) 148 49.7% (43.6-55.8)<br />
No 7 4.1% (1.0-7.2) 19 11.4% (6.4-16.4) 47 32.2% (24.4-40.1) 85 51.9% (43.8-60.0) 0 . (.-.) 159 50.3% (44.2-56.4)<br />
Total 14 4.2% (2.0-6.4) 36 12.0% (8.2-15.9) 89 29.3% (23.9-34.7) 166 53.9% (47.9-60.0) 1 0.4% (0.0-1.2) 307 100.0% (_-_)<br />
Currently Employed Yes 4 2.6% (0.0-5.1) 18 11.6% (6.4-16.8) 40 26.3% (19.0-33.7) 97 59.5% (51.5-67.5) 0 . (.-.) 159 51.9% (45.7-58.0)<br />
No 10 6.0% (2.3-9.7) 18 11.6% (6.3-16.9) 48 32.7% (24.5-40.9) 68 48.5% (39.2-57.7) 1 0.9% (0.0-2.5) 146 48.1% (42.0-54.3)<br />
Total 14 4.2% (2.0-6.4) 36 11.6% (7.9-15.3) 88 29.4% (24.0-34.9) 165 54.2% (48.2-60.2) 1 0.4% (0.0-1.2) 305 100.0% (_-_)
133<br />
Nevada <strong>Department</strong> <strong>of</strong> <strong>Employment</strong>, <strong>Training</strong> <strong>and</strong> <strong>Rehabilitation</strong><br />
2011 General Client Satisfaction Survey<br />
Table Q9a: Have you ever received any transportation services from the vocational rehabilitation program?<br />
Q9a<br />
Yes No Don't Know/Refused Total<br />
N % C.I.(95%) N % C.I.(95%) N % C.I.(95%) N % C.I.(95%)<br />
Overall Total Total 218 44.5% (39.8-49.1) 284 54.6% (50.0-59.3) 5 0.9% (0.1-1.6) 507 100.0% (_-_)<br />
Gender Male 105 44.6% (37.8-51.4) 142 54.8% (48.0-61.6) 2 0.6% (0.0-1.5) 249 48.6% (43.9-53.2)<br />
Female 113 44.4% (38.1-50.8) 142 54.5% (48.2-60.8) 3 1.1% (0.0-2.3) 258 51.4% (46.8-56.1)<br />
Total 218 44.5% (39.8-49.1) 284 54.6% (50.0-59.3) 5 0.9% (0.1-1.6) 507 100.0% (_-_)<br />
Age
134<br />
Nevada <strong>Department</strong> <strong>of</strong> <strong>Employment</strong>, <strong>Training</strong> <strong>and</strong> <strong>Rehabilitation</strong><br />
2011 General Client Satisfaction Survey<br />
Table Q9a: Have you ever received any transportation services from the vocational rehabilitation program?<br />
Q9a<br />
Yes No Don't Know/Refused Total<br />
N % C.I.(95%) N % C.I.(95%) N % C.I.(95%) N % C.I.(95%)<br />
Ever received any assistive technology Yes 145 48.5% (42.4-54.6) 161 50.9% (44.9-57.0) 2 0.5% (0.0-1.3) 308 59.8% (55.3-64.3)<br />
No 73 38.5% (31.5-45.5) 123 60.1% (53.1-67.2) 3 1.4% (0.0-2.9) 199 40.2% (35.7-44.7)<br />
Total 218 44.5% (39.8-49.1) 284 54.6% (50.0-59.3) 5 0.9% (0.1-1.6) 507 100.0% (_-_)<br />
Ever received any transportation services Yes 218 100.0% (100.0-100.0) 0 . (.-.) . . . 218 44.9% (40.2-49.6)<br />
No 0 . (.-.) 284 100.0% (100.0-100.0) . . . 284 55.1% (50.4-59.8)<br />
Total 218 44.9% (40.2-49.6) 284 55.1% (50.4-59.8) . . . 502 100.0% (_-_)<br />
Currently Employed Yes 105 43.3% (36.9-49.7) 141 55.9% (49.5-62.3) 2 0.8% (0.0-2.0) 248 48.6% (44.0-53.3)<br />
No 110 45.0% (38.2-51.7) 142 54.5% (47.8-61.3) 2 0.5% (0.0-1.3) 254 51.4% (46.7-56.0)<br />
Total 215 44.2% (39.5-48.8) 283 55.2% (50.5-59.8) 4 0.7% (0.0-1.3) 502 100.0% (_-_)
Table Q9b: How would you rate the quality <strong>of</strong> those transportation services?<br />
Q9b<br />
135<br />
Nevada <strong>Department</strong> <strong>of</strong> <strong>Employment</strong>, <strong>Training</strong> <strong>and</strong> <strong>Rehabilitation</strong><br />
2011 General Client Satisfaction Survey<br />
Poor Fair Good Excellent Total<br />
N % C.I.(95%) N % C.I.(95%) N % C.I.(95%) N % C.I.(95%) N % C.I.(95%)<br />
Overall Total Total 6 2.5% (0.5-4.5) 23 10.6% (6.3-15.0) 71 31.1% (24.7-37.6) 118 55.7% (48.6-62.9) 218 100.0% (_-_)<br />
Gender Male 2 1.9% (0.0-4.5) 13 12.2% (5.7-18.6) 32 27.1% (18.2-35.9) 58 58.9% (48.5-69.3) 105 48.7% (41.3-56.0)<br />
Female 4 3.1% (0.0-6.2) 10 9.2% (3.3-15.1) 39 35.0% (25.8-44.1) 60 52.8% (43.2-62.4) 113 51.3% (44.0-58.7)<br />
Total 6 2.5% (0.5-4.5) 23 10.6% (6.3-15.0) 71 31.1% (24.7-37.6) 118 55.7% (48.6-62.9) 218 100.0% (_-_)<br />
Age
Table Q9b: How would you rate the quality <strong>of</strong> those transportation services?<br />
Q9b<br />
136<br />
Nevada <strong>Department</strong> <strong>of</strong> <strong>Employment</strong>, <strong>Training</strong> <strong>and</strong> <strong>Rehabilitation</strong><br />
2011 General Client Satisfaction Survey<br />
Poor Fair Good Excellent Total<br />
N % C.I.(95%) N % C.I.(95%) N % C.I.(95%) N % C.I.(95%) N % C.I.(95%)<br />
Ever received any assistive technology Yes 2 1.2% (0.0-2.9) 13 9.4% (4.1-14.6) 47 30.5% (22.5-38.4) 83 59.0% (50.1-67.8) 145 65.2% (58.4-72.1)<br />
No 4 4.9% (0.1-9.8) 10 13.0% (5.3-20.7) 24 32.3% (21.4-43.3) 35 49.7% (37.8-61.6) 73 34.8% (27.9-41.6)<br />
Total 6 2.5% (0.5-4.5) 23 10.6% (6.3-15.0) 71 31.1% (24.7-37.6) 118 55.7% (48.6-62.9) 218 100.0% (_-_)<br />
Ever received any transportation services Yes 6 2.5% (0.5-4.5) 23 10.6% (6.3-15.0) 71 31.1% (24.7-37.6) 118 55.7% (48.6-62.9) 218 100.0% (_-_)<br />
Currently Employed Yes 3 2.5% (0.0-5.3) 8 8.1% (2.7-13.6) 30 28.4% (19.5-37.2) 64 61.0% (51.4-70.6) 105 47.7% (40.4-55.0)<br />
No 3 2.6% (0.0-5.6) 14 11.3% (5.4-17.2) 39 33.0% (23.6-42.5) 54 53.0% (42.4-63.6) 110 52.3% (45.0-59.6)<br />
Total 6 2.6% (0.5-4.6) 22 9.8% (5.8-13.9) 69 30.8% (24.3-37.3) 118 56.8% (49.7-64.0) 215 100.0% (_-_)
137<br />
Nevada <strong>Department</strong> <strong>of</strong> <strong>Employment</strong>, <strong>Training</strong> <strong>and</strong> <strong>Rehabilitation</strong><br />
2011 General Client Satisfaction Survey<br />
Table Q10a: Have you ever received any interpreter services from the vocational rehabilitation program?<br />
Q10a<br />
Yes No Don't Know/Refused Total<br />
N % C.I.(95%) N % C.I.(95%) N % C.I.(95%) N % C.I.(95%)<br />
Overall Total Total 23 4.6% (2.7-6.5) 481 95.0% (93.1-96.9) 3 0.4% (0.0-0.9) 507 100.0% (_-_)<br />
Gender Male 11 4.6% (1.9-7.3) 237 95.2% (92.4-97.9) 1 0.2% (0.0-0.7) 249 48.6% (43.9-53.2)<br />
Female 12 4.6% (2.0-7.2) 244 94.8% (92.1-97.5) 2 0.6% (0.0-1.5) 258 51.4% (46.8-56.1)<br />
Total 23 4.6% (2.7-6.5) 481 95.0% (93.1-96.9) 3 0.4% (0.0-0.9) 507 100.0% (_-_)<br />
Age
138<br />
Nevada <strong>Department</strong> <strong>of</strong> <strong>Employment</strong>, <strong>Training</strong> <strong>and</strong> <strong>Rehabilitation</strong><br />
2011 General Client Satisfaction Survey<br />
Table Q10a: Have you ever received any interpreter services from the vocational rehabilitation program?<br />
Q10a<br />
Yes No Don't Know/Refused Total<br />
N % C.I.(95%) N % C.I.(95%) N % C.I.(95%) N % C.I.(95%)<br />
Ever received any transportation services Yes 13 5.4% (2.5-8.3) 204 94.3% (91.3-97.3) 1 0.3% (0.0-1.0) 218 44.9% (40.2-49.6)<br />
No 10 4.0% (1.6-6.5) 274 96.0% (93.5-98.4) 0 . (.-.) 284 55.1% (50.4-59.8)<br />
Total 23 4.6% (2.7-6.5) 478 95.2% (93.3-97.1) 1 0.2% (0.0-0.5) 502 100.0% (_-_)<br />
Currently Employed Yes 13 5.3% (2.4-8.2) 235 94.7% (91.8-97.6) 0 . (.-.) 248 48.6% (44.0-53.3)<br />
No 10 4.0% (1.5-6.5) 241 95.1% (92.5-97.8) 3 0.8% (0.0-1.8) 254 51.4% (46.7-56.0)<br />
Total 23 4.6% (2.8-6.5) 476 94.9% (93.0-96.9) 3 0.4% (0.0-0.9) 502 100.0% (_-_)
Table Q10b: How would you rate the quality <strong>of</strong> those interpreter services?<br />
Q10b<br />
139<br />
Nevada <strong>Department</strong> <strong>of</strong> <strong>Employment</strong>, <strong>Training</strong> <strong>and</strong> <strong>Rehabilitation</strong><br />
2011 General Client Satisfaction Survey<br />
Fair Good Excellent Total<br />
N % C.I.(95%) N % C.I.(95%) N % C.I.(95%) N % C.I.(95%)<br />
Overall Total Total 4 18.7% (0.8-36.7) 10 45.1% (22.7-67.5) 9 36.2% (15.1-57.3) 23 100.0% (_-_)<br />
Gender Male 2 18.0% (0.0-42.6) 4 40.3% (8.0-72.6) 5 41.7% (10.2-73.2) 11 48.6% (26.1-71.0)<br />
Female 2 19.4% (0.0-45.4) 6 49.6% (18.5-80.8) 4 31.0% (2.9-59.1) 12 51.4% (29.0-73.9)<br />
Total 4 18.7% (0.8-36.7) 10 45.1% (22.7-67.5) 9 36.2% (15.1-57.3) 23 100.0% (_-_)<br />
Age Age 25 to 34 1 16.3% (0.0-48.1) 3 51.9% (8.4-95.4) 2 31.8% (0.0-71.7) 6 28.2% (7.6-48.7)<br />
Age 35 to 44 2 57.1% (4.6-100.0) 0 . (.-.) 2 42.9% (0.0-95.4) 4 17.5% (0.3-34.7)<br />
Age 45 to 54 0 . (.-.) 4 83.0% (49.6-100.0) 1 17.0% (0.0-50.4) 5 24.0% (4.3-43.7)<br />
Age 55 to 64 1 15.1% (0.0-44.6) 3 38.8% (0.1-77.6) 3 46.1% (5.6-86.5) 7 27.2% (8.0-46.4)<br />
Age 65 or older 0 . (.-.) 0 . (.-.) 1 100.0% (100.0-100.0) 1 3.1% (0.0-9.7)<br />
Total 4 18.7% (0.8-36.7) 10 45.1% (22.7-67.5) 9 36.2% (15.1-57.3) 23 100.0% (_-_)<br />
Region Southern 4 24.6% (1.9-47.3) 6 36.3% (11.3-61.4) 7 39.1% (14.1-64.0) 17 76.1% (57.1-95.0)<br />
Northern 0 . (.-.) 4 72.9% (36.1-100.0) 2 27.1% (0.0-63.9) 6 23.9% (5.0-42.9)<br />
Total 4 18.7% (0.8-36.7) 10 45.1% (22.7-67.5) 9 36.2% (15.1-57.3) 23 100.0% (_-_)<br />
Ever received any counselor-based assessment Yes 3 22.8% (0.0-47.2) 7 47.3% (19.4-75.2) 5 29.9% (5.2-54.5) 15 63.8% (42.1-85.5)<br />
No 1 11.5% (0.0-34.5) 3 41.2% (3.6-78.8) 4 47.3% (9.8-84.8) 8 36.2% (14.5-57.9)<br />
Total 4 18.7% (0.8-36.7) 10 45.1% (22.7-67.5) 9 36.2% (15.1-57.3) 23 100.0% (_-_)<br />
Ever received any community-based assessment Yes 3 36.7% (0.5-72.9) 2 27.5% (0.0-62.2) 3 35.9% (0.0-71.7) 8 37.0% (14.8-59.3)<br />
No 1 9.8% (0.0-29.3) 7 50.6% (21.5-79.6) 6 39.6% (11.7-67.5) 14 63.0% (40.7-85.2)<br />
Total 4 19.8% (0.9-38.6) 9 42.0% (19.2-64.9) 9 38.2% (16.2-60.3) 22 100.0% (_-_)
Table Q10b: How would you rate the quality <strong>of</strong> those interpreter services?<br />
Q10b<br />
140<br />
Nevada <strong>Department</strong> <strong>of</strong> <strong>Employment</strong>, <strong>Training</strong> <strong>and</strong> <strong>Rehabilitation</strong><br />
2011 General Client Satisfaction Survey<br />
Fair Good Excellent Total<br />
N % C.I.(95%) N % C.I.(95%) N % C.I.(95%) N % C.I.(95%)<br />
Ever received any assistive technology Yes 1 5.6% (0.0-17.3) 9 55.9% (30.2-81.7) 7 38.4% (13.4-63.5) 17 72.9% (52.7-93.0)<br />
No 3 53.8% (10.5-97.1) 1 16.1% (0.0-47.4) 2 30.2% (0.0-69.0) 6 27.1% (7.0-47.3)<br />
Total 4 18.7% (0.8-36.7) 10 45.1% (22.7-67.5) 9 36.2% (15.1-57.3) 23 100.0% (_-_)<br />
Ever received any transportation services Yes 1 7.9% (0.0-24.1) 7 55.2% (25.7-84.7) 5 36.8% (8.4-65.2) 13 51.9% (29.4-74.4)<br />
No 3 30.3% (0.0-61.5) 3 34.2% (1.2-67.2) 4 35.5% (4.0-67.0) 10 48.1% (25.6-70.6)<br />
Total 4 18.7% (0.8-36.7) 10 45.1% (22.7-67.5) 9 36.2% (15.1-57.3) 23 100.0% (_-_)<br />
Currently Employed Yes 2 17.9% (0.0-42.3) 6 47.6% (17.7-77.5) 5 34.4% (6.8-62.0) 13 55.5% (33.1-77.8)<br />
No 2 19.7% (0.0-46.3) 4 41.9% (8.1-75.8) 4 38.4% (5.8-71.0) 10 44.5% (22.2-66.9)<br />
Total 4 18.7% (0.8-36.7) 10 45.1% (22.7-67.5) 9 36.2% (15.1-57.3) 23 100.0% (_-_)
141<br />
Nevada <strong>Department</strong> <strong>of</strong> <strong>Employment</strong>, <strong>Training</strong> <strong>and</strong> <strong>Rehabilitation</strong><br />
2011 General Client Satisfaction Survey<br />
Table Q12a: Have you ever received any on-the-job training services from the vocational rehabilitation program?<br />
Q12a<br />
Yes No Don't Know/Refused Total<br />
N % C.I.(95%) N % C.I.(95%) N % C.I.(95%) N % C.I.(95%)<br />
Overall Total Total 114 24.6% (20.3-28.9) 385 74.1% (69.7-78.5) 7 1.3% (0.3-2.2) 506 100.0% (_-_)<br />
Gender Male 49 21.5% (15.1-27.9) 194 76.6% (70.2-83.1) 5 1.9% (0.2-3.6) 248 48.5% (43.9-53.2)<br />
Female 65 27.6% (21.7-33.5) 191 71.7% (65.8-77.6) 2 0.7% (0.0-1.7) 258 51.5% (46.8-56.1)<br />
Total 114 24.6% (20.3-28.9) 385 74.1% (69.7-78.5) 7 1.3% (0.3-2.2) 506 100.0% (_-_)<br />
Age
142<br />
Nevada <strong>Department</strong> <strong>of</strong> <strong>Employment</strong>, <strong>Training</strong> <strong>and</strong> <strong>Rehabilitation</strong><br />
2011 General Client Satisfaction Survey<br />
Table Q12a: Have you ever received any on-the-job training services from the vocational rehabilitation program?<br />
Q12a<br />
Yes No Don't Know/Refused Total<br />
N % C.I.(95%) N % C.I.(95%) N % C.I.(95%) N % C.I.(95%)<br />
Ever received any assistive technology Yes 72 26.4% (20.4-32.3) 231 72.5% (66.5-78.4) 4 1.1% (0.0-2.3) 307 59.8% (55.2-64.3)<br />
No 42 22.0% (16.0-28.0) 154 76.5% (70.4-82.6) 3 1.5% (0.0-3.1) 199 40.2% (35.7-44.8)<br />
Total 114 24.6% (20.3-28.9) 385 74.1% (69.7-78.5) 7 1.3% (0.3-2.2) 506 100.0% (_-_)<br />
Ever received any transportation services Yes 71 35.4% (28.0-42.7) 144 63.5% (56.1-70.9) 3 1.2% (0.0-2.5) 218 44.9% (40.3-49.6)<br />
No 43 16.3% (11.7-20.9) 237 82.7% (78.0-87.4) 3 1.0% (0.0-2.2) 283 55.1% (50.4-59.7)<br />
Total 114 24.8% (20.5-29.2) 381 74.1% (69.7-78.5) 6 1.1% (0.2-2.0) 501 100.0% (_-_)<br />
Currently Employed Yes 58 24.8% (19.1-30.4) 186 73.8% (68.0-79.5) 4 1.5% (0.0-3.0) 248 48.6% (44.0-53.3)<br />
No 55 24.1% (17.7-30.6) 196 74.8% (68.3-81.3) 3 1.1% (0.0-2.3) 254 51.4% (46.7-56.0)<br />
Total 113 24.4% (20.1-28.7) 382 74.3% (69.9-78.6) 7 1.3% (0.3-2.3) 502 100.0% (_-_)
Table Q12b: How would you rate the quality <strong>of</strong> those on-the-job training services?<br />
Q12b<br />
143<br />
Nevada <strong>Department</strong> <strong>of</strong> <strong>Employment</strong>, <strong>Training</strong> <strong>and</strong> <strong>Rehabilitation</strong><br />
2011 General Client Satisfaction Survey<br />
Poor Fair Good Excellent Total<br />
N % C.I.(95%) N % C.I.(95%) N % C.I.(95%) N % C.I.(95%) N % C.I.(95%)<br />
Overall Total Total 11 10.2% (4.2-16.2) 15 13.1% (6.4-19.7) 34 28.1% (19.3-37.0) 54 48.6% (38.0-59.2) 114 100.0% (_-_)<br />
Gender Male 7 13.7% (3.6-23.8) 5 9.6% (1.1-18.1) 12 21.4% (9.4-33.4) 25 55.3% (38.3-72.3) 49 42.3% (31.6-53.0)<br />
Female 4 7.7% (0.2-15.1) 10 15.6% (6.0-25.2) 22 33.0% (21.0-45.0) 29 43.7% (31.1-56.3) 65 57.7% (47.0-68.4)<br />
Total 11 10.2% (4.2-16.2) 15 13.1% (6.4-19.7) 34 28.1% (19.3-37.0) 54 48.6% (38.0-59.2) 114 100.0% (_-_)<br />
Age
Table Q12b: How would you rate the quality <strong>of</strong> those on-the-job training services?<br />
Q12b<br />
144<br />
Nevada <strong>Department</strong> <strong>of</strong> <strong>Employment</strong>, <strong>Training</strong> <strong>and</strong> <strong>Rehabilitation</strong><br />
2011 General Client Satisfaction Survey<br />
Poor Fair Good Excellent Total<br />
N % C.I.(95%) N % C.I.(95%) N % C.I.(95%) N % C.I.(95%) N % C.I.(95%)<br />
Ever received any transportation services Yes 4 5.5% (0.1-10.8) 6 9.0% (1.4-16.5) 21 26.4% (15.5-37.2) 40 59.2% (46.2-72.3) 71 63.9% (54.2-73.6)<br />
No 7 18.7% (5.8-31.6) 9 20.3% (8.0-32.7) 13 31.2% (16.3-46.1) 14 29.8% (15.9-43.6) 43 36.1% (26.4-45.8)<br />
Total 11 10.2% (4.2-16.2) 15 13.1% (6.4-19.7) 34 28.1% (19.3-37.0) 54 48.6% (38.0-59.2) 114 100.0% (_-_)<br />
Currently Employed Yes 5 8.4% (1.2-15.5) 5 7.2% (0.9-13.5) 19 34.1% (21.1-47.0) 29 50.4% (36.9-63.8) 58 49.3% (38.7-59.8)<br />
No 6 12.4% (2.6-22.2) 9 15.6% (5.5-25.7) 15 23.3% (11.6-35.0) 25 48.6% (32.2-65.1) 55 50.7% (40.2-61.3)<br />
Total 11 10.4% (4.3-16.5) 14 11.5% (5.5-17.4) 34 28.6% (19.7-37.6) 54 49.5% (38.9-60.1) 113 100.0% (_-_)
145<br />
Nevada <strong>Department</strong> <strong>of</strong> <strong>Employment</strong>, <strong>Training</strong> <strong>and</strong> <strong>Rehabilitation</strong><br />
2011 General Client Satisfaction Survey<br />
Table Q13a: Have you ever received any post-employment services from the vocational rehabilitation program?<br />
Q13a<br />
Yes No Don't Know/Refused Total<br />
N % C.I.(95%) N % C.I.(95%) N % C.I.(95%) N % C.I.(95%)<br />
Overall Total Total 140 28.2% (24.1-32.4) 360 70.5% (66.3-74.7) 6 1.2% (0.2-2.3) 506 100.0% (_-_)<br />
Gender Male 80 31.6% (25.5-37.6) 164 66.8% (60.7-73.0) 4 1.6% (0.0-3.2) 248 48.5% (43.9-53.2)<br />
Female 60 25.1% (19.4-30.8) 196 74.0% (68.2-79.8) 2 0.9% (0.0-2.1) 258 51.5% (46.8-56.1)<br />
Total 140 28.2% (24.1-32.4) 360 70.5% (66.3-74.7) 6 1.2% (0.2-2.3) 506 100.0% (_-_)<br />
Age
146<br />
Nevada <strong>Department</strong> <strong>of</strong> <strong>Employment</strong>, <strong>Training</strong> <strong>and</strong> <strong>Rehabilitation</strong><br />
2011 General Client Satisfaction Survey<br />
Table Q13a: Have you ever received any post-employment services from the vocational rehabilitation program?<br />
Q13a<br />
Yes No Don't Know/Refused Total<br />
N % C.I.(95%) N % C.I.(95%) N % C.I.(95%) N % C.I.(95%)<br />
Ever received any transportation services Yes 81 36.9% (30.0-43.7) 134 61.6% (54.7-68.6) 3 1.5% (0.0-3.2) 218 44.9% (40.3-49.6)<br />
No 58 21.3% (16.2-26.3) 222 77.6% (72.5-82.8) 3 1.1% (0.0-2.3) 283 55.1% (50.4-59.7)<br />
Total 139 28.3% (24.1-32.4) 356 70.5% (66.2-74.7) 6 1.3% (0.2-2.3) 501 100.0% (_-_)<br />
Currently Employed Yes 80 34.5% (28.3-40.8) 164 63.8% (57.5-70.1) 4 1.7% (0.0-3.4) 248 48.6% (44.0-53.3)<br />
No 59 22.0% (16.8-27.2) 193 77.2% (71.9-82.5) 2 0.9% (0.0-2.0) 254 51.4% (46.7-56.0)<br />
Total 139 28.1% (24.0-32.2) 357 70.7% (66.5-74.8) 6 1.3% (0.2-2.3) 502 100.0% (_-_)
Table Q13b: How would you rate the quality <strong>of</strong> those post-employment services?<br />
Q13b<br />
147<br />
Nevada <strong>Department</strong> <strong>of</strong> <strong>Employment</strong>, <strong>Training</strong> <strong>and</strong> <strong>Rehabilitation</strong><br />
2011 General Client Satisfaction Survey<br />
Poor Fair Good Excellent Total<br />
N % C.I.(95%) N % C.I.(95%) N % C.I.(95%) N % C.I.(95%) N % C.I.(95%)<br />
Overall Total Total 9 6.2% (2.2-10.3) 11 8.8% (3.5-14.0) 45 33.1% (24.9-41.3) 75 51.9% (43.3-60.5) 140 100.0% (_-_)<br />
Gender Male 4 5.3% (0.2-10.5) 6 8.1% (1.8-14.4) 28 35.1% (24.4-45.8) 43 51.5% (40.3-62.7) 81 55.4% (46.8-64.1)<br />
Female 5 7.4% (0.9-13.9) 5 9.6% (0.8-18.3) 17 30.7% (18.0-43.3) 32 52.4% (38.9-65.9) 59 44.6% (35.9-53.2)<br />
Total 9 6.2% (2.2-10.3) 11 8.8% (3.5-14.0) 45 33.1% (24.9-41.3) 75 51.9% (43.3-60.5) 140 100.0% (_-_)<br />
Age
Table Q13b: How would you rate the quality <strong>of</strong> those post-employment services?<br />
Q13b<br />
148<br />
Nevada <strong>Department</strong> <strong>of</strong> <strong>Employment</strong>, <strong>Training</strong> <strong>and</strong> <strong>Rehabilitation</strong><br />
2011 General Client Satisfaction Survey<br />
Poor Fair Good Excellent Total<br />
N % C.I.(95%) N % C.I.(95%) N % C.I.(95%) N % C.I.(95%) N % C.I.(95%)<br />
Ever received any transportation services Yes 5 6.0% (0.7-11.2) 6 7.2% (1.5-12.9) 24 30.9% (20.4-41.3) 46 56.0% (44.8-67.1) 81 58.2% (49.6-66.8)<br />
No 4 6.7% (0.2-13.2) 5 11.1% (1.3-20.9) 21 36.8% (23.6-50.0) 28 45.4% (32.0-58.8) 58 41.8% (33.2-50.4)<br />
Total 9 6.3% (2.2-10.4) 11 8.8% (3.5-14.1) 45 33.4% (25.1-41.6) 74 51.6% (42.9-60.2) 139 100.0% (_-_)<br />
Currently Employed Yes 1 1.1% (0.0-3.4) 10 13.6% (5.3-22.0) 29 37.9% (26.6-49.1) 40 47.4% (36.0-58.8) 80 59.4% (51.0-67.7)<br />
No 8 13.7% (4.6-22.7) 1 1.6% (0.0-4.9) 16 26.2% (14.8-37.6) 35 58.5% (45.6-71.4) 60 40.6% (32.3-49.0)<br />
Total 9 6.2% (2.2-10.3) 11 8.8% (3.5-14.0) 45 33.1% (24.9-41.3) 75 51.9% (43.3-60.5) 140 100.0% (_-_)
Table Q15a: Are you currently employed?<br />
Q15a<br />
149<br />
Nevada <strong>Department</strong> <strong>of</strong> <strong>Employment</strong>, <strong>Training</strong> <strong>and</strong> <strong>Rehabilitation</strong><br />
2011 General Client Satisfaction Survey<br />
Yes No Total<br />
N % C.I.(95%) N % C.I.(95%) N % C.I.(95%)<br />
Overall Total Total 248 48.6% (44.0-53.3) 254 51.4% (46.7-56.0) 502 100.0% (_-_)<br />
Gender Male 116 46.4% (39.7-53.1) 132 53.6% (46.9-60.3) 248 49.0% (44.4-53.7)<br />
Female 132 50.8% (44.4-57.2) 122 49.2% (42.8-55.6) 254 51.0% (46.3-55.6)<br />
Total 248 48.6% (44.0-53.3) 254 51.4% (46.7-56.0) 502 100.0% (_-_)<br />
Age
Table Q15a: Are you currently employed?<br />
Q15a<br />
150<br />
Nevada <strong>Department</strong> <strong>of</strong> <strong>Employment</strong>, <strong>Training</strong> <strong>and</strong> <strong>Rehabilitation</strong><br />
2011 General Client Satisfaction Survey<br />
Yes No Total<br />
N % C.I.(95%) N % C.I.(95%) N % C.I.(95%)<br />
Ever received any transportation services Yes 105 47.7% (40.4-55.0) 110 52.3% (45.0-59.6) 215 44.5% (39.8-49.1)<br />
No 141 49.2% (43.2-55.3) 142 50.8% (44.7-56.8) 283 55.5% (50.9-60.2)<br />
Total 246 48.6% (43.9-53.2) 252 51.4% (46.8-56.1) 498 100.0% (_-_)<br />
Currently Employed Yes 248 100.0% (100.0-100.0) 0 . (.-.) 248 48.6% (44.0-53.3)<br />
No 0 . (.-.) 254 100.0% (100.0-100.0) 254 51.4% (46.7-56.0)<br />
Total 248 48.6% (44.0-53.3) 254 51.4% (46.7-56.0) 502 100.0% (_-_)
151<br />
Nevada <strong>Department</strong> <strong>of</strong> <strong>Employment</strong>, <strong>Training</strong> <strong>and</strong> <strong>Rehabilitation</strong><br />
2011 General Client Satisfaction Survey<br />
Table Q15b: Did you get your current job as a result <strong>of</strong> the services you received from the Vocational<br />
<strong>Rehabilitation</strong> Program?<br />
Q15b<br />
Yes No Total<br />
N % C.I.(95%) N % C.I.(95%) N % C.I.(95%)<br />
Overall Total Total 102 41.9% (35.5-48.3) 146 58.1% (51.7-64.5) 248 100.0% (_-_)<br />
Gender Male 42 35.4% (26.5-44.2) 74 64.6% (55.8-73.5) 116 46.8% (40.3-53.2)<br />
Female 60 47.7% (38.7-56.6) 72 52.3% (43.4-61.3) 132 53.2% (46.8-59.7)<br />
Total 102 41.9% (35.5-48.3) 146 58.1% (51.7-64.5) 248 100.0% (_-_)<br />
Age
152<br />
Nevada <strong>Department</strong> <strong>of</strong> <strong>Employment</strong>, <strong>Training</strong> <strong>and</strong> <strong>Rehabilitation</strong><br />
2011 General Client Satisfaction Survey<br />
Table Q15b: Did you get your current job as a result <strong>of</strong> the services you received from the Vocational<br />
<strong>Rehabilitation</strong> Program?<br />
Q15b<br />
Yes No Total<br />
N % C.I.(95%) N % C.I.(95%) N % C.I.(95%)<br />
Ever received any transportation services Yes 54 50.7% (40.8-60.6) 51 49.3% (39.4-59.2) 105 43.7% (37.2-50.1)<br />
No 46 34.3% (26.0-42.6) 95 65.7% (57.4-74.0) 141 56.3% (49.9-62.8)<br />
Total 100 41.4% (35.0-47.9) 146 58.6% (52.1-65.0) 246 100.0% (_-_)<br />
Currently Employed Yes 102 41.9% (35.5-48.3) 146 58.1% (51.7-64.5) 248 100.0% (_-_)
153<br />
Nevada <strong>Department</strong> <strong>of</strong> <strong>Employment</strong>, <strong>Training</strong> <strong>and</strong> <strong>Rehabilitation</strong><br />
2011 General Client Satisfaction Survey<br />
Table Q15c: "Did you get ANY job as the results <strong>of</strong> the services you received from the Vocational <strong>Rehabilitation</strong><br />
Program?<br />
Q15c<br />
Yes No Don't Know/Refused Total<br />
N % C.I.(95%) N % C.I.(95%) N % C.I.(95%) N % C.I.(95%)<br />
Overall Total Total 19 13.4% (7.6-19.2) 127 86.0% (80.1-91.9) 1 0.6% (0.0-1.7) 147 100.0% (_-_)<br />
Gender Male 10 14.7% (6.1-23.2) 63 84.2% (75.4-93.0) 1 1.1% (0.0-3.4) 74 51.7% (43.3-60.2)<br />
Female 9 12.1% (4.3-19.9) 64 87.9% (80.1-95.7) 0 . (.-.) 73 48.3% (39.8-56.7)<br />
Total 19 13.4% (7.6-19.2) 127 86.0% (80.1-91.9) 1 0.6% (0.0-1.7) 147 100.0% (_-_)<br />
Age
154<br />
Nevada <strong>Department</strong> <strong>of</strong> <strong>Employment</strong>, <strong>Training</strong> <strong>and</strong> <strong>Rehabilitation</strong><br />
2011 General Client Satisfaction Survey<br />
Table Q15c: "Did you get ANY job as the results <strong>of</strong> the services you received from the Vocational <strong>Rehabilitation</strong><br />
Program?<br />
Q15c<br />
Yes No Don't Know/Refused Total<br />
N % C.I.(95%) N % C.I.(95%) N % C.I.(95%) N % C.I.(95%)<br />
Ever received any transportation services Yes 9 17.6% (6.8-28.4) 41 80.8% (69.7-91.9) 1 1.6% (0.0-4.8) 51 36.6% (28.4-44.8)<br />
No 10 11.0% (4.3-17.7) 86 89.0% (82.3-95.7) 0 . (.-.) 96 63.4% (55.2-71.6)<br />
Total 19 13.4% (7.6-19.2) 127 86.0% (80.1-91.9) 1 0.6% (0.0-1.7) 147 100.0% (_-_)<br />
Currently Employed Yes 19 13.4% (7.6-19.2) 127 86.0% (80.1-91.9) 1 0.6% (0.0-1.7) 147 100.0% (_-_)
155<br />
Nevada <strong>Department</strong> <strong>of</strong> <strong>Employment</strong>, <strong>Training</strong> <strong>and</strong> <strong>Rehabilitation</strong><br />
2011 General Client Satisfaction Survey<br />
Table Q15d: When your case was closed, were you in a job that the Vocational <strong>Rehabilitation</strong> Program<br />
helped place you in?<br />
Q15d<br />
Yes No Total<br />
N % C.I.(95%) N % C.I.(95%) N % C.I.(95%)<br />
Overall Total Total 10 53.3% (28.0-78.6) 9 46.7% (21.4-72.0) 19 100.0% (_-_)<br />
Gender Male 7 71.5% (40.6-100.0) 3 28.5% (0.0-59.4) 10 56.5% (31.5-81.5)<br />
Female 3 29.7% (0.0-62.1) 6 70.3% (37.9-100.0) 9 43.5% (18.5-68.5)<br />
Total 10 53.3% (28.0-78.6) 9 46.7% (21.4-72.0) 19 100.0% (_-_)<br />
Age Age 25 to 34 3 55.2% (11.5-98.9) 3 44.8% (1.1-88.5) 6 36.2% (11.2-61.2)<br />
Age 35 to 44 3 66.9% (11.5-100.0) 1 33.1% (0.0-88.5) 4 21.5% (0.5-42.4)<br />
Age 45 to 54 2 44.6% (0.0-97.9) 2 55.4% (2.1-100.0) 4 22.7% (1.1-44.2)<br />
Age 55 to 64 2 52.8% (0.0-100.0) 2 47.2% (0.0-100.0) 4 16.7% (0.0-33.8)<br />
Age 65 or older 0 . (.-.) 1 100.0% (100.0-100.0) 1 2.9% (0.0-9.2)<br />
Total 10 53.3% (28.0-78.6) 9 46.7% (21.4-72.0) 19 100.0% (_-_)<br />
Region Southern 3 40.0% (0.3-79.8) 4 60.0% (20.2-99.7) 7 38.9% (14.1-63.8)<br />
Northern 6 58.2% (25.2-91.2) 5 41.8% (8.8-74.8) 11 55.9% (30.7-81.1)<br />
Rural 1 100.0% (100.0-100.0) 0 . (.-.) 1 5.2% (0.0-16.0)<br />
Total 10 53.3% (28.0-78.6) 9 46.7% (21.4-72.0) 19 100.0% (_-_)<br />
Ever received any counselor-based assessment Yes 6 47.5% (17.0-77.9) 7 52.5% (22.1-83.0) 13 73.3% (52.0-94.6)<br />
No 4 69.3% (28.2-100.0) 2 30.7% (0.0-71.8) 6 26.7% (5.4-48.0)<br />
Total 10 53.3% (28.0-78.6) 9 46.7% (21.4-72.0) 19 100.0% (_-_)<br />
Ever received any community-based assessment Yes 2 36.1% (0.0-81.8) 3 63.9% (18.2-100.0) 5 29.7% (5.5-53.8)<br />
No 7 57.7% (27.3-88.1) 6 42.3% (11.9-72.7) 13 70.3% (46.2-94.5)<br />
Total 9 51.3% (25.1-77.5) 9 48.7% (22.5-74.9) 18 100.0% (_-_)<br />
Ever received any assistive technology Yes 3 25.5% (0.0-53.7) 9 74.5% (46.3-100.0) 12 62.7% (38.2-87.2)<br />
No 7 100.0% (100.0-100.0) 0 . (.-.) 7 37.3% (12.8-61.8)<br />
Total 10 53.3% (28.0-78.6) 9 46.7% (21.4-72.0) 19 100.0% (_-_)
156<br />
Nevada <strong>Department</strong> <strong>of</strong> <strong>Employment</strong>, <strong>Training</strong> <strong>and</strong> <strong>Rehabilitation</strong><br />
2011 General Client Satisfaction Survey<br />
Table Q15d: When your case was closed, were you in a job that the Vocational <strong>Rehabilitation</strong> Program<br />
helped place you in?<br />
Q15d<br />
Yes No Total<br />
N % C.I.(95%) N % C.I.(95%) N % C.I.(95%)<br />
Ever received any transportation services Yes 5 58.4% (22.6-94.2) 4 41.6% (5.8-77.4) 9 48.0% (22.6-73.3)<br />
No 5 48.6% (13.4-83.7) 5 51.4% (16.3-86.6) 10 52.0% (26.7-77.4)<br />
Total 10 53.3% (28.0-78.6) 9 46.7% (21.4-72.0) 19 100.0% (_-_)<br />
Currently Employed Yes 10 53.3% (28.0-78.6) 9 46.7% (21.4-72.0) 19 100.0% (_-_)
Table Q15e: Are you currently employed in that job?<br />
Q15e<br />
157<br />
Nevada <strong>Department</strong> <strong>of</strong> <strong>Employment</strong>, <strong>Training</strong> <strong>and</strong> <strong>Rehabilitation</strong><br />
2011 General Client Satisfaction Survey<br />
No Total<br />
N % C.I.(95%) N % C.I.(95%)<br />
Overall Total Total 10 100.0% (100.0-100.0) 10 100.0% (_-_)<br />
Gender Male 7 100.0% (100.0-100.0) 7 75.8% (45.3-100.0)<br />
Female 3 100.0% (100.0-100.0) 3 24.2% (0.0-54.7)<br />
Total 10 100.0% (100.0-100.0) 10 100.0% (_-_)<br />
Age Age 25 to 34 3 100.0% (100.0-100.0) 3 37.5% (0.0-76.3)<br />
Age 35 to 44 3 100.0% (100.0-100.0) 3 26.9% (0.0-59.6)<br />
Age 45 to 54 2 100.0% (100.0-100.0) 2 19.0% (0.0-48.1)<br />
Age 55 to 64 2 100.0% (100.0-100.0) 2 16.6% (0.0-42.9)<br />
Total 10 100.0% (100.0-100.0) 10 100.0% (_-_)<br />
Region Southern 3 100.0% (100.0-100.0) 3 29.2% (0.0-63.6)<br />
Northern 6 100.0% (100.0-100.0) 6 61.1% (24.0-98.1)<br />
Rural 1 100.0% (100.0-100.0) 1 9.7% (0.0-31.7)<br />
Total 10 100.0% (100.0-100.0) 10 100.0% (_-_)<br />
Ever received any counselor-based assessment Yes 6 100.0% (100.0-100.0) 6 65.2% (29.9-100.0)<br />
No 4 100.0% (100.0-100.0) 4 34.8% (0.0-70.1)<br />
Total 10 100.0% (100.0-100.0) 10 100.0% (_-_)<br />
Ever received any community-based assessment Yes 2 100.0% (100.0-100.0) 2 20.9% (0.0-53.4)<br />
No 7 100.0% (100.0-100.0) 7 79.1% (46.6-100.0)<br />
Total 9 100.0% (100.0-100.0) 9 100.0% (_-_)<br />
Ever received any assistive technology Yes 3 100.0% (100.0-100.0) 3 30.0% (0.0-65.5)<br />
No 7 100.0% (100.0-100.0) 7 70.0% (34.5-100.0)<br />
Total 10 100.0% (100.0-100.0) 10 100.0% (_-_)
Table Q15e: Are you currently employed in that job?<br />
Q15e<br />
158<br />
Nevada <strong>Department</strong> <strong>of</strong> <strong>Employment</strong>, <strong>Training</strong> <strong>and</strong> <strong>Rehabilitation</strong><br />
2011 General Client Satisfaction Survey<br />
No Total<br />
N % C.I.(95%) N % C.I.(95%)<br />
Ever received any transportation services Yes 5 100.0% (100.0-100.0) 5 52.6% (14.3-90.9)<br />
No 5 100.0% (100.0-100.0) 5 47.4% (9.1-85.7)<br />
Total 10 100.0% (100.0-100.0) 10 100.0% (_-_)<br />
Currently Employed Yes 10 100.0% (100.0-100.0) 10 100.0% (_-_)
159<br />
Nevada <strong>Department</strong> <strong>of</strong> <strong>Employment</strong>, <strong>Training</strong> <strong>and</strong> <strong>Rehabilitation</strong><br />
2011 General Client Satisfaction Survey<br />
Table Q15f: Are you currently employed in the same career field as the job you were in when your<br />
case was closed?<br />
Q15f<br />
Yes No Total<br />
N % C.I.(95%) N % C.I.(95%) N % C.I.(95%)<br />
Overall Total Total 4 42.1% (3.9-80.3) 6 57.9% (19.7-96.1) 10 100.0% (_-_)<br />
Gender Male 4 55.6% (10.1-100.0) 3 44.4% (0.0-89.9) 7 75.8% (45.3-100.0)<br />
Female 0 . (.-.) 3 100.0% (100.0-100.0) 3 24.2% (0.0-54.7)<br />
Total 4 42.1% (3.9-80.3) 6 57.9% (19.7-96.1) 10 100.0% (_-_)<br />
Age Age 25 to 34 1 36.0% (0.0-100.0) 2 64.0% (0.0-100.0) 3 37.5% (0.0-76.3)<br />
Age 35 to 44 1 35.8% (0.0-100.0) 2 64.2% (0.0-100.0) 3 26.9% (0.0-59.6)<br />
Age 45 to 54 2 100.0% (100.0-100.0) 0 . (.-.) 2 19.0% (0.0-48.1)<br />
Age 55 to 64 0 . (.-.) 2 100.0% (100.0-100.0) 2 16.6% (0.0-42.9)<br />
Total 4 42.1% (3.9-80.3) 6 57.9% (19.7-96.1) 10 100.0% (_-_)<br />
Region Southern 1 31.8% (0.0-95.2) 2 68.2% (4.8-100.0) 3 29.2% (0.0-63.6)<br />
Northern 2 37.9% (0.0-87.4) 4 62.1% (12.6-100.0) 6 61.1% (24.0-98.1)<br />
Rural 1 100.0% (100.0-100.0) 0 . (.-.) 1 9.7% (0.0-31.7)<br />
Total 4 42.1% (3.9-80.3) 6 57.9% (19.7-96.1) 10 100.0% (_-_)<br />
Ever received any counselor-based assessment Yes 4 64.5% (16.6-100.0) 2 35.5% (0.0-83.4) 6 65.2% (29.9-100.0)<br />
No 0 . (.-.) 4 100.0% (100.0-100.0) 4 34.8% (0.0-70.1)<br />
Total 4 42.1% (3.9-80.3) 6 57.9% (19.7-96.1) 10 100.0% (_-_)<br />
Ever received any community-based assessment Yes 1 50.0% (0.0-100.0) 1 50.0% (0.0-100.0) 2 20.9% (0.0-53.4)<br />
No 3 44.4% (0.0-91.5) 4 55.6% (8.5-100.0) 7 79.1% (46.6-100.0)<br />
Total 4 45.6% (4.2-87.0) 5 54.4% (13.0-95.8) 9 100.0% (_-_)<br />
Ever received any assistive technology Yes 2 76.1% (22.7-100.0) 1 23.9% (0.0-77.3) 3 30.0% (0.0-65.5)<br />
No 2 27.6% (0.0-67.6) 5 72.4% (32.4-100.0) 7 70.0% (34.5-100.0)<br />
Total 4 42.1% (3.9-80.3) 6 57.9% (19.7-96.1) 10 100.0% (_-_)
160<br />
Nevada <strong>Department</strong> <strong>of</strong> <strong>Employment</strong>, <strong>Training</strong> <strong>and</strong> <strong>Rehabilitation</strong><br />
2011 General Client Satisfaction Survey<br />
Table Q15f: Are you currently employed in the same career field as the job you were in when your<br />
case was closed?<br />
Q15f<br />
Yes No Total<br />
N % C.I.(95%) N % C.I.(95%) N % C.I.(95%)<br />
Ever received any transportation services Yes 2 36.0% (0.0-86.4) 3 64.0% (13.6-100.0) 5 52.6% (14.3-90.9)<br />
No 2 48.9% (0.0-100.0) 3 51.1% (0.0-100.0) 5 47.4% (9.1-85.7)<br />
Total 4 42.1% (3.9-80.3) 6 57.9% (19.7-96.1) 10 100.0% (_-_)<br />
Currently Employed Yes 4 42.1% (3.9-80.3) 6 57.9% (19.7-96.1) 10 100.0% (_-_)
161<br />
Nevada <strong>Department</strong> <strong>of</strong> <strong>Employment</strong>, <strong>Training</strong> <strong>and</strong> <strong>Rehabilitation</strong><br />
2011 General Client Satisfaction Survey<br />
Table Q15g: Compared to the job you had when your case was closed, does your<br />
current job provide you with either equal or better pay OR equal or better<br />
benefits?<br />
Q15g<br />
Yes Total<br />
N % C.I.(95%) N % C.I.(95%)<br />
Gender Male 4 100.0% (100.0-100.0) 4 100.0% (_-_)<br />
Age Age 25 to 34 1 100.0% (100.0-100.0) 1 32.1% (0.0-100.0)<br />
Age 35 to 44 1 100.0% (100.0-100.0) 1 22.9% (0.0-98.0)<br />
Age 45 to 54 2 100.0% (100.0-100.0) 2 45.1% (0.0-100.0)<br />
Total 4 100.0% (100.0-100.0) 4 100.0% (_-_)<br />
Region Southern 1 100.0% (100.0-100.0) 1 22.1% (0.0-95.4)<br />
Northern 2 100.0% (100.0-100.0) 2 54.9% (0.0-100.0)<br />
Rural 1 100.0% (100.0-100.0) 1 23.0% (0.0-98.3)<br />
Total 4 100.0% (100.0-100.0) 4 100.0% (_-_)<br />
Ever received any counselor-based assessment Yes 4 100.0% (100.0-100.0) 4 100.0% (_-_)<br />
Ever received any community-based assessment Yes 1 100.0% (100.0-100.0) 1 22.9% (0.0-98.0)<br />
No 3 100.0% (100.0-100.0) 3 77.1% (2.0-100.0)<br />
Total 4 100.0% (100.0-100.0) 4 100.0% (_-_)<br />
Ever received any assistive technology Yes 2 100.0% (100.0-100.0) 2 54.2% (0.0-100.0)<br />
No 2 100.0% (100.0-100.0) 2 45.8% (0.0-100.0)<br />
Total 4 100.0% (100.0-100.0) 4 100.0% (_-_)<br />
Ever received any transportation services Yes 2 100.0% (100.0-100.0) 2 45.0% (0.0-100.0)<br />
No 2 100.0% (100.0-100.0) 2 55.0% (0.0-100.0)<br />
Total 4 100.0% (100.0-100.0) 4 100.0% (_-_)<br />
Currently Employed Yes 4 100.0% (100.0-100.0) 4 100.0% (_-_)
Table Q16a: Benefits: Paid federal or state holidays<br />
Q16a<br />
162<br />
Nevada <strong>Department</strong> <strong>of</strong> <strong>Employment</strong>, <strong>Training</strong> <strong>and</strong> <strong>Rehabilitation</strong><br />
2011 General Client Satisfaction Survey<br />
Yes No Don't Know/Refused Total<br />
N % C.I.(95%) N % C.I.(95%) N % C.I.(95%) N % C.I.(95%)<br />
Overall Total Total 116 46.9% (40.5-53.4) 126 50.7% (44.3-57.2) 6 2.3% (0.5-4.2) 248 100.0% (_-_)<br />
Gender Male 57 48.8% (39.5-58.1) 56 48.6% (39.2-57.9) 3 2.6% (0.0-5.5) 116 46.8% (40.3-53.2)<br />
Female 59 45.2% (36.3-54.2) 70 52.6% (43.7-61.6) 3 2.1% (0.0-4.5) 132 53.2% (46.8-59.7)<br />
Total 116 46.9% (40.5-53.4) 126 50.7% (44.3-57.2) 6 2.3% (0.5-4.2) 248 100.0% (_-_)<br />
Age
Table Q16a: Benefits: Paid federal or state holidays<br />
Q16a<br />
163<br />
Nevada <strong>Department</strong> <strong>of</strong> <strong>Employment</strong>, <strong>Training</strong> <strong>and</strong> <strong>Rehabilitation</strong><br />
2011 General Client Satisfaction Survey<br />
Yes No Don't Know/Refused Total<br />
N % C.I.(95%) N % C.I.(95%) N % C.I.(95%) N % C.I.(95%)<br />
Ever received any transportation services Yes 52 47.5% (37.7-57.3) 53 52.5% (42.7-62.3) 0 . (.-.) 105 43.7% (37.2-50.1)<br />
No 63 46.4% (37.8-55.0) 73 50.1% (41.5-58.8) 5 3.5% (0.4-6.5) 141 56.3% (49.9-62.8)<br />
Total 115 46.9% (40.4-53.3) 126 51.2% (44.7-57.7) 5 2.0% (0.2-3.7) 246 100.0% (_-_)<br />
Currently Employed Yes 116 46.9% (40.5-53.4) 126 50.7% (44.3-57.2) 6 2.3% (0.5-4.2) 248 100.0% (_-_)
Table Q16b: "Benefits: Paid vacation<br />
Q16b<br />
164<br />
Nevada <strong>Department</strong> <strong>of</strong> <strong>Employment</strong>, <strong>Training</strong> <strong>and</strong> <strong>Rehabilitation</strong><br />
2011 General Client Satisfaction Survey<br />
Yes No Don't Know/Refused Total<br />
N % C.I.(95%) N % C.I.(95%) N % C.I.(95%) N % C.I.(95%)<br />
Overall Total Total 132 53.9% (47.5-60.4) 114 45.3% (38.9-51.7) 2 0.8% (0.0-1.9) 248 100.0% (_-_)<br />
Gender Male 60 51.5% (42.2-60.9) 55 47.6% (38.3-56.9) 1 0.9% (0.0-2.6) 116 46.8% (40.3-53.2)<br />
Female 72 56.0% (47.1-64.9) 59 43.3% (34.4-52.1) 1 0.7% (0.0-2.2) 132 53.2% (46.8-59.7)<br />
Total 132 53.9% (47.5-60.4) 114 45.3% (38.9-51.7) 2 0.8% (0.0-1.9) 248 100.0% (_-_)<br />
Age
Table Q16b: "Benefits: Paid vacation<br />
Q16b<br />
165<br />
Nevada <strong>Department</strong> <strong>of</strong> <strong>Employment</strong>, <strong>Training</strong> <strong>and</strong> <strong>Rehabilitation</strong><br />
2011 General Client Satisfaction Survey<br />
Yes No Don't Know/Refused Total<br />
N % C.I.(95%) N % C.I.(95%) N % C.I.(95%) N % C.I.(95%)<br />
Ever received any transportation services Yes 52 48.9% (39.0-58.7) 53 51.1% (41.3-61.0) 0 . (.-.) 105 43.7% (37.2-50.1)<br />
No 78 57.1% (48.6-65.6) 61 41.4% (33.0-49.9) 2 1.4% (0.0-3.4) 141 56.3% (49.9-62.8)<br />
Total 130 53.5% (47.1-60.0) 114 45.7% (39.2-52.1) 2 0.8% (0.0-1.9) 246 100.0% (_-_)<br />
Currently Employed Yes 132 53.9% (47.5-60.4) 114 45.3% (38.9-51.7) 2 0.8% (0.0-1.9) 248 100.0% (_-_)
Table Q16c: Benefits: Health Insurance<br />
Q16c<br />
166<br />
Nevada <strong>Department</strong> <strong>of</strong> <strong>Employment</strong>, <strong>Training</strong> <strong>and</strong> <strong>Rehabilitation</strong><br />
2011 General Client Satisfaction Survey<br />
Yes No Don't Know/Refused Total<br />
N % C.I.(95%) N % C.I.(95%) N % C.I.(95%) N % C.I.(95%)<br />
Overall Total Total 117 47.6% (41.2-54.1) 129 51.6% (45.1-58.0) 2 0.8% (0.0-1.9) 248 100.0% (_-_)<br />
Gender Male 55 48.0% (38.7-57.3) 60 51.2% (41.8-60.5) 1 0.8% (0.0-2.5) 116 46.8% (40.3-53.2)<br />
Female 62 47.3% (38.4-56.3) 69 51.9% (42.9-60.8) 1 0.8% (0.0-2.3) 132 53.2% (46.8-59.7)<br />
Total 117 47.6% (41.2-54.1) 129 51.6% (45.1-58.0) 2 0.8% (0.0-1.9) 248 100.0% (_-_)<br />
Age
Table Q16c: Benefits: Health Insurance<br />
Q16c<br />
167<br />
Nevada <strong>Department</strong> <strong>of</strong> <strong>Employment</strong>, <strong>Training</strong> <strong>and</strong> <strong>Rehabilitation</strong><br />
2011 General Client Satisfaction Survey<br />
Yes No Don't Know/Refused Total<br />
N % C.I.(95%) N % C.I.(95%) N % C.I.(95%) N % C.I.(95%)<br />
Ever received any transportation services Yes 43 40.3% (30.7-49.9) 61 58.8% (49.1-68.5) 1 0.9% (0.0-2.7) 105 43.7% (37.2-50.1)<br />
No 72 52.6% (44.0-61.2) 68 46.7% (38.1-55.3) 1 0.7% (0.0-2.2) 141 56.3% (49.9-62.8)<br />
Total 115 47.2% (40.7-53.7) 129 52.0% (45.5-58.5) 2 0.8% (0.0-1.9) 246 100.0% (_-_)<br />
Currently Employed Yes 117 47.6% (41.2-54.1) 129 51.6% (45.1-58.0) 2 0.8% (0.0-1.9) 248 100.0% (_-_)
Table Q16d: Benefits: Paid sick leave<br />
Q16d<br />
168<br />
Nevada <strong>Department</strong> <strong>of</strong> <strong>Employment</strong>, <strong>Training</strong> <strong>and</strong> <strong>Rehabilitation</strong><br />
2011 General Client Satisfaction Survey<br />
Yes No Don't Know/Refused Total<br />
N % C.I.(95%) N % C.I.(95%) N % C.I.(95%) N % C.I.(95%)<br />
Overall Total Total 93 37.6% (31.4-43.9) 144 57.4% (51.0-63.8) 11 4.9% (1.9-8.0) 248 100.0% (_-_)<br />
Gender Male 51 44.5% (35.2-53.8) 60 51.4% (42.1-60.7) 5 4.1% (0.5-7.6) 116 46.8% (40.3-53.2)<br />
Female 42 31.5% (23.3-39.8) 84 62.7% (54.0-71.4) 6 5.7% (1.0-10.5) 132 53.2% (46.8-59.7)<br />
Total 93 37.6% (31.4-43.9) 144 57.4% (51.0-63.8) 11 4.9% (1.9-8.0) 248 100.0% (_-_)<br />
Age
Table Q16d: Benefits: Paid sick leave<br />
Q16d<br />
169<br />
Nevada <strong>Department</strong> <strong>of</strong> <strong>Employment</strong>, <strong>Training</strong> <strong>and</strong> <strong>Rehabilitation</strong><br />
2011 General Client Satisfaction Survey<br />
Yes No Don't Know/Refused Total<br />
N % C.I.(95%) N % C.I.(95%) N % C.I.(95%) N % C.I.(95%)<br />
Ever received any transportation services Yes 35 31.6% (22.6-40.6) 66 64.4% (55.0-73.7) 4 4.0% (0.1-7.9) 105 43.7% (37.2-50.1)<br />
No 56 41.4% (32.8-49.9) 78 52.9% (44.3-61.5) 7 5.8% (1.2-10.3) 141 56.3% (49.9-62.8)<br />
Total 91 37.1% (30.8-43.4) 144 57.9% (51.5-64.3) 11 5.0% (1.9-8.0) 246 100.0% (_-_)<br />
Currently Employed Yes 93 37.6% (31.4-43.9) 144 57.4% (51.0-63.8) 11 4.9% (1.9-8.0) 248 100.0% (_-_)
Table Q16e: "Benefits: Retirement plan<br />
Q16e<br />
170<br />
Nevada <strong>Department</strong> <strong>of</strong> <strong>Employment</strong>, <strong>Training</strong> <strong>and</strong> <strong>Rehabilitation</strong><br />
2011 General Client Satisfaction Survey<br />
Yes No Don't Know/Refused Total<br />
N % C.I.(95%) N % C.I.(95%) N % C.I.(95%) N % C.I.(95%)<br />
Overall Total Total 93 38.9% (32.6-45.3) 149 58.8% (52.4-65.2) 5 2.3% (0.3-4.3) 247 100.0% (_-_)<br />
Gender Male 41 36.7% (27.6-45.7) 71 60.4% (51.2-69.6) 3 2.9% (0.0-6.3) 115 46.5% (40.1-53.0)<br />
Female 52 40.9% (32.1-49.8) 78 57.4% (48.5-66.3) 2 1.7% (0.0-4.1) 132 53.5% (47.0-59.9)<br />
Total 93 38.9% (32.6-45.3) 149 58.8% (52.4-65.2) 5 2.3% (0.3-4.3) 247 100.0% (_-_)<br />
Age
Table Q16e: "Benefits: Retirement plan<br />
Q16e<br />
171<br />
Nevada <strong>Department</strong> <strong>of</strong> <strong>Employment</strong>, <strong>Training</strong> <strong>and</strong> <strong>Rehabilitation</strong><br />
2011 General Client Satisfaction Survey<br />
Yes No Don't Know/Refused Total<br />
N % C.I.(95%) N % C.I.(95%) N % C.I.(95%) N % C.I.(95%)<br />
Ever received any transportation services Yes 36 33.6% (24.3-42.8) 66 63.4% (54.0-72.9) 3 3.0% (0.0-6.5) 105 43.9% (37.4-50.3)<br />
No 56 43.0% (34.3-51.6) 82 55.3% (46.6-64.0) 2 1.7% (0.0-4.1) 140 56.1% (49.7-62.6)<br />
Total 92 38.8% (32.5-45.2) 148 58.9% (52.4-65.3) 5 2.3% (0.3-4.3) 245 100.0% (_-_)<br />
Currently Employed Yes 93 38.9% (32.6-45.3) 149 58.8% (52.4-65.2) 5 2.3% (0.3-4.3) 247 100.0% (_-_)
Table Q16f: Benefits: Meals<br />
Q16f<br />
172<br />
Nevada <strong>Department</strong> <strong>of</strong> <strong>Employment</strong>, <strong>Training</strong> <strong>and</strong> <strong>Rehabilitation</strong><br />
2011 General Client Satisfaction Survey<br />
Yes No Don't Know/Refused Total<br />
N % C.I.(95%) N % C.I.(95%) N % C.I.(95%) N % C.I.(95%)<br />
Overall Total Total 31 12.8% (8.4-17.2) 215 86.3% (81.8-90.9) 2 0.9% (0.0-2.2) 248 100.0% (_-_)<br />
Gender Male 10 8.7% (3.4-14.0) 106 91.3% (86.0-96.6) 0 . (.-.) 116 46.8% (40.3-53.2)<br />
Female 21 16.4% (9.6-23.2) 109 81.9% (74.9-89.0) 2 1.7% (0.0-4.0) 132 53.2% (46.8-59.7)<br />
Total 31 12.8% (8.4-17.2) 215 86.3% (81.8-90.9) 2 0.9% (0.0-2.2) 248 100.0% (_-_)<br />
Age
Table Q16f: Benefits: Meals<br />
Q16f<br />
173<br />
Nevada <strong>Department</strong> <strong>of</strong> <strong>Employment</strong>, <strong>Training</strong> <strong>and</strong> <strong>Rehabilitation</strong><br />
2011 General Client Satisfaction Survey<br />
Yes No Don't Know/Refused Total<br />
N % C.I.(95%) N % C.I.(95%) N % C.I.(95%) N % C.I.(95%)<br />
Ever received any transportation services Yes 11 11.1% (4.8-17.4) 94 88.9% (82.6-95.2) 0 . (.-.) 105 43.7% (37.2-50.1)<br />
No 20 14.3% (8.1-20.5) 119 84.1% (77.6-90.5) 2 1.6% (0.0-3.8) 141 56.3% (49.9-62.8)<br />
Total 31 12.9% (8.5-17.4) 213 86.2% (81.6-90.8) 2 0.9% (0.0-2.2) 246 100.0% (_-_)<br />
Currently Employed Yes 31 12.8% (8.4-17.2) 215 86.3% (81.8-90.9) 2 0.9% (0.0-2.2) 248 100.0% (_-_)
Table Q16g: Benefits: Daycare<br />
Q16g<br />
174<br />
Nevada <strong>Department</strong> <strong>of</strong> <strong>Employment</strong>, <strong>Training</strong> <strong>and</strong> <strong>Rehabilitation</strong><br />
2011 General Client Satisfaction Survey<br />
Yes No Don't Know/Refused Total<br />
N % C.I.(95%) N % C.I.(95%) N % C.I.(95%) N % C.I.(95%)<br />
Overall Total Total 4 1.6% (0.0-3.2) 242 97.7% (95.8-99.6) 2 0.7% (0.0-1.7) 248 100.0% (_-_)<br />
Gender Male 0 . (.-.) 114 98.5% (96.3-100.0) 2 1.5% (0.0-3.7) 116 46.8% (40.3-53.2)<br />
Female 4 3.0% (0.0-6.0) 128 97.0% (94.0-100.0) 0 . (.-.) 132 53.2% (46.8-59.7)<br />
Total 4 1.6% (0.0-3.2) 242 97.7% (95.8-99.6) 2 0.7% (0.0-1.7) 248 100.0% (_-_)<br />
Age
Table Q16g: Benefits: Daycare<br />
Q16g<br />
175<br />
Nevada <strong>Department</strong> <strong>of</strong> <strong>Employment</strong>, <strong>Training</strong> <strong>and</strong> <strong>Rehabilitation</strong><br />
2011 General Client Satisfaction Survey<br />
Yes No Don't Know/Refused Total<br />
N % C.I.(95%) N % C.I.(95%) N % C.I.(95%) N % C.I.(95%)<br />
Ever received any transportation services Yes 2 1.8% (0.0-4.4) 101 96.5% (93.1-100.0) 2 1.7% (0.0-4.0) 105 43.7% (37.2-50.1)<br />
No 2 1.4% (0.0-3.5) 139 98.6% (96.5-100.0) 0 . (.-.) 141 56.3% (49.9-62.8)<br />
Total 4 1.6% (0.0-3.2) 240 97.7% (95.8-99.6) 2 0.7% (0.0-1.7) 246 100.0% (_-_)<br />
Currently Employed Yes 4 1.6% (0.0-3.2) 242 97.7% (95.8-99.6) 2 0.7% (0.0-1.7) 248 100.0% (_-_)
Table Q16h: Benefits: Clothes/Uniform allowance<br />
Q16h<br />
176<br />
Nevada <strong>Department</strong> <strong>of</strong> <strong>Employment</strong>, <strong>Training</strong> <strong>and</strong> <strong>Rehabilitation</strong><br />
2011 General Client Satisfaction Survey<br />
Yes No Total<br />
N % C.I.(95%) N % C.I.(95%) N % C.I.(95%)<br />
Overall Total Total 59 23.5% (18.1-28.9) 189 76.5% (71.1-81.9) 248 100.0% (_-_)<br />
Gender Male 19 15.7% (9.0-22.3) 97 84.3% (77.7-91.0) 116 46.8% (40.3-53.2)<br />
Female 40 30.4% (22.3-38.6) 92 69.6% (61.4-77.7) 132 53.2% (46.8-59.7)<br />
Total 59 23.5% (18.1-28.9) 189 76.5% (71.1-81.9) 248 100.0% (_-_)<br />
Age
Table Q16h: Benefits: Clothes/Uniform allowance<br />
Q16h<br />
177<br />
Nevada <strong>Department</strong> <strong>of</strong> <strong>Employment</strong>, <strong>Training</strong> <strong>and</strong> <strong>Rehabilitation</strong><br />
2011 General Client Satisfaction Survey<br />
Yes No Total<br />
N % C.I.(95%) N % C.I.(95%) N % C.I.(95%)<br />
Ever received any transportation services Yes 25 24.0% (15.6-32.4) 80 76.0% (67.6-84.4) 105 43.7% (37.2-50.1)<br />
No 34 23.5% (16.3-30.7) 107 76.5% (69.3-83.7) 141 56.3% (49.9-62.8)<br />
Total 59 23.7% (18.3-29.2) 187 76.3% (70.8-81.7) 246 100.0% (_-_)<br />
Currently Employed Yes 59 23.5% (18.1-28.9) 189 76.5% (71.1-81.9) 248 100.0% (_-_)
Table Q16i: Benefits: Other<br />
Q16i<br />
178<br />
Nevada <strong>Department</strong> <strong>of</strong> <strong>Employment</strong>, <strong>Training</strong> <strong>and</strong> <strong>Rehabilitation</strong><br />
2011 General Client Satisfaction Survey<br />
Yes No Don't Know/Refused Total<br />
N % C.I.(95%) N % C.I.(95%) N % C.I.(95%) N % C.I.(95%)<br />
Overall Total Total 14 6.5% (3.1-9.9) 202 92.6% (89.0-96.2) 2 1.0% (0.0-2.3) 218 100.0% (_-_)<br />
Gender Male 5 5.2% (0.6-9.8) 95 93.5% (88.3-98.6) 1 1.3% (0.0-3.8) 101 45.6% (38.8-52.5)<br />
Female 9 7.5% (2.6-12.4) 107 91.8% (86.7-96.9) 1 0.7% (0.0-2.1) 117 54.4% (47.5-61.2)<br />
Total 14 6.5% (3.1-9.9) 202 92.6% (89.0-96.2) 2 1.0% (0.0-2.3) 218 100.0% (_-_)<br />
Age
Table Q16i: Benefits: Other<br />
Q16i<br />
179<br />
Nevada <strong>Department</strong> <strong>of</strong> <strong>Employment</strong>, <strong>Training</strong> <strong>and</strong> <strong>Rehabilitation</strong><br />
2011 General Client Satisfaction Survey<br />
Yes No Don't Know/Refused Total<br />
N % C.I.(95%) N % C.I.(95%) N % C.I.(95%) N % C.I.(95%)<br />
Ever received any transportation services Yes 8 8.8% (2.8-14.7) 83 89.9% (83.5-96.3) 1 1.3% (0.0-4.0) 92 43.5% (36.6-50.4)<br />
No 6 4.8% (0.9-8.7) 117 94.5% (90.4-98.7) 1 0.7% (0.0-2.0) 124 56.5% (49.6-63.4)<br />
Total 14 6.5% (3.1-10.0) 200 92.5% (88.9-96.2) 2 1.0% (0.0-2.3) 216 100.0% (_-_)<br />
Currently Employed Yes 14 6.5% (3.1-9.9) 202 92.6% (89.0-96.2) 2 1.0% (0.0-2.3) 218 100.0% (_-_)
Table Q17a: I got the kind <strong>of</strong> job I wanted.<br />
Q17a<br />
Strongly Disagree Somewhat Disagree<br />
180<br />
Nevada <strong>Department</strong> <strong>of</strong> <strong>Employment</strong>, <strong>Training</strong> <strong>and</strong> <strong>Rehabilitation</strong><br />
2011 General Client Satisfaction Survey<br />
Neither Agree Nor<br />
Disagree Somewhat Agree Strongly Agree Don't Know/Refused Total<br />
N % C.I.(95%) N % C.I.(95%) N % C.I.(95%) N % C.I.(95%) N % C.I.(95%) N % C.I.(95%) N % C.I.(95%)<br />
Overall Total Total 28 11.6% (7.5-15.8) 18 7.8% (4.2-11.5) 25 10.4% (6.5-14.4) 56 23.6% (18.0-29.2) 116 45.1% (38.7-51.5) 4 1.4% (0.0-2.9) 247 100.0% (_-_)<br />
Gender Male 13 12.0% (5.8-18.3) 10 8.1% (3.2-13.0) 12 10.1% (4.5-15.6) 28 25.1% (16.9-33.3) 53 44.7% (35.5-54.0) 0 . (.-.) 116 46.9% (40.5-53.4)<br />
Female 15 11.3% (5.7-16.9) 8 7.6% (2.2-12.9) 13 10.7% (5.1-16.4) 28 22.3% (14.6-30.0) 63 45.4% (36.5-54.2) 4 2.7% (0.0-5.4) 131 53.1% (46.6-59.5)<br />
Total 28 11.6% (7.5-15.8) 18 7.8% (4.2-11.5) 25 10.4% (6.5-14.4) 56 23.6% (18.0-29.2) 116 45.1% (38.7-51.5) 4 1.4% (0.0-2.9) 247 100.0% (_-_)<br />
Age
Table Q17a: I got the kind <strong>of</strong> job I wanted.<br />
Q17a<br />
Ever received any assistive<br />
technology<br />
Ever received any transportation<br />
services<br />
Strongly Disagree Somewhat Disagree<br />
181<br />
Nevada <strong>Department</strong> <strong>of</strong> <strong>Employment</strong>, <strong>Training</strong> <strong>and</strong> <strong>Rehabilitation</strong><br />
2011 General Client Satisfaction Survey<br />
Neither Agree Nor<br />
Disagree Somewhat Agree Strongly Agree Don't Know/Refused Total<br />
N % C.I.(95%) N % C.I.(95%) N % C.I.(95%) N % C.I.(95%) N % C.I.(95%) N % C.I.(95%) N % C.I.(95%)<br />
Yes 19 12.2% (6.9-17.5) 13 8.6% (3.9-13.4) 16 10.3% (5.4-15.2) 32 20.8% (14.1-27.5) 81 47.1% (39.1-55.0) 2 1.0% (0.0-2.3) 163 65.4% (59.3-71.6)<br />
No 9 10.6% (3.9-17.2) 5 6.3% (0.8-11.8) 9 10.6% (3.9-17.3) 24 28.9% (18.9-39.0) 35 41.3% (30.5-52.1) 2 2.3% (0.0-5.6) 84 34.6% (28.4-40.7)<br />
Total 28 11.6% (7.5-15.8) 18 7.8% (4.2-11.5) 25 10.4% (6.5-14.4) 56 23.6% (18.0-29.2) 116 45.1% (38.7-51.5) 4 1.4% (0.0-2.9) 247 100.0% (_-_)<br />
Yes 15 15.0% (7.8-22.2) 10 9.2% (3.6-14.8) 8 7.8% (2.5-13.1) 23 23.0% (14.5-31.5) 48 44.9% (35.1-54.8) 0 . (.-.) 104 43.5% (37.0-49.9)<br />
No 13 9.2% (4.3-14.1) 7 6.1% (1.4-10.9) 17 12.6% (6.8-18.3) 32 23.7% (16.2-31.2) 68 45.8% (37.3-54.4) 4 2.5% (0.0-5.1) 141 56.5% (50.1-63.0)<br />
Total 28 11.7% (7.5-15.9) 17 7.5% (3.9-11.1) 25 10.5% (6.5-14.5) 55 23.4% (17.8-29.0) 116 45.4% (39.0-51.9) 4 1.4% (0.0-2.9) 245 100.0% (_-_)<br />
Currently Employed Yes 28 11.6% (7.5-15.8) 18 7.8% (4.2-11.5) 25 10.4% (6.5-14.4) 56 23.6% (18.0-29.2) 116 45.1% (38.7-51.5) 4 1.4% (0.0-2.9) 247 100.0% (_-_)
Table Q17b: I like the job that I have now.<br />
Q17b<br />
Strongly Disagree Somewhat Disagree<br />
182<br />
Nevada <strong>Department</strong> <strong>of</strong> <strong>Employment</strong>, <strong>Training</strong> <strong>and</strong> <strong>Rehabilitation</strong><br />
2011 General Client Satisfaction Survey<br />
Neither Agree Nor<br />
Disagree Somewhat Agree Strongly Agree Don't Know/Refused Total<br />
N % C.I.(95%) N % C.I.(95%) N % C.I.(95%) N % C.I.(95%) N % C.I.(95%) N % C.I.(95%) N % C.I.(95%)<br />
Overall Total Total 10 4.4% (1.7-7.1) 13 5.4% (2.5-8.4) 21 9.8% (5.7-13.9) 67 27.6% (21.7-33.4) 132 51.6% (45.1-58.1) 3 1.2% (0.0-2.6) 246 100.0% (_-_)<br />
Gender Male 7 6.6% (1.8-11.5) 6 4.7% (0.9-8.4) 8 7.1% (2.3-11.8) 33 29.1% (20.6-37.6) 60 51.7% (42.3-61.0) 1 0.9% (0.0-2.6) 115 46.6% (40.2-53.1)<br />
Female 3 2.4% (0.0-5.1) 7 6.1% (1.6-10.6) 13 12.2% (5.7-18.6) 34 26.2% (18.2-34.2) 72 51.6% (42.6-60.6) 2 1.5% (0.0-3.7) 131 53.4% (46.9-59.8)<br />
Total 10 4.4% (1.7-7.1) 13 5.4% (2.5-8.4) 21 9.8% (5.7-13.9) 67 27.6% (21.7-33.4) 132 51.6% (45.1-58.1) 3 1.2% (0.0-2.6) 246 100.0% (_-_)<br />
Age
Table Q17b: I like the job that I have now.<br />
Q17b<br />
Ever received any transportation<br />
services<br />
Strongly Disagree Somewhat Disagree<br />
183<br />
Nevada <strong>Department</strong> <strong>of</strong> <strong>Employment</strong>, <strong>Training</strong> <strong>and</strong> <strong>Rehabilitation</strong><br />
2011 General Client Satisfaction Survey<br />
Neither Agree Nor<br />
Disagree Somewhat Agree Strongly Agree Don't Know/Refused Total<br />
N % C.I.(95%) N % C.I.(95%) N % C.I.(95%) N % C.I.(95%) N % C.I.(95%) N % C.I.(95%) N % C.I.(95%)<br />
Yes 6 6.3% (1.3-11.3) 6 5.7% (1.1-10.3) 10 10.6% (4.3-16.9) 24 22.2% (14.1-30.3) 56 53.9% (44.0-63.8) 1 1.3% (0.0-3.9) 103 43.2% (36.7-49.7)<br />
No 4 3.0% (0.1-5.9) 7 5.3% (1.4-9.2) 11 9.3% (3.8-14.8) 41 30.6% (22.5-38.7) 76 50.7% (42.0-59.3) 2 1.1% (0.0-2.8) 141 56.8% (50.3-63.3)<br />
Total 10 4.4% (1.7-7.1) 13 5.5% (2.5-8.5) 21 9.9% (5.7-14.0) 65 27.0% (21.1-32.8) 132 52.1% (45.5-58.6) 3 1.2% (0.0-2.7) 244 100.0% (_-_)<br />
Currently Employed Yes 10 4.4% (1.7-7.1) 13 5.4% (2.5-8.4) 21 9.8% (5.7-13.9) 67 27.6% (21.7-33.4) 132 51.6% (45.1-58.1) 3 1.2% (0.0-2.6) 246 100.0% (_-_)
Table Q17c: I feel that I have the skills necessary to keep the job that I have now.<br />
Q17c<br />
Strongly Disagree Somewhat Disagree<br />
184<br />
Nevada <strong>Department</strong> <strong>of</strong> <strong>Employment</strong>, <strong>Training</strong> <strong>and</strong> <strong>Rehabilitation</strong><br />
2011 General Client Satisfaction Survey<br />
Neither Agree Nor<br />
Disagree Somewhat Agree Strongly Agree Don't Know/Refused Total<br />
N % C.I.(95%) N % C.I.(95%) N % C.I.(95%) N % C.I.(95%) N % C.I.(95%) N % C.I.(95%) N % C.I.(95%)<br />
Overall Total Total 3 1.3% (0.0-2.8) 5 2.3% (0.3-4.3) 10 4.3% (1.6-6.9) 37 16.6% (11.6-21.6) 190 74.9% (69.2-80.6) 2 0.6% (0.0-1.5) 247 100.0% (_-_)<br />
Gender Male 2 2.0% (0.0-4.7) 4 3.8% (0.1-7.5) 8 7.2% (2.3-12.1) 16 14.3% (7.7-20.8) 85 71.9% (63.5-80.4) 1 0.8% (0.0-2.5) 116 46.9% (40.5-53.4)<br />
Female 1 0.7% (0.0-2.2) 1 1.0% (0.0-2.8) 2 1.7% (0.0-4.1) 21 18.7% (11.4-26.0) 105 77.5% (69.8-85.3) 1 0.4% (0.0-1.3) 131 53.1% (46.6-59.5)<br />
Total 3 1.3% (0.0-2.8) 5 2.3% (0.3-4.3) 10 4.3% (1.6-6.9) 37 16.6% (11.6-21.6) 190 74.9% (69.2-80.6) 2 0.6% (0.0-1.5) 247 100.0% (_-_)<br />
Age
Table Q17c: I feel that I have the skills necessary to keep the job that I have now.<br />
Q17c<br />
Ever received any transportation<br />
services<br />
Strongly Disagree Somewhat Disagree<br />
185<br />
Nevada <strong>Department</strong> <strong>of</strong> <strong>Employment</strong>, <strong>Training</strong> <strong>and</strong> <strong>Rehabilitation</strong><br />
2011 General Client Satisfaction Survey<br />
Neither Agree Nor<br />
Disagree Somewhat Agree Strongly Agree Don't Know/Refused Total<br />
N % C.I.(95%) N % C.I.(95%) N % C.I.(95%) N % C.I.(95%) N % C.I.(95%) N % C.I.(95%) N % C.I.(95%)<br />
Yes 2 2.1% (0.0-5.1) 2 2.3% (0.0-5.4) 6 6.2% (1.3-11.0) 20 20.6% (12.5-28.7) 73 67.9% (58.6-77.3) 1 0.9% (0.0-2.7) 104 43.5% (37.0-49.9)<br />
No 1 0.7% (0.0-2.1) 3 2.3% (0.0-5.0) 4 2.9% (0.0-5.8) 17 13.8% (7.5-20.0) 115 79.9% (72.8-87.0) 1 0.4% (0.0-1.2) 141 56.5% (50.1-63.0)<br />
Total 3 1.3% (0.0-2.8) 5 2.3% (0.3-4.3) 10 4.3% (1.7-7.0) 37 16.7% (11.7-21.7) 188 74.7% (68.9-80.4) 2 0.6% (0.0-1.5) 245 100.0% (_-_)<br />
Currently Employed Yes 3 1.3% (0.0-2.8) 5 2.3% (0.3-4.3) 10 4.3% (1.6-6.9) 37 16.6% (11.6-21.6) 190 74.9% (69.2-80.6) 2 0.6% (0.0-1.5) 247 100.0% (_-_)
186<br />
Nevada <strong>Department</strong> <strong>of</strong> <strong>Employment</strong>, <strong>Training</strong> <strong>and</strong> <strong>Rehabilitation</strong><br />
2011 General Client Satisfaction Survey<br />
Table Q17d: The Vocational <strong>Rehabilitation</strong> Program provided me with the services I needed to GET the job that I have now.<br />
Q17d<br />
Strongly Disagree Somewhat Disagree<br />
Neither Agree Nor<br />
Disagree Somewhat Agree Strongly Agree Don't Know/Refused Total<br />
N % C.I.(95%) N % C.I.(95%) N % C.I.(95%) N % C.I.(95%) N % C.I.(95%) N % C.I.(95%) N % C.I.(95%)<br />
Overall Total Total 75 29.6% (23.8-35.5) 13 5.2% (2.4-8.1) 28 11.5% (7.3-15.7) 34 13.9% (9.3-18.4) 94 38.8% (32.5-45.1) 3 0.9% (0.0-2.0) 247 100.0% (_-_)<br />
Gender Male 36 30.6% (22.1-39.2) 8 6.6% (2.0-11.1) 15 14.0% (7.2-20.8) 16 14.1% (7.6-20.6) 41 34.7% (25.9-43.6) 0 . (.-.) 116 46.9% (40.5-53.4)<br />
Female 39 28.8% (20.8-36.8) 5 4.0% (0.4-7.6) 13 9.4% (4.3-14.5) 18 13.7% (7.4-20.0) 53 42.4% (33.5-51.3) 3 1.7% (0.0-3.7) 131 53.1% (46.6-59.5)<br />
Total 75 29.6% (23.8-35.5) 13 5.2% (2.4-8.1) 28 11.5% (7.3-15.7) 34 13.9% (9.3-18.4) 94 38.8% (32.5-45.1) 3 0.9% (0.0-2.0) 247 100.0% (_-_)<br />
Age
187<br />
Nevada <strong>Department</strong> <strong>of</strong> <strong>Employment</strong>, <strong>Training</strong> <strong>and</strong> <strong>Rehabilitation</strong><br />
2011 General Client Satisfaction Survey<br />
Table Q17d: The Vocational <strong>Rehabilitation</strong> Program provided me with the services I needed to GET the job that I have now.<br />
Q17d<br />
Ever received any transportation<br />
services<br />
Strongly Disagree Somewhat Disagree<br />
Neither Agree Nor<br />
Disagree Somewhat Agree Strongly Agree Don't Know/Refused Total<br />
N % C.I.(95%) N % C.I.(95%) N % C.I.(95%) N % C.I.(95%) N % C.I.(95%) N % C.I.(95%) N % C.I.(95%)<br />
Yes 26 24.6% (16.2-33.1) 5 5.0% (0.5-9.4) 12 12.5% (5.6-19.3) 17 16.7% (9.3-24.1) 43 40.6% (30.9-50.3) 1 0.7% (0.0-2.0) 104 43.5% (37.0-49.9)<br />
No 49 33.9% (25.9-42.0) 8 5.5% (1.7-9.3) 15 10.3% (5.1-15.4) 17 11.9% (6.2-17.6) 50 37.3% (28.8-45.7) 2 1.1% (0.0-2.7) 141 56.5% (50.1-63.0)<br />
Total 75 29.9% (24.0-35.8) 13 5.3% (2.4-8.1) 27 11.2% (7.1-15.4) 34 14.0% (9.4-18.6) 93 38.7% (32.3-45.1) 3 0.9% (0.0-2.0) 245 100.0% (_-_)<br />
Currently Employed Yes 75 29.6% (23.8-35.5) 13 5.2% (2.4-8.1) 28 11.5% (7.3-15.7) 34 13.9% (9.3-18.4) 94 38.8% (32.5-45.1) 3 0.9% (0.0-2.0) 247 100.0% (_-_)
188<br />
Nevada <strong>Department</strong> <strong>of</strong> <strong>Employment</strong>, <strong>Training</strong> <strong>and</strong> <strong>Rehabilitation</strong><br />
2011 General Client Satisfaction Survey<br />
Table Q17e: The Vocational <strong>Rehabilitation</strong> Program provided me with the services that I need to KEEP the job that I have now.<br />
Q17e<br />
Strongly<br />
Disagree Somewhat Disagree<br />
Neither Agree Nor<br />
Disagree Somewhat Agree Strongly Agree Don't Know/Refused Total<br />
N % C.I.(95%) N % C.I.(95%) N % C.I.(95%) N % C.I.(95%) N % C.I.(95%) N % C.I.(95%) N % C.I.(95%)<br />
Overall Total Total 51 20.3% (15.1-25.4) 21 8.6% (5.0-12.2) 20 8.6% (4.8-12.4) 40 16.3% (11.5-21.1) 112 45.2% (38.7-51.6) 3 1.1% (0.0-2.3) 247 100.0% (_-_)<br />
Gender Male 22 19.0% (11.7-26.4) 17 15.1% (8.4-21.8) 9 7.1% (2.5-11.7) 20 17.8% (10.5-25.0) 47 40.3% (31.1-49.4) 1 0.7% (0.0-2.0) 116 46.9% (40.5-53.4)<br />
Female 29 21.3% (14.1-28.5) 4 2.9% (0.0-5.8) 11 9.9% (4.0-15.7) 20 15.0% (8.7-21.3) 65 49.5% (40.5-58.5) 2 1.4% (0.0-3.4) 131 53.1% (46.6-59.5)<br />
Total 51 20.3% (15.1-25.4) 21 8.6% (5.0-12.2) 20 8.6% (4.8-12.4) 40 16.3% (11.5-21.1) 112 45.2% (38.7-51.6) 3 1.1% (0.0-2.3) 247 100.0% (_-_)<br />
Age
189<br />
Nevada <strong>Department</strong> <strong>of</strong> <strong>Employment</strong>, <strong>Training</strong> <strong>and</strong> <strong>Rehabilitation</strong><br />
2011 General Client Satisfaction Survey<br />
Table Q17e: The Vocational <strong>Rehabilitation</strong> Program provided me with the services that I need to KEEP the job that I have now.<br />
Q17e<br />
Ever received any assistive<br />
technology<br />
Ever received any transportation<br />
services<br />
Strongly<br />
Disagree Somewhat Disagree<br />
Neither Agree Nor<br />
Disagree Somewhat Agree Strongly Agree Don't Know/Refused Total<br />
N % C.I.(95%) N % C.I.(95%) N % C.I.(95%) N % C.I.(95%) N % C.I.(95%) N % C.I.(95%) N % C.I.(95%)<br />
Yes 31 18.0% (12.0-24.0) 14 8.8% (4.3-13.3) 13 8.8% (3.9-13.7) 23 13.6% (8.3-19.0) 81 50.4% (42.4-58.4) 1 0.3% (0.0-1.0) 163 65.4% (59.3-71.6)<br />
No 20 24.5% (15.0-34.0) 7 8.3% (2.3-14.4) 7 8.1% (2.3-14.0) 17 21.4% (12.1-30.7) 31 35.3% (24.8-45.7) 2 2.4% (0.0-5.8) 84 34.6% (28.4-40.7)<br />
Total 51 20.3% (15.1-25.4) 21 8.6% (5.0-12.2) 20 8.6% (4.8-12.4) 40 16.3% (11.5-21.1) 112 45.2% (38.7-51.6) 3 1.1% (0.0-2.3) 247 100.0% (_-_)<br />
Yes 20 18.9% (11.2-26.5) 9 9.0% (3.3-14.8) 10 9.6% (3.7-15.4) 20 19.2% (11.4-27.1) 44 42.1% (32.3-51.9) 1 1.2% (0.0-3.5) 104 43.5% (37.0-49.9)<br />
No 31 21.6% (14.6-28.6) 11 7.7% (3.2-12.2) 10 7.9% (2.8-13.0) 20 14.3% (8.3-20.3) 67 47.5% (38.8-56.1) 2 1.0% (0.0-2.4) 141 56.5% (50.1-63.0)<br />
Total 51 20.4% (15.2-25.6) 20 8.3% (4.7-11.9) 20 8.6% (4.8-12.5) 40 16.4% (11.6-21.3) 111 45.1% (38.7-51.6) 3 1.1% (0.0-2.3) 245 100.0% (_-_)<br />
Currently Employed Yes 51 20.3% (15.1-25.4) 21 8.6% (5.0-12.2) 20 8.6% (4.8-12.4) 40 16.3% (11.5-21.1) 112 45.2% (38.7-51.6) 3 1.1% (0.0-2.3) 247 100.0% (_-_)
Table Q18: What is the MAIN REASON you are not currently employed?<br />
Q18 Attending school Volunteering<br />
190<br />
Nevada <strong>Department</strong> <strong>of</strong> <strong>Employment</strong>, <strong>Training</strong> <strong>and</strong> <strong>Rehabilitation</strong><br />
2011 General Client Satisfaction Survey<br />
Employer could not<br />
accommodate my<br />
disability<br />
Fired or laid <strong>of</strong>f from<br />
previous job Could not find any job<br />
N % C.I.(95%) N % C.I.(95%) N % C.I.(95%) N % C.I.(95%) N % C.I.(95%)<br />
Overall Total Total 14 6.3% (2.9-9.7) 1 0.4% (0.0-1.2) 16 6.2% (3.2-9.2) 53 20.8% (15.6-26.1) 47 18.3% (13.3-23.2)<br />
Gender Male 6 4.4% (0.8-7.9) 1 0.8% (0.0-2.3) 10 7.5% (2.9-12.1) 28 21.4% (13.9-28.8) 21 15.6% (9.2-22.0)<br />
Female 8 8.3% (2.6-14.0) 0 . (.-.) 6 4.7% (0.9-8.5) 25 20.3% (12.9-27.6) 26 21.0% (13.6-28.4)<br />
Total 14 6.3% (2.9-9.7) 1 0.4% (0.0-1.2) 16 6.2% (3.2-9.2) 53 20.8% (15.6-26.1) 47 18.3% (13.3-23.2)<br />
Age
Table Q18: What is the MAIN REASON you are not currently employed?<br />
Q18 Attending school Volunteering<br />
191<br />
Nevada <strong>Department</strong> <strong>of</strong> <strong>Employment</strong>, <strong>Training</strong> <strong>and</strong> <strong>Rehabilitation</strong><br />
2011 General Client Satisfaction Survey<br />
Employer could not<br />
accommodate my<br />
disability<br />
Fired or laid <strong>of</strong>f from<br />
previous job Could not find any job<br />
N % C.I.(95%) N % C.I.(95%) N % C.I.(95%) N % C.I.(95%) N % C.I.(95%)<br />
Ever received any assistive technology Yes 6 4.4% (0.8-8.0) 0 . (.-.) 8 5.5% (1.7-9.3) 29 20.5% (13.5-27.6) 22 15.3% (9.1-21.5)<br />
No 8 8.6% (2.6-14.5) 1 0.9% (0.0-2.5) 8 7.0% (2.2-11.7) 24 21.2% (13.3-29.0) 25 21.8% (14.0-29.5)<br />
Total 14 6.3% (2.9-9.7) 1 0.4% (0.0-1.2) 16 6.2% (3.2-9.2) 53 20.8% (15.6-26.1) 47 18.3% (13.3-23.2)<br />
Ever received any transportation services Yes 7 7.7% (1.9-13.5) 0 . (.-.) 8 6.9% (2.1-11.7) 25 21.7% (13.6-29.9) 28 24.8% (16.2-33.4)<br />
No 7 5.2% (1.4-9.1) 1 0.7% (0.0-2.1) 8 5.6% (1.8-9.5) 28 20.3% (13.4-27.2) 19 13.1% (7.5-18.7)<br />
Total 14 6.3% (3.0-9.7) 1 0.4% (0.0-1.2) 16 6.2% (3.2-9.2) 53 20.9% (15.7-26.2) 47 18.4% (13.4-23.3)<br />
Currently Employed No 14 6.3% (2.9-9.7) 1 0.4% (0.0-1.2) 16 6.2% (3.2-9.2) 53 20.8% (15.6-26.1) 47 18.3% (13.3-23.2)
192<br />
Nevada <strong>Department</strong> <strong>of</strong> <strong>Employment</strong>, <strong>Training</strong> <strong>and</strong> <strong>Rehabilitation</strong><br />
2011 General Client Satisfaction Survey<br />
Table Q21: Which <strong>of</strong> the Vocational <strong>Rehabilitation</strong> locations did you receive all OR a majority <strong>of</strong> your services from?<br />
Q21<br />
Carson City (1370<br />
South Curry Street)<br />
Carson City (1933<br />
North Carson Street) Elko (172 6th Street) Ely (1500 Ave F #1)<br />
Fallon (121 Industrial<br />
Way)<br />
Henderson (119 Water<br />
Street)<br />
N % C.I.(95%) N % C.I.(95%) N % C.I.(95%) N % C.I.(95%) N % C.I.(95%) N % C.I.(95%)<br />
Overall Total Total 2 0.4% (0.0-1.0) 31 5.8% (3.7-7.9) 15 2.5% (1.2-3.7) 16 2.4% (1.2-3.5) 19 3.5% (1.8-5.1) 28 5.8% (3.7-7.9)<br />
Gender Male 2 0.8% (0.0-2.0) 17 7.3% (3.8-10.8) 11 3.9% (1.6-6.2) 7 2.1% (0.5-3.7) 6 2.3% (0.5-4.2) 14 5.3% (2.5-8.1)<br />
Female 0 . (.-.) 14 4.3% (2.0-6.6) 4 1.1% (0.0-2.1) 9 2.6% (0.9-4.3) 13 4.6% (2.0-7.2) 14 6.3% (3.1-9.5)<br />
Total 2 0.4% (0.0-1.0) 31 5.8% (3.7-7.9) 15 2.5% (1.2-3.7) 16 2.4% (1.2-3.5) 19 3.5% (1.8-5.1) 28 5.8% (3.7-7.9)<br />
Age
193<br />
Nevada <strong>Department</strong> <strong>of</strong> <strong>Employment</strong>, <strong>Training</strong> <strong>and</strong> <strong>Rehabilitation</strong><br />
2011 General Client Satisfaction Survey<br />
Table Q21: Which <strong>of</strong> the Vocational <strong>Rehabilitation</strong> locations did you receive all OR a majority <strong>of</strong> your services from?<br />
Q21<br />
Carson City (1370<br />
South Curry Street)<br />
Carson City (1933<br />
North Carson Street) Elko (172 6th Street) Ely (1500 Ave F #1)<br />
Fallon (121 Industrial<br />
Way)<br />
Henderson (119 Water<br />
Street)<br />
N % C.I.(95%) N % C.I.(95%) N % C.I.(95%) N % C.I.(95%) N % C.I.(95%) N % C.I.(95%)<br />
Ever received any transportation services Yes 2 0.9% (0.0-2.2) 11 5.2% (1.9-8.4) 5 1.8% (0.2-3.4) 5 1.7% (0.2-3.2) 8 3.2% (1.0-5.4) 7 3.5% (0.9-6.1)<br />
No 0 . (.-.) 20 6.3% (3.5-9.1) 10 3.0% (1.1-4.9) 11 2.9% (1.2-4.7) 11 3.7% (1.4-6.0) 21 7.7% (4.5-10.9)<br />
Total 2 0.4% (0.0-1.0) 31 5.8% (3.7-7.9) 15 2.5% (1.2-3.8) 16 2.4% (1.2-3.6) 19 3.5% (1.9-5.1) 28 5.8% (3.7-8.0)<br />
Currently Employed Yes 2 0.8% (0.0-2.0) 14 5.3% (2.4-8.1) 6 1.9% (0.4-3.5) 8 2.5% (0.7-4.3) 7 2.3% (0.6-4.0) 10 4.0% (1.5-6.5)<br />
No 0 . (.-.) 17 6.2% (3.2-9.3) 9 3.0% (1.0-4.9) 8 2.2% (0.7-3.8) 12 4.5% (1.9-7.2) 18 7.4% (4.1-10.8)<br />
Total 2 0.4% (0.0-1.0) 31 5.8% (3.7-7.9) 15 2.5% (1.2-3.7) 16 2.4% (1.2-3.5) 19 3.5% (1.8-5.1) 28 5.8% (3.7-7.9)
Nevada <strong>Department</strong> <strong>of</strong> <strong>Employment</strong>, <strong>Training</strong> <strong>and</strong> <strong>Rehabilitation</strong><br />
2011 General Client Satisfaction Survey<br />
Appendix G:<br />
Open Ended<br />
Response Themes<br />
194
Nevada <strong>Department</strong> <strong>of</strong> <strong>Employment</strong>, <strong>Training</strong> <strong>and</strong> <strong>Rehabilitation</strong><br />
2011 General Client Satisfaction Survey<br />
Question 19: Based on your own experiences with the<br />
Vocational <strong>Rehabilitation</strong> Program, are there any<br />
specific CHANGES that you think could be made in<br />
order to IMPROVE the program?<br />
Improve Job Placement for the Disabled<br />
� Provide Disability Information to the Non-disabled<br />
o “They need to give people more information about people with<br />
disability because people are not treated like they should because <strong>of</strong><br />
their disability.”<br />
� More counselors with experience with disabilities<br />
o “The blind <strong>and</strong> visually impaired program: they need to hire<br />
individuals that know how to work with people who are blind. Hire<br />
people with proper credentials. My counselor was a Voc Rehab<br />
counselor- didn’t want to learn about helping blind people, either.”<br />
� Assistance with paperwork<br />
o “For h<strong>and</strong>icapped individuals, they need to have more assistance. For<br />
example, the forms <strong>and</strong> underst<strong>and</strong>s the person’s disability when it<br />
comes to reading or writing. Reading <strong>and</strong> writing is my disability, so<br />
trying to read <strong>and</strong> write is a nightmare for me.”<br />
Assistance in Finding a Job<br />
� Structure for Clients<br />
o “Provide with more specific direction.”<br />
o “The counselor I had kept directing me in the wrong direction, so I had<br />
to do everything myself.”<br />
� Customize job placement.<br />
o “Should be more helpful with finding jobs for- by not focusing on easy<br />
195
� New Resources<br />
Nevada <strong>Department</strong> <strong>of</strong> <strong>Employment</strong>, <strong>Training</strong> <strong>and</strong> <strong>Rehabilitation</strong><br />
2011 General Client Satisfaction Survey<br />
jobs for the people. I need something more challenging. They didn’t<br />
place me in jobs that I’m interested in.”<br />
o “One <strong>of</strong> the problems is they need better resources for finding a job.<br />
They send you to job fairs <strong>and</strong> leads <strong>and</strong> they are not useful because<br />
you are not qualified for them.”<br />
Participant Evaluations<br />
� Participant Screening<br />
o “When they evaluate people they should do a background check, work<br />
history- if you’re a good worker or a waste. There are too many people<br />
doing drugs <strong>and</strong> pulling unemployment. They should drug test who go<br />
through the program. There are freeloaders <strong>and</strong> there are people who<br />
want to work <strong>and</strong> need the money.”<br />
o “I personally know people that are clients that use drugs on a regular<br />
basis <strong>and</strong> are not serious about getting work.”<br />
� Disability Verification<br />
o “I think they really need to screen people more. There’s a lot <strong>of</strong> people<br />
going to Voc Rehab that aren’t really h<strong>and</strong>icapped, <strong>and</strong> those people are<br />
taking money from people that really are h<strong>and</strong>icapped.”<br />
Communication with Counselors <strong>and</strong> Staff<br />
� Ability to Choose a Counselor<br />
o “The people who are in the programs should have the option to chose<br />
the counselor that would be best for them.”<br />
� Counselor Availability<br />
o “They need to keep in contact with people. It was hard for me to get a<br />
hold <strong>of</strong> her- it was to make an appointment. Every time I walked in<br />
there, she was busy.”<br />
� Updates <strong>and</strong> Follow-ups<br />
o “Follow-ups would be nice. I’d like to have someone follow-up to see if<br />
196
Nevada <strong>Department</strong> <strong>of</strong> <strong>Employment</strong>, <strong>Training</strong> <strong>and</strong> <strong>Rehabilitation</strong><br />
2011 General Client Satisfaction Survey<br />
I need further training to be an effective employee. I wish I had a<br />
counselor to speak with now because sometimes I feel like I need one in<br />
certain situations on the job.”<br />
o “More follow-up after I got my job <strong>and</strong> the things I needed. There was<br />
no follow-up. Like seeing if this is just something I could do better with<br />
my life than take a cashier job. Extend my education- there was none <strong>of</strong><br />
that”.<br />
197
Nevada <strong>Department</strong> <strong>of</strong> <strong>Employment</strong>, <strong>Training</strong> <strong>and</strong> <strong>Rehabilitation</strong><br />
2011 General Client Satisfaction Survey<br />
Question 20: Based on your own experiences with the<br />
vocational rehabilitation program, are there any specific<br />
POSITIVE aspects that should be continued or exp<strong>and</strong>ed<br />
in the future?<br />
Voc Rehab Employees<br />
� Counselors<br />
o “I liked the ability to talk to somebody <strong>and</strong> having somebody<br />
personally working with me <strong>and</strong> making all the resources available<br />
right there, <strong>and</strong> I got along well with my counselor <strong>and</strong> they were very<br />
helpful.”<br />
o “I really liked the way my caseworker would always tell me to keep my<br />
head up high. He was very full <strong>of</strong> encouragement.”<br />
o “The assistance was excellent. My counselor was caring <strong>and</strong> hard<br />
working. I took skill tests, went to school, received bus passes for work,<br />
<strong>and</strong> I am very thankful.”<br />
� Assessments <strong>and</strong> Job Leads<br />
o “The assessment process is excellent.”<br />
o “I like that they try to find jobs for you that are at your level <strong>and</strong> that<br />
you can do.”<br />
o “Interest <strong>and</strong> ability surveys were useful in determining jobs <strong>of</strong> which<br />
the client might enjoy.”<br />
� Staff<br />
o “The interpreters were very important.”<br />
o “The mobility instructors are awesome. They gave me a lot <strong>of</strong> help.”<br />
Education<br />
� Courses<br />
o “The thing that helped me the most was going out for all the computer<br />
<strong>and</strong> typing classes.”<br />
o “The classes that you learn about jobs are good. It’s a new style. I like<br />
their style on how they represent that information.”<br />
198
Nevada <strong>Department</strong> <strong>of</strong> <strong>Employment</strong>, <strong>Training</strong> <strong>and</strong> <strong>Rehabilitation</strong><br />
2011 General Client Satisfaction Survey<br />
� <strong>Training</strong><br />
o “Everyone was very helpful <strong>and</strong> many options <strong>and</strong> trainings were<br />
provided <strong>and</strong> <strong>of</strong>fered.”<br />
o “<strong>Training</strong>, classes, <strong>and</strong> warehouse training should continue.”<br />
Health Support<br />
� Assistive Technology<br />
o “Their medical help- they helped with my glasses <strong>and</strong> my hearing.”<br />
o “The Braille program.”<br />
� Mental Health<br />
o “The mental health counseling was also something that helped to get<br />
me out <strong>of</strong> a slump. They really went to bat for me <strong>and</strong> so I saw a<br />
counselor.”<br />
Resources<br />
� Accommodations<br />
o “I like the way they help with uniforms <strong>and</strong> tools.”<br />
o “Transportation they provided was absolutely essential for me to get<br />
around <strong>and</strong> get a job.”<br />
� Social<br />
o “Job Search Club for the Deaf & Hard <strong>of</strong> hearing was a great supportive<br />
program for keeping the client motivated in their job search.”<br />
o “The part where they meet <strong>and</strong> network with other people is good.”<br />
199