Download pdf - Water Replenishment District of Southern California
Download pdf - Water Replenishment District of Southern California
Download pdf - Water Replenishment District of Southern California

Create successful ePaper yourself
Turn your PDF publications into a flip-book with our unique Google optimized e-Paper software.
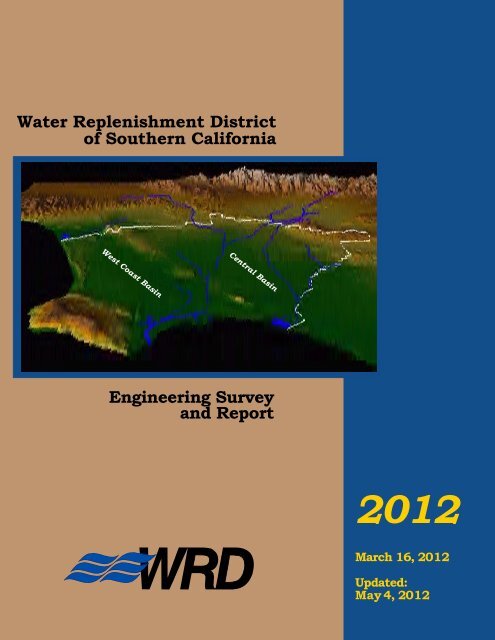
<strong>Water</strong> <strong>Replenishment</strong> <strong>District</strong><br />
Of <strong>Southern</strong> <strong>California</strong><br />
ENGINEERING SURVEY AND REPORT, 2012<br />
Updated May 4, 2012<br />
BOARD OF DIRECTORS<br />
Division 1<br />
Willard H. Murray, Jr., Secretary<br />
Division 2<br />
Robert Katherman, Director<br />
Division 3<br />
Lillian Kawasaki, Vice President<br />
Division 4<br />
Sergio Calderon, Treasurer<br />
Division 5<br />
Albert Robles, President<br />
<strong>District</strong> Counsel<br />
Francisco Leal<br />
MANAGEMENT<br />
General Manager<br />
Robb Whitaker<br />
Assistant General Manager<br />
Anthony La<br />
Chief Hydrogeologist<br />
Theodore Johnson<br />
Chief Financial Officer<br />
Scott Ota<br />
Manager <strong>of</strong> External Affairs<br />
Elsa Lopez<br />
Manager <strong>of</strong> Finance and Administration<br />
Jenna Shaunessy<br />
Pr<strong>of</strong>essional Certification<br />
This Engineering Survey and Report has been prepared under the direct supervision <strong>of</strong> the <strong>California</strong><br />
Pr<strong>of</strong>essional Geologist whose signature appears below. This individual certifies that the information<br />
contained in the report has been prepared in accordance with the generally accepted principles and<br />
practices <strong>of</strong> his pr<strong>of</strong>ession.<br />
Theodore A. Johnson, PG 6142, CHG 240
MEMORANDUM<br />
DATE: MAY 4, 2012<br />
TO:<br />
FROM:<br />
SUBJECT:<br />
INTERESTED PARTIES<br />
ROBB WHITAKER, GENERAL MANAGER<br />
UPDATED 2012 ENGINEERING SURVEY AND REPORT<br />
The <strong>Water</strong> <strong>Replenishment</strong> <strong>District</strong> <strong>of</strong> <strong>Southern</strong> <strong>California</strong> (“WRD” or “<strong>District</strong>”) is the<br />
groundwater management agency responsible for safe and reliable groundwater in the Central<br />
Basin and West Coast Basin in southern coastal Los Angeles County. Groundwater constitutes<br />
nearly 40% <strong>of</strong> the total water demand used by the 4 million residents and businesses in the 43<br />
cities in the WRD service area.<br />
On March 16, 2012, WRD completed an Engineering Survey and Report (“ESR”) as required by<br />
the <strong>California</strong> <strong>Water</strong> Code (Section 60300) to present information on the past, current, and<br />
anticipated future conditions in the two groundwater basins. Information is presented on<br />
groundwater pumping, groundwater conditions (water levels, overdraft, changes in storage),<br />
projects related to groundwater supply and quality, and the amount, sources, and cost <strong>of</strong><br />
replenishment water needed to replace the pumping overdraft.<br />
According to <strong>Water</strong> Code Section 60305, the ESR must be completed by March <strong>of</strong> each year.<br />
But the annual <strong>Replenishment</strong> Assessment (“RA”) assessed on groundwater production is not<br />
required to be set until May. Therefore, new and updated information is <strong>of</strong>ten received in the<br />
months between the initial ESR in March and the setting <strong>of</strong> the RA in May. To document these<br />
changes, the <strong>District</strong> publishes an updated ESR following adoption <strong>of</strong> the RA. This May 4, 2012<br />
ESR updates and replaces the earlier March 16, 2012 report and contains the latest information<br />
on replenishment water sources and costs within the <strong>District</strong>.<br />
For example, on May 4, 2012, the WRD Board <strong>of</strong> Directors set the 2012/2013 RA at $244 per<br />
acre foot (AF) <strong>of</strong> groundwater pumped. This rate will go into effect July 1, 2012 and will last<br />
through June 30, 2013. This is a 0% increase from the current rate, which is also $244/AF. The<br />
Board <strong>of</strong> Directors was able to maintain a flat RA even though the cost <strong>of</strong> replenishment water to<br />
WRD is increasing. This was accomplished by reducing and deferring projects, programs and<br />
administrative costs, and by reducing the amount <strong>of</strong> imported spreading water to purchase by<br />
Page 1 <strong>of</strong> 2
taking advantage <strong>of</strong> surplus purchases made by WRD in the previous two years and a special In-<br />
Lieu program.<br />
Other adjustments made to this May 4 report compared to the March 16 report is an update on<br />
water pricing based on MWD setting their rates on April 10, 2012; modifying the Long Beach In-<br />
Lieu numbers based on accounting updates; and eliminating the recycled water contributions to<br />
the Dominguez Gap Barrier due to the Terminal Island Treatment Plant being temporarily shut<br />
down for major improvements and upgrades.<br />
Details on these and other updates are presented in the pages that follow. My staff and I<br />
welcome any comments or questions you may have regarding this updated ESR. Additional<br />
copies are available by calling the <strong>District</strong> at (562) 921-5521 or by downloading it from our web<br />
site at http://www.wrd.org. Thank you for your interest and input on groundwater conditions in<br />
the Central Basin and West Coast Basin.<br />
Page 2 <strong>of</strong> 2
TABLE OF CONTENTS<br />
GLOSSARY OF ACRONYMNS.................................................................................................. G-1<br />
BOARD SUMMARY .......................................................................................................... Summary-i<br />
CHAPTER I - INTRODUCTION<br />
Purpose <strong>of</strong> the Engineering Survey & Report.....................................................................................I-1<br />
Scope <strong>of</strong> Engineering Survey & Report..............................................................................................I-1<br />
Schedule for Setting the <strong>Replenishment</strong> Assessment .........................................................................I-1<br />
CHAPTER II - GROUNDWATER PRODUCTION<br />
Adjudication and Demand ................................................................................................................ II-1<br />
Groundwater Production ................................................................................................................... II-1<br />
Carryover and Drought Provisions ................................................................................................... II-2<br />
CHAPTER III - GROUNDWATER CONDITIONS<br />
Introduction ...................................................................................................................................... III-1<br />
Annual Overdraft ............................................................................................................................. III-1<br />
Accumulated Overdraft.................................................................................................................... III-2<br />
Groundwater Levels ......................................................................................................................... III-3<br />
Change in Storage ............................................................................................................................ III-6<br />
Optimum Groundwater Quantity ..................................................................................................... III-6<br />
CHAPTER IV - GROUNDWATER REPLENISHMENT:<br />
QUANTITIES, AVAILABILITY AND COSTS<br />
Sources <strong>of</strong> <strong>Replenishment</strong> <strong>Water</strong> ..................................................................................................... IV-1<br />
Recommended Quantities <strong>of</strong> <strong>Replenishment</strong> <strong>Water</strong> ........................................................................ IV-2<br />
Expected Availability <strong>of</strong> <strong>Replenishment</strong> <strong>Water</strong>............................................................................... IV-3<br />
Projected Cost <strong>of</strong> <strong>Replenishment</strong> <strong>Water</strong> .......................................................................................... IV-5<br />
WRD Engineering Survey and Report, 2012<br />
TOC-1
TABLE OF CONTENTS (Continued)<br />
CHAPTER V - PROJECTS AND PROGRAMS<br />
001 - Leo J. Vander Lans <strong>Water</strong> Treatment Facility Project ............................................................ V-1<br />
002 - Robert W. Goldsworthy Desalter Project ................................................................................ V-1<br />
004 - Recycled <strong>Water</strong> Program ......................................................................................................... V-2<br />
005 - Groundwater Resources Planning Program............................................................................. V-3<br />
006 - Groundwater Quality Program ................................................................................................ V-4<br />
010 - Geographic Information System.............................................................................................. V-7<br />
011 - Regional Groundwater Monitoring Program........................................................................... V-7<br />
012 - Safe Drinking <strong>Water</strong> Program ................................................................................................. V-8<br />
018 - Dominguez Gap Barrier Recycled <strong>Water</strong> Injection................................................................. V-9<br />
023 - <strong>Replenishment</strong> Operations....................................................................................................... V-9<br />
025 - Hydrogeology Program ......................................................................................................... V-11<br />
033 - Groundwater Reliability Improvement Program (GRIP) ...................................................... V-12<br />
035 - West Coast Seawater Barrier Monitoring Well Sampling Project ........................................ V-13<br />
TABLES (see Tables Section after Chapter V)<br />
Table 1: Groundwater Conditions and <strong>Replenishment</strong> Summary<br />
Table 2: Quantity and Cost <strong>of</strong> <strong>Replenishment</strong> <strong>Water</strong> for the Ensuing <strong>Water</strong> Year<br />
Table 3: WRD Projects and Programs<br />
Table 4: 30-Year Average Groundwater Balance<br />
Table 5: Historical Rainfall<br />
Table 6: Annual Overdraft Calculation<br />
Table 7: Accumulated Overdraft Calculation<br />
Table 8: Changes in Groundwater Storage<br />
Table 9: Quantity <strong>of</strong> <strong>Water</strong> Required for Artificial <strong>Replenishment</strong><br />
Table A-1: Historical Amounts <strong>of</strong> <strong>Water</strong> Purchased for Spreading in the Montebello Forebay<br />
Table A-2: Historical Amounts <strong>of</strong> <strong>Water</strong> Purchased for Injection<br />
Table A-3: Historical Amounts <strong>of</strong> the In-Lieu Program<br />
Table A-4: Historical Amounts <strong>of</strong> <strong>Replenishment</strong> <strong>Water</strong><br />
Table A-5: Historical Amounts <strong>of</strong> Groundwater Production<br />
Table A-6: Historical Amounts <strong>of</strong> <strong>Water</strong> Use in the WRD Service Area<br />
Table A-7: WRD Groundwater Banking Programs<br />
WRD Engineering Survey and Report, 2012<br />
TOC-2
TABLE OF CONTENTS (Continued)<br />
FIGURES (see Figures Section following the Tables)<br />
Figure A: Historical Rainfall<br />
Figure B: Fluctuation <strong>of</strong> <strong>Water</strong> Levels in the Los Angeles Forebay<br />
Figure C: Fluctuation <strong>of</strong> <strong>Water</strong> Levels in the Montebello Forebay<br />
Figure D: Fluctuation <strong>of</strong> <strong>Water</strong> Levels in the Central Basin Pressure Area<br />
Figure E: Fluctuation <strong>of</strong> <strong>Water</strong> Levels in the West Coast Basin<br />
PLATES (see Plates Section following the Figures)<br />
Plate 1: Groundwater Production for <strong>Water</strong> Year 2010/2011<br />
Plate 2: Groundwater Elevation Contour Map for Fall 2011<br />
Plate 3: Change in Groundwater Levels Fall 2010 to Fall 2011<br />
WRD Engineering Survey and Report, 2012<br />
TOC-3
GLOSSARY OF ACRONYMS<br />
ABP<br />
AF<br />
AFY<br />
APA<br />
CB<br />
CBMWD<br />
CDPH<br />
CEC<br />
CEQA<br />
CHG<br />
CIP<br />
CPI<br />
CBWCB<br />
DGBP<br />
DPH<br />
DTSC<br />
DWR<br />
EIR<br />
EPA<br />
ESR<br />
Alamitos Barrier Project<br />
Acre-Feet (equivalent to 325,851 gallons)<br />
Acre-Feet per Year<br />
Allowed Pumping Allocation<br />
Central Basin<br />
Central Basin Municipal <strong>Water</strong> <strong>District</strong><br />
<strong>California</strong> Department <strong>of</strong> Public Health (formerly <strong>California</strong><br />
Department <strong>of</strong> Health Services)<br />
Constituents <strong>of</strong> Emerging Concern<br />
<strong>California</strong> Environmental Quality Act<br />
<strong>California</strong> Certified Hydrogeologist<br />
Capital Improvement Program<br />
Consumer Price Index<br />
Central Basin and West Coast Basin<br />
Dominguez Gap Barrier Project<br />
<strong>California</strong> Department <strong>of</strong> Public Health<br />
<strong>California</strong> Department <strong>of</strong> Toxic Substances Control<br />
<strong>California</strong> Department <strong>of</strong> <strong>Water</strong> Resources<br />
Environmental Impact Report<br />
U.S. Environmental Protection Agency<br />
Engineering Survey and Report<br />
FY Fiscal Year (July 1 – June 30)<br />
GAC<br />
GIS<br />
IRWMP<br />
LACDHS<br />
LACDPW<br />
LADWP<br />
LBWD<br />
MAR<br />
Met<br />
MCL<br />
MF<br />
MFI<br />
mgd<br />
MOU<br />
Granular Activated Carbon<br />
Geographic Information System<br />
Integrated Regional <strong>Water</strong> Management Plan<br />
Los Angeles County Department <strong>of</strong> Health Services<br />
Los Angeles County Department <strong>of</strong> Public Works (Flood Control)<br />
City <strong>of</strong> Los Angeles Department <strong>of</strong> <strong>Water</strong> and Power<br />
City <strong>of</strong> Long Beach <strong>Water</strong> Department<br />
Managed Aquifer Recharge<br />
Metropolitan <strong>Water</strong> <strong>District</strong> <strong>of</strong> <strong>Southern</strong> <strong>California</strong><br />
Maximum Contaminant Level<br />
Micr<strong>of</strong>iltration<br />
Modified Fouling Index<br />
Million Gallons per Day<br />
Memorandum <strong>of</strong> Understanding<br />
WRD Engineering Survey and Report, 2012 G-1
GLOSSARY OF ACRONYMS (continued)<br />
msl<br />
MWD<br />
NDMA<br />
O&M<br />
PG<br />
ppb<br />
ppm<br />
PRC<br />
PWRP<br />
RA<br />
RO<br />
RTS<br />
RWQCB<br />
SAT<br />
SDLAC<br />
SDWP<br />
SGVMWD<br />
SJCWRP<br />
TAC<br />
TITP<br />
Mean Sea Level<br />
Metropolitan <strong>Water</strong> <strong>District</strong> <strong>of</strong> <strong>Southern</strong> <strong>California</strong><br />
N-Nitrosodimethylamine<br />
Operations and Maintenance<br />
<strong>California</strong> Pr<strong>of</strong>essional Geologist<br />
Parts Per Billion (µg/L)<br />
Parts Per Million (mg/L)<br />
Program Review Committee<br />
Pomona <strong>Water</strong> Reclamation Plant<br />
<strong>Replenishment</strong> Assessment<br />
Reverse Osmosis<br />
Readiness-to-Serve Charge<br />
Regional <strong>Water</strong> Quality Control Board (Los Angeles Region)<br />
Soil Aquifer Treatment<br />
Sanitation <strong>District</strong>s <strong>of</strong> Los Angeles County<br />
Safe Drinking <strong>Water</strong> Program<br />
San Gabriel Valley Municipal <strong>Water</strong> <strong>District</strong><br />
San Jose Creek <strong>Water</strong> Reclamation Plant<br />
Technical Advisory Committee<br />
Terminal Island Treatment Plant<br />
USGS United States Geological Survey<br />
USGVMWD Upper San Gabriel Valley Municipal <strong>Water</strong> <strong>District</strong><br />
UV Ultraviolet Light Treatment<br />
VOC<br />
Volatile Organic Compound<br />
WAS <strong>Water</strong> Augmentation Study<br />
WBMWD West Basin Municipal <strong>Water</strong> <strong>District</strong><br />
WCB West Coast Basin<br />
WCBBP West Coast Basin Barrier Project<br />
WIN <strong>Water</strong> Independence Now program<br />
WNWRP Whittier Narrows <strong>Water</strong> Reclamation Plant<br />
WRD <strong>Water</strong> <strong>Replenishment</strong> <strong>District</strong> <strong>of</strong> <strong>Southern</strong> <strong>California</strong><br />
WRP <strong>Water</strong> Reclamation Plant<br />
WY <strong>Water</strong> Year (October 1 – September 30)<br />
WRD Engineering Survey and Report, 2012<br />
Glossary-2
BOARD SUMMARY<br />
Board Summary<br />
<strong>District</strong> Staff is pleased to present the 2012 Engineering Survey and Report (“ESR”). It was<br />
prepared pursuant to the <strong>California</strong> <strong>Water</strong> Code, Section 60300 et seq. and determines the past,<br />
current, and ensuing year groundwater conditions in the Central Basin and West Coast Basin<br />
(“CBWCB”). The report contains information on groundwater production, annual and accumulated<br />
overdraft, water levels, quantity, source, and cost <strong>of</strong> replenishment water, and a discussion <strong>of</strong><br />
necessary projects and programs to protect and preserve the groundwater resources <strong>of</strong> the basins.<br />
The ESR provides the Board <strong>of</strong> Directors with the necessary information to justify the setting <strong>of</strong> a<br />
replenishment assessment (“RA”) for the ensuing fiscal year (July 1 – June 30) to purchase<br />
replenishment water and to fund projects and programs related to groundwater replenishment and<br />
groundwater quality over the water year (October 1 – September 30).<br />
The following is a summary <strong>of</strong> <strong>Water</strong> Code required elements <strong>of</strong> the ESR:<br />
1. Groundwater Production<br />
<br />
<br />
<br />
<br />
Adjudicated Amount: 281,835 AF<br />
Previous <strong>Water</strong> Year: 215,196 AF<br />
Current <strong>Water</strong> Year: 243,500 AF (estimated)<br />
Ensuing <strong>Water</strong> Year: 244,500 AF (estimated)<br />
2. Annual Overdraft<br />
Previous <strong>Water</strong> Year: (16,100) AF<br />
Current <strong>Water</strong> Year: 111,300 AF (estimated)<br />
Ensuing <strong>Water</strong> Year: 99,300 AF (estimated)<br />
3. Accumulated Overdraft<br />
<br />
<br />
Previous <strong>Water</strong> Year: 616,300 AF<br />
Current <strong>Water</strong> Year: 650,600 AF (estimated)<br />
4. Groundwater Levels<br />
Because <strong>of</strong> the wet winter <strong>of</strong> 2010/2011 that resulted in more than double the normal stormwater<br />
capture at the Montebello Forebay Spreading Grounds, plus the extra imported water purchased by<br />
WRD for spreading when MWD made discounted replenishment water available for a limited time,<br />
and the reduced pumping that occurred as a result <strong>of</strong> the wet winter and the WRD special In-Lieu<br />
program with the City <strong>of</strong> Long Beach, groundwater levels in the Central Basin rose up to 30 feet in<br />
the Montebello Forebay and over 90 feet in the Long Beach area. In the West Coast Basin, water<br />
WRD Engineering Survey and Report, 2012<br />
Summary-i
Board Summary<br />
level rises were more muted and saw a decrease <strong>of</strong> 5 feet in some areas and a gain <strong>of</strong> 10 feet in other<br />
areas. Overall, there was a net gain <strong>of</strong> 110,000 AF in the CBWCB from the previous year which is a<br />
record high as tracked by WRD. This gain in storage brought the groundwater basins to within<br />
4,300 AF <strong>of</strong> the <strong>District</strong>’s Optimum Quantity. Details <strong>of</strong> the groundwater levels in the CBWCB are<br />
described in Chapter III.<br />
5. Quantity <strong>of</strong> <strong>Replenishment</strong> <strong>Water</strong> Required in the Ensuing Year<br />
The <strong>District</strong> determines replenishment water needs on averages from a long-term (30 year)<br />
hydrologic record, meaning extremely wet years and extremely dry years in addition to average<br />
precipitation years are accounted for in deriving the average replenishment needs. Chapter IV details<br />
the quantity <strong>of</strong> water that WRD must purchase in the ensuing water year to help <strong>of</strong>fset the annual<br />
overdraft on an average basis. A summary is listed below:<br />
Spreading <strong>Water</strong>: 52,180 AF (50,000 recycled; 2,180 imported)<br />
Seawater Barrier <strong>Water</strong>: 30,340 AF (13,040 AF imported; 17,300 AF recycled)<br />
In-Lieu Program <strong>Water</strong>: 0 AF (suspended due to lack <strong>of</strong> MWD replenishment water)<br />
Total <strong>Water</strong>: 82,520 AF<br />
6. Source <strong>of</strong> <strong>Replenishment</strong> <strong>Water</strong><br />
The sources <strong>of</strong> replenishment water to the <strong>District</strong> for the ensuing water year are detailed in Chapter<br />
IV. Discounted replenishment water from MWD has not been available for In-Lieu or spreading<br />
between May 2007 and May 2011, and again since October 2011. MWD is currently considering a<br />
new three-level replenishment program, but as <strong>of</strong> this writing has not yet adopted that program.<br />
Therefore, WRD like the last two years, will plan on purchasing untreated Tier 1 imported water for<br />
spreading. A summary <strong>of</strong> the sources <strong>of</strong> replenishment water available to WRD is as follows:<br />
<br />
<br />
Recycled <strong>Water</strong>: Tertiary water for spreading from the Sanitation <strong>District</strong>s <strong>of</strong> Los Angeles<br />
County (SDLAC). Advanced-treated water for the West Coast Basin Barrier Project<br />
(WCBBP) from the West Basin Municipal <strong>Water</strong> <strong>District</strong>, for the Dominguez Gap Barrier<br />
Project (DGBP) from the City <strong>of</strong> Los Angeles (although the treatment plant is currently<br />
<strong>of</strong>fline for maintenance), and for the Alamitos Barrier Project (ABP) from WRD.<br />
Imported <strong>Water</strong>: Untreated Tier 1 water for spreading from MWD member agencies such as<br />
the Central Basin Municipal <strong>Water</strong> <strong>District</strong> or others. WCBBP water and DGBP water from<br />
West Basin Municipal <strong>Water</strong> <strong>District</strong>. ABP water from the City <strong>of</strong> Long Beach.<br />
7. Cost <strong>of</strong> <strong>Replenishment</strong> <strong>Water</strong><br />
WRD has estimated it will need 82,520 AF <strong>of</strong> replenishment water in the ensuing year. WRD<br />
purchases replenishment water from the MWD member agencies and recycled water providers.<br />
These agencies set the price for the replenishment water that WRD buys for the spreading grounds,<br />
seawater barrier injection wells, and In-Lieu water when available. The cost for replenishment water<br />
is a direct pass-through from WRD to the water suppliers on WRD’s replenishment assessment.<br />
WRD Engineering Survey and Report, 2012<br />
Summary-ii
Board Summary<br />
Using currently available information and estimates for the cost <strong>of</strong> replenishment water to WRD in<br />
the ensuing year, the required 82,520 AF will cost approximately $29,368,625. Tables 1 and 2<br />
provide a detailed breakdown <strong>of</strong> these costs.<br />
These estimated costs are for water purchases only and do not include the additional costs for water<br />
replenishment and water quality projects and programs. These projects and programs are discussed<br />
in detail in Chapter V. The anticipated costs <strong>of</strong> these projects and programs have been discussed in<br />
<strong>District</strong> budget workshops held in March, April and May which led to the Board <strong>of</strong> Directors<br />
adopting the 2012/2013 <strong>Replenishment</strong> Assessment <strong>of</strong> $244/AF on May 4, 2012. This assessment is<br />
unchanged from the previous year.<br />
8. Projects and Programs<br />
A list <strong>of</strong> the WRD projects and programs related to groundwater replenishment and the protection<br />
and preservation <strong>of</strong> water quality is shown on Table 3. Funds are required to finance these projects<br />
and programs. Sections 60221 and 60230 <strong>of</strong> the <strong>Water</strong> <strong>Replenishment</strong> <strong>District</strong> Act authorize the<br />
WRD to undertake a wide range <strong>of</strong> capital projects and other programs aimed at enhancing<br />
groundwater replenishment. Section 60224 <strong>of</strong> the <strong>Water</strong> <strong>Replenishment</strong> <strong>District</strong> Act states that<br />
WRD may establish projects or programs that will directly or indirectly preserve and protect the<br />
groundwater supplies within its boundaries.<br />
These projects and programs address any existing or potential problems related to the basin’s<br />
groundwater, and may extend beyond the <strong>District</strong>'s boundaries if the threat <strong>of</strong> contamination is<br />
outside those boundaries. The programs span all phases <strong>of</strong> planning, design, and construction and<br />
are financed by the collection <strong>of</strong> a replenishment assessment. A more detailed description <strong>of</strong> each<br />
project and program is presented in Chapter V <strong>of</strong> the report.<br />
9. Conclusions<br />
Based upon the information presented in the ESR, a replenishment assessment is necessary in the<br />
ensuing year to purchase replenishment water and to finance projects and programs to perform<br />
replenishment and water quality activities. These actions will ensure sufficient supplies <strong>of</strong> high<br />
quality groundwater within the <strong>District</strong> for the benefit <strong>of</strong> the residents and businesses in the Central<br />
Basin and West Coast Basin.<br />
WRD Engineering Survey and Report, 2012<br />
Summary-iii
Introduction<br />
CHAPTER I<br />
INTRODUCTION<br />
Purpose <strong>of</strong> the Engineering Survey & Report<br />
To facilitate the Board <strong>of</strong> Directors' decisions and actions, the <strong>Water</strong> <strong>Replenishment</strong> <strong>District</strong> Act<br />
requires that an engineering survey and report (“ESR”) be prepared each year. This Engineering<br />
Survey and Report 2012 is in conformity with the requirements <strong>of</strong> Section 60300 et seq. <strong>Water</strong><br />
<strong>Replenishment</strong> <strong>District</strong> Act and presents the necessary information on which the Board <strong>of</strong> Directors<br />
can declare whether funds shall be raised to purchase water for replenishment during the ensuing<br />
year, as well as to finance projects and programs aimed at accomplishing groundwater<br />
replenishment. With the information in this ESR, the Board can also declare whether funds shall be<br />
collected to remove contaminants from the groundwater supplies or to exercise any other power<br />
under Section 60224 <strong>of</strong> the <strong>California</strong> <strong>Water</strong> Code. The information presented in this report along<br />
with the <strong>District</strong>‟s strategic planning and budget preparation presents the necessary information on<br />
which the Board <strong>of</strong> Directors can base the establishment <strong>of</strong> a replenishment assessment for the<br />
ensuing year 2012/2013.<br />
Scope <strong>of</strong> Engineering Survey & Report<br />
This report contains specific information outlined in Chapter I, Part 6 <strong>of</strong> Division 18 <strong>of</strong> the <strong>Water</strong><br />
Code (the <strong>Water</strong> <strong>Replenishment</strong> <strong>District</strong> Act, § 60300 and § 60301). The following is a brief<br />
description <strong>of</strong> the contents <strong>of</strong> this report:<br />
1) a discussion <strong>of</strong> groundwater production within the <strong>District</strong> (Chapter II);<br />
2) an evaluation <strong>of</strong> groundwater conditions within the <strong>District</strong>, including estimates <strong>of</strong> the annual<br />
overdraft, the accumulated overdraft, changes in water levels, and the effects <strong>of</strong> water level<br />
fluctuations on the groundwater resources (Chapter III);<br />
3) an appraisal <strong>of</strong> the quantity, availability, and cost <strong>of</strong> replenishment water required for the<br />
ensuing water year (Chapter IV); and<br />
4) a description <strong>of</strong> current and proposed programs and projects to accomplish replenishment goals<br />
and to protect and preserve high quality groundwater supplies within the <strong>District</strong> (Chapter V).<br />
Schedule for Setting the <strong>Replenishment</strong> Assessment<br />
The following actions are required by the <strong>Water</strong> Code to set the <strong>Replenishment</strong> Assessment:<br />
1) The Board shall order the preparation <strong>of</strong> the ESR by the second Tuesday in February (see<br />
Section 60300).<br />
2) The Board shall declare by resolution whether funds shall be collected to purchase<br />
replenishment water and to fund projects and programs related to replenishment and/or water<br />
quality activities by the second Tuesday in March and after the ESR has been completed (see<br />
Section 60305).<br />
3) A Public Hearing will be held for the purpose <strong>of</strong> determining whether <strong>District</strong> costs will be paid<br />
for by a replenishment assessment. The Public Hearing will be opened on or before the second<br />
Tuesday in April and may be continued from time to time to subsequent Board meetings but will<br />
be completed by the first Tuesday in May (see Section 60306).<br />
WRD Engineering Survey and Report, 2012 I-1
Introduction<br />
4) The Board by resolution shall levy a replenishment assessment for the ensuing fiscal year by the<br />
second Tuesday in May (see Sections 60315; 60317).<br />
Although dates specified in the code refer generally to „on or before certain Tuesdays‟, the <strong>Water</strong><br />
Code (Section 60043) also states that “Whenever any act is required to be done or proceeding taken<br />
on or set for a particular day or day <strong>of</strong> the week in any month, the act may be done or proceeding set<br />
for and acted upon a day <strong>of</strong> the month otherwise specified for a regular meeting <strong>of</strong> the board”.<br />
Therefore, there is flexibility as to the actual dates when Board actions are taken regarding the ESR,<br />
adopting resolutions, conducting public hearings, and the setting the replenishment assessment.<br />
The ESR is completed in March <strong>of</strong> each year to provide the Board with the necessary information to<br />
determine whether a replenishment assessment will be needed in the ensuing year to purchase<br />
replenishment water and to fund projects and programs related to water quality and replenishment<br />
activities. However, in the subsequent months leading up to the adoption <strong>of</strong> the replenishment<br />
assessment, new information is normally received that affects the findings presented in the March<br />
ESR. This new information is typically related to the price WRD has to pay for replenishment water<br />
since the rates set by the Metropolitan <strong>Water</strong> <strong>District</strong> <strong>of</strong> <strong>Southern</strong> <strong>California</strong> (MWD or Met) and the<br />
Met-member agencies are not typically finalized until after the March ESR is adopted. The final<br />
information used by the Board to adopt the replenishment assessment is reflected in an updated ESR<br />
published following the adoption <strong>of</strong> the replenishment assessment.<br />
WRD Engineering Survey and Report, 2012 I-2
CHAPTER II<br />
GROUNDWATER PRODUCTION<br />
Groundwater Production<br />
Adjudication and Demand<br />
Prior to the adjudication <strong>of</strong> groundwater rights in the early 1960s, annual production (pumping)<br />
reached levels as high as 292,000 AF in the Central Basin (“CB”) and 94,000 AF in the West Coast<br />
Basin (“WCB”). This was more than double the natural safe yield <strong>of</strong> the basins as determined by the<br />
<strong>California</strong> Department <strong>of</strong> <strong>Water</strong> Resources in 1962 (173,400 AF). Due to this serious overdraft,<br />
water levels declined, groundwater was lost from storage, and seawater intruded into the coastal<br />
aquifers. To remedy this problem, the courts adjudicated the two basins to put a limit on pumping.<br />
The West Coast Basin adjudication was set at 64,468.25 acre-feet per year (“AFY”). The Central<br />
Basin adjudication was set at 271,650 AFY, although the Judgment set a lower “Allowed Pumping<br />
Allocation” (“APA”) <strong>of</strong> 217,367 AFY to impose stricter control. Therefore, the current amount<br />
allowed to be pumped from both basins is 281,835 AFY.<br />
The adjudicated pumping amounts are greater than the natural replenishment <strong>of</strong> the groundwater<br />
aquifers, creating an annual deficit or annual overdraft. WRD is enabled under the <strong>California</strong> <strong>Water</strong><br />
Code to purchase and recharge additional water to make up the overdraft, which is known as<br />
artificial replenishment or managed aquifer recharge (MAR). WRD has the authority to levy a<br />
replenishment assessment on all pumping within the <strong>District</strong> to raise the monies necessary to<br />
purchase the artificial replenishment water and to fund projects and programs necessary for<br />
replenishment and groundwater quality activities.<br />
Groundwater Production<br />
Under the terms <strong>of</strong> Section 60326.1 <strong>of</strong> the <strong>Water</strong> <strong>Replenishment</strong> <strong>District</strong> Act, each groundwater<br />
producer must submit a report to the <strong>District</strong> summarizing their monthly production activities<br />
(quarterly for smaller producers). The information from these reports is the basis by which each<br />
producer pays the replenishment assessment. WRD then provides these production data to the State<br />
Department <strong>of</strong> <strong>Water</strong> Resources (“DWR”), which acts as the court-appointed <strong>Water</strong>master in<br />
connection with the adjudication <strong>of</strong> the Central Basin and West Coast Basin (“CBWCB”).<br />
Previous <strong>Water</strong> Year:<br />
Per the <strong>Water</strong> Code, WRD tracks and reports on groundwater production (pumping) on a <strong>Water</strong> Year<br />
(“WY”) basis covering the time frame <strong>of</strong> October 1 - September 30 for each year. For the previous<br />
WY (2010/2011), groundwater production in both basins totaled 215,196 AF (170,799 AF in CB and<br />
44,397 AF in the WCB). This is 26,133 AF less than the previous water year (11%), <strong>of</strong> which the<br />
CB had 26,588 AF less pumping (13%) and the WCB had 455 AF more pumping (1%). The<br />
reduction in pumping in the CB was due to a lower water demands from a wet winter and the nearly<br />
15,000 AF <strong>of</strong> In-Lieu which the City <strong>of</strong> Long Beach participated in with WRD.<br />
Plate 1 illustrates the groundwater production in the CBWCB during the previous water year and<br />
Table A-5 presents historical pumping amounts in the CBWCB.<br />
WRD Engineering Survey and Report, 2012<br />
II-1
Groundwater Production<br />
Current <strong>Water</strong> Year:<br />
For the first six months <strong>of</strong> the current WY (October 2011 through March 2012), production was<br />
112,069 AF (89,448 AF in the CB and 22,621 AF in the WCB). This is 7,939 AF (7.6%) more than<br />
the same time period the previous year. Taking this trend into account and the fact that this year is<br />
currently a dry year which could result in increased water use, and the potential lack <strong>of</strong> an In-Lieu<br />
program, it is estimated that the pumping in the CBWCB will be 243,500 AF in the current year<br />
(199,000 AF in the CB and 44,500 AF in the WCB).<br />
Ensuing <strong>Water</strong> Year:<br />
To estimate production for the ensuing year, recent averages are used in addition to knowledge <strong>of</strong><br />
changing conditions that might affect pumping. Actual pumping patterns can vary considerably<br />
throughout the year based on a pumper’s individual operational needs, water demands, conservation<br />
efforts and hydrology.<br />
To estimate the ensuing year’s groundwater pumping, WRD used the three-year average <strong>of</strong> actual<br />
pumping. For the CB, WYs 2007/2008 – 2009/2010 were used. The most recent year 2010/2011<br />
was not used since pumping was anomalously low due to the In-Lieu program with the City <strong>of</strong> Long<br />
Beach. In addition, in 2007/2008 the City <strong>of</strong> Long Beach pumped extra water that was previously<br />
put in storage, so that extra pumping was excluded from the averaging. Therefore, the three year<br />
average for CB pumping is 200,000 AF. For the WCB, WYs 2008/2009 – 2010/2011 were used to<br />
produce an average <strong>of</strong> 44,500 AF. Both basins combined equal 244,500 AF as the ensuing year<br />
pumping estimate. Table 1 shows the groundwater production amounts for the previous, current,<br />
and ensuing water years.<br />
Measurement <strong>of</strong> Production<br />
With few exceptions, meters installed and maintained by the individual producers measure the<br />
groundwater production from their wells. Through periodic testing, DWR as <strong>Water</strong>master verifies<br />
the accuracy <strong>of</strong> individual meters and orders corrective measures when necessary. The production<br />
<strong>of</strong> the few wells that are not metered is estimated on the basis <strong>of</strong> electrical energy consumed by<br />
individual pump motors, duty <strong>of</strong> water, or other reasonable means.<br />
Carryover and Drought Provisions<br />
The "carryover" <strong>of</strong> unused rights influences the actual amount <strong>of</strong> production for any given year. The<br />
"carryover" for any single year is 20% <strong>of</strong> the allotted pumping right in both the Central and West<br />
Coast Basins. This provision <strong>of</strong> the Judgments extends the flexibility with which the pumpers can<br />
operate. Conversely, the use <strong>of</strong> rights beyond the annual allotted quantity affects the annual<br />
production amount in the opposite manner.<br />
During emergency or drought conditions, WRD can allow under certain conditions an additional<br />
27,000 AF <strong>of</strong> extractions for a four-month period (17,000 for CB and 10,000 for WCB). This<br />
provision has yet to be exercised but <strong>of</strong>fers the potential use <strong>of</strong> an additional 7.8% pumping in the<br />
CB and 15% in the WCB.<br />
The Central Basin Judgment also contains an additional Drought Carryover provision available to all<br />
Central Basin water rights holders after a declaration <strong>of</strong> a <strong>Water</strong> Emergency by the WRD Board <strong>of</strong><br />
Directors. The Drought Carryover allows water rights holders to carryover an additional 35% <strong>of</strong><br />
WRD Engineering Survey and Report, 2012<br />
II-2
Groundwater Production<br />
their APA (or 35 AF, whichever is larger) beyond the annual 20% described above during the period<br />
that the Declared <strong>Water</strong> Emergency is in effect.<br />
The intent <strong>of</strong> the action is prevent further degradation <strong>of</strong> the groundwater basins by helping to<br />
restore groundwater levels and improving the water supply in the aquifers by providing an incentive<br />
to groundwater producers in the Central Basin to reduce pumping for a particular period <strong>of</strong> time.<br />
A Declared <strong>Water</strong> Emergency is defined in the Judgment as:<br />
"A period commencing with the adoption <strong>of</strong> a resolution <strong>of</strong> the Board <strong>of</strong> Directors <strong>of</strong> the<br />
Central and West Basin <strong>Water</strong> <strong>Replenishment</strong> <strong>District</strong> declaring that conditions within the<br />
Central Basin relating to natural and imported supplies <strong>of</strong> water are such that, without<br />
implementation <strong>of</strong> the water emergency provisions <strong>of</strong> this Judgment, the water resources <strong>of</strong><br />
the Central Basin risk degradation. In making such declaration, the Board <strong>of</strong> Directors shall<br />
consider any information and requests provided by water producers, purveyors and other<br />
affected entities and may, for that purpose, hold a public hearing in advance <strong>of</strong> such<br />
declaration. A Declared <strong>Water</strong> Emergency shall extend for one (1) year following such<br />
resolution, unless sooner ended by similar resolution.”<br />
WRD Engineering Survey and Report, 2012<br />
II-3
CHAPTER III<br />
GROUNDWATER CONDITIONS<br />
Groundwater Conditions<br />
Introduction<br />
The <strong>California</strong> <strong>Water</strong> Code Section 60300 requires WRD to determine annually in the Engineering<br />
Survey and Report (“ESR”) the following items related to groundwater conditions in the Central<br />
Basin and West Coast Basin (“CBWCB”):<br />
1) Total groundwater production for the previous water year and estimates for the current and<br />
ensuing water years;<br />
2) The Annual Overdraft for the previous water year and estimates for the current and ensuing water<br />
years;<br />
3) The Accumulated Overdraft for previous water year and an estimate for the current water year;<br />
4) Changes in groundwater levels (pressure levels or piezometric heights) within the <strong>District</strong> and the<br />
effects these changes have on groundwater supplies within the <strong>District</strong>; and<br />
5) An estimate <strong>of</strong> the quantity, source, and cost <strong>of</strong> water available for replenishment during the<br />
ensuing water year;<br />
To meet these requirements, WRD’s hydrogeologists and engineers closely monitor and collect data<br />
to manage the groundwater resources <strong>of</strong> the <strong>District</strong> throughout the year. They track groundwater<br />
levels from WRD’s network <strong>of</strong> specialized monitoring wells and from groundwater producers’<br />
production wells. They update and run computer models developed by the United States Geological<br />
Survey (“USGS”) and others to simulate groundwater conditions and to predict future conditions.<br />
They use their geographic information system (“GIS”) and database management system to store,<br />
analyze, map, and report on the information required for the ESR. They work closely with the Los<br />
Angeles County Department <strong>of</strong> Public Works (LACDPW) on spreading grounds and seawater<br />
barrier wells to determine current and future operational impacts to groundwater supplies. They<br />
work closely with the Metropolitan <strong>Water</strong> <strong>District</strong> <strong>of</strong> <strong>Southern</strong> <strong>California</strong> (“MWD” or “Met”), the<br />
local MWD member agencies, and the Sanitation <strong>District</strong>s <strong>of</strong> Los Angeles County (“SDLAC”) on<br />
the current and future availability <strong>of</strong> replenishment water. They also work with regulators on<br />
replenishment criteria for water quality and recycled water use, and with the groundwater pumpers,<br />
the pumpers’ Technical Advisory Committee (“TAC”), and other stakeholders to discuss the current<br />
and future groundwater conditions within the <strong>District</strong> and in neighboring basins.<br />
The information on Annual Overdraft, Accumulated Overdraft, water levels, and change in storage<br />
are discussed in the remainder <strong>of</strong> this chapter. Groundwater production was previously discussed in<br />
Chapter II. The estimated quantity, source, and cost <strong>of</strong> replenishment water will be discussed in<br />
Chapter IV.<br />
Annual Overdraft<br />
Section 60022 <strong>of</strong> the <strong>Water</strong> <strong>Replenishment</strong> <strong>District</strong> Act defines Annual Overdraft as "...the<br />
amount...by which the quantity <strong>of</strong> groundwater removed by any natural or artificial means from the<br />
WRD Engineering Survey and Report, 2012<br />
III-1
Groundwater Conditions<br />
groundwater supplies within such replenishment district during the water year exceeds the quantity<br />
<strong>of</strong> non-saline water replaced therein by the replenishment <strong>of</strong> such groundwater supplies in such<br />
water year by any natural or artificial means other than replenishment under the provisions <strong>of</strong> Part<br />
6 <strong>of</strong> this act or by any other governmental agency or entity." (Part 6 <strong>of</strong> the Act pertains to water that<br />
WRD purchases for replenishment). Therefore, the Annual Overdraft equals the natural inflows to<br />
basins (not including WRD purchased water) minus all <strong>of</strong> the outflows (mostly pumping). There is<br />
an Annual Overdraft almost every year for the simple fact that the groundwater extractions typically<br />
exceed the natural groundwater replenishment. It has been one <strong>of</strong> the <strong>District</strong>'s main responsibilities<br />
since 1959 to help make up this Annual Overdraft by purchasing artificial replenishment water to<br />
recharge the aquifers and supplement the natural recharge.<br />
To determine the Annual Overdraft for the previous water year, WRD determines the inflows and<br />
outflows <strong>of</strong> the CBWCB. In <strong>Water</strong> Year 2010/2011, natural inflows (storm water capture, areal<br />
recharge, Pomona WRP, and underflow) totaled 231,333 AF and WRD purchased 93,863 AF <strong>of</strong><br />
recharge water (at barrier wells and spreading grounds). The total net outflows from the basins were<br />
215,196 AF from pumping. The difference between the inflows and outflows was 110,000 AF,<br />
which is a gain in groundwater storage. The Annual Overdraft is the natural inflows minus total<br />
outflows, or 231,333 – 215,196 = 16,137 AF (rounded to 16,100 AF). This was a rare condition<br />
where natural inflows exceeded pumping and therefore there was no net Annual Overdraft but<br />
instead a positive change <strong>of</strong> 16,100 AF. The wet years balance the dry years and WRD bases its<br />
replenishment needs on the long term averages.<br />
For the current and ensuing WY estimates for Annual Overdraft, the concept <strong>of</strong> “Average Annual<br />
Groundwater Deficiency” is utilized. The Average Annual Groundwater Deficiency is the long-term<br />
average <strong>of</strong> natural inflows minus total outflows and represents the long term average deficit (Annual<br />
Overdraft) in the basins. The development <strong>of</strong> the USGS/WRD computer model derived these long<br />
term average inflow and outflow terms. Table 4 presents this information, which concluded that the<br />
Average Annual Groundwater Deficiency is 105,385 AFY. Values <strong>of</strong> the average deficiency are<br />
based on the long term (30 year average) inflows and outflows as calculated by the computer model.<br />
Long-term average inflows are influenced by the amount <strong>of</strong> precipitation falling on the <strong>District</strong> as<br />
well as for storm water capture at the spreading grounds. Table 5 and Figure A show the historical<br />
precipitation at LACDPW Station #107D, located in Downey near the Montebello Forebay.<br />
The calculation <strong>of</strong> the Average Annual Groundwater Deficiency represents in general that WRD<br />
needs to replenish about 105,385 AFY assuming long-term average conditions for the water balance<br />
to reach equilibrium, the overall change in storage to equal zero, and groundwater levels to remain<br />
relatively constant. As shown in Table 6, adjustments are made to the long term average inflows<br />
and outflows for the current and ensuing WY to reflect estimates <strong>of</strong> the Annual Overdraft for those<br />
particular years. Based on these adjustments, the current year Annual Overdraft is estimated at<br />
111,300 AF and for the ensuing year 99,300 AF.<br />
Accumulated Overdraft<br />
Section 60023 <strong>of</strong> the <strong>Water</strong> <strong>Replenishment</strong> <strong>District</strong> Act defines "Accumulated Overdraft" as "...the<br />
aggregate amount…by which the quantity <strong>of</strong> ground water removed by any natural or artificial<br />
means from the groundwater supplies…during all preceding water years shall have exceeded the<br />
quantity <strong>of</strong> nonsaline water replaced therein by the replenishment <strong>of</strong> such ground water supplies in<br />
such water years by any natural or artificial means…”<br />
WRD Engineering Survey and Report, 2012<br />
III-2
Groundwater Conditions<br />
In connection with the preparation <strong>of</strong> Bulletin No. 104-Appendix A (1961), the DWR estimated that<br />
the historically utilized storage (Accumulated Overdraft) between the high water year <strong>of</strong> 1904 and<br />
1957 1 was 1,080,000 AF (780,000 in CB, 300,000 in WCB). Much <strong>of</strong> this storage removal was<br />
from the forebay areas (Montebello Forebay and Los Angeles Forebay), where aquifers are merged,<br />
unconfined and serve as the "headwaters" to the confined pressure aquifers. Storage loss from the<br />
confined and completely full, deeper aquifers was minimal in comparison or was replaced by<br />
seawater intrusion, which cannot be accounted for under the language <strong>of</strong> the <strong>Water</strong> Code since it is<br />
considered saline water.<br />
The goal <strong>of</strong> groundwater basin management by WRD is to ensure a sufficient supply <strong>of</strong> safe and<br />
reliable groundwater in the basins for annual use by the pumpers, to keep a sufficient supply in<br />
storage for times <strong>of</strong> drought when imported water supplies may be curtailed for several consecutive<br />
years as well as to keep suitable room available in the basins to receive natural water replenishment<br />
in very wet years, such as an El Niño type year.<br />
To compute the Accumulated Overdraft since this initial amount, WRD takes each consecutive<br />
year's Annual Overdraft and replenishment activities and determines the change in storage. It adds<br />
to or subtracts the corresponding value from the Accumulated Overdraft. Since the base level, the<br />
aggregate excess <strong>of</strong> extractions over recharge from the basins has been reduced due to the<br />
replenishment by WRD, the reduction <strong>of</strong> pumping from the adjudications, and the replenishment<br />
from seawater barrier injection. The Accumulated Overdraft at the end <strong>of</strong> the previous WY was<br />
determined to be 616,300 AF. For the current year, the Accumulated Overdraft is forecast to be<br />
650,600 AF. This could change if hydrology or pumping patterns or planned artificial replenishment<br />
activities vary considerably.<br />
Table 7 presents information for the previous and current Accumulated Overdraft estimate. The<br />
annual changes in storage since 1961/1962 are presented on Table 8.<br />
Groundwater Levels<br />
A groundwater elevation contour map representing water levels within the <strong>District</strong> in fall 2011 (end<br />
<strong>of</strong> the water year) was prepared for this report and is presented as Plate 2. The data for the map<br />
were collected from wells that are screened in the deeper basin aquifers where the majority <strong>of</strong><br />
groundwater pumping occurs. These deeper aquifers include the Upper San Pedro Formation<br />
aquifers, including the Lynwood, Silverado, and Sunnyside. <strong>Water</strong> level data was obtained from<br />
WRD’s network <strong>of</strong> monitoring wells and from groundwater production wells that are screened in the<br />
deeper aquifers.<br />
As can be seen on Plate 2, groundwater elevations range from a high <strong>of</strong> about 180 feet above mean<br />
sea level (msl) in the northeast portion <strong>of</strong> the basin above the spreading grounds in the Whittier<br />
Narrows to a low <strong>of</strong> about 120 feet below msl in the Gardena area. With the exception <strong>of</strong> the<br />
Montebello Forebay and along the West Coast Basin Barrier Project, the majority <strong>of</strong> groundwater<br />
levels in the <strong>District</strong> are below sea level, which is why continued injection at the seawater barriers is<br />
needed to prevent saltwater intrusion.<br />
1 DWR Bulletin 104-A did not refer to the ending year for the storage determination. WRD has assumed it to be the year<br />
1957, as this is the end year for their detailed storage analysis presented in Bulletin 104-B – Safe Yield Determination.<br />
WRD Engineering Survey and Report, 2012<br />
III-3
Groundwater Conditions<br />
Plate 2 also shows the location <strong>of</strong> the key wells used for long-term water level data. These longterm<br />
hydrographs have been presented in the ESR for years, and provide a consistent basis from<br />
which to compare changing water levels. A discussion <strong>of</strong> water levels observed in the key wells is<br />
presented below.<br />
Los Angeles Forebay<br />
The Los Angeles Forebay occupies the westerly portion <strong>of</strong> the Central Basin Non-Pressure Area.<br />
Historically a recharge area for the Los Angeles River, this forebay's recharge capability has been<br />
substantially reduced since the river channel was lined. Recharge is now limited to deep percolation<br />
<strong>of</strong> precipitation, In-Lieu when available, subsurface inflow from the Montebello Forebay, the<br />
northern portion <strong>of</strong> the Central Basin outside <strong>of</strong> WRD's boundary, and relatively small amounts from<br />
the San Fernando Valley through the Los Angeles Narrows.<br />
Key well 2S/13W-10A01 represents the overall water level conditions <strong>of</strong> the Los Angeles Forebay<br />
(see Figure B). The water level high was observed in 1938 and by 1962 water levels had fallen<br />
nearly 180 feet due to basin over-pumping and lack <strong>of</strong> sufficient natural recharge. Since then, basin<br />
adjudication and managed aquifer recharge by WRD and others have improved water levels in this<br />
area by over 80 feet. Over the past 10 years, groundwater levels in this well have remained<br />
relatively constant with only minor fluctuations. This past year saw a rise <strong>of</strong> about 4 feet.<br />
Montebello Forebay<br />
The Montebello Forebay lies in the northeastern portion <strong>of</strong> the Central Basin and connects with the<br />
San Gabriel Basin to the north to the Central Basin via the Whittier Narrows. The Rio Hondo and<br />
San Gabriel River Spreading Grounds in the forebay provide the vast majority <strong>of</strong> artificial recharge<br />
to the Central Basin aquifers. Three key wells help describe the water level conditions in the<br />
Montebello Forebay, a northern well, middle well, and southeastern well (Plate 2):<br />
<br />
<br />
Well 2S/11W-18C07 (WRD Monitoring Well Pico#1, Zone 4) is in the northern part <strong>of</strong> the<br />
Montebello Forebay. It replaces the earlier production well 2S/11W-18K02 that had been used<br />
for over 50 years but has been destroyed. The upper chart on Figure C shows the water levels<br />
for this well. At the end <strong>of</strong> water year 2010/2011, groundwater levels in this well were 17 feet<br />
higher than the previous year.<br />
Well 2S/12W-24M08 (LACDPW Well No. 1601T) is centrally located between the Rio Hondo<br />
and San Gabriel spreading grounds. This well is monitored weekly to assess water levels in the<br />
middle <strong>of</strong> the forebay. The center chart on Figure C shows the water levels for this well. The<br />
historic water level high was observed in 1942, but by 1957 had fallen 117 feet to an all-time low<br />
due to basin over-pumping and insufficient natural recharge. As described above for the Los<br />
Angeles Forebay, adjudication <strong>of</strong> pumping rights and managed aquifer recharge helped restore<br />
water levels in the Montebello Forebay. Due to drought and lack <strong>of</strong> discounted replenishment<br />
water, this well had recently been experiencing dropping water levels and reached a 32-year low<br />
in 2009. However in WY 2009/2010 and 2010/2011 water levels recovered considerably due to<br />
above normal precipitation and purchase <strong>of</strong> replenishment water by WRD. At the end <strong>of</strong> WY<br />
2010/2011, groundwater levels in this well were 29 feet higher than the previous year.<br />
WRD Engineering Survey and Report, 2012<br />
III-4
Groundwater Conditions<br />
<br />
Well 3S/12W-01A06 (LACDPW Well No. 1615P) is located downgradient and southeast <strong>of</strong> the<br />
spreading grounds near the southern end <strong>of</strong> the Montebello Forebay. <strong>Water</strong> level responses in<br />
this well are typically less pronounced than the other two wells because it is further from the<br />
spreading grounds and the recharge that occurs there. However at the end <strong>of</strong> water year<br />
2010/2011, groundwater levels in this well were 14 feet higher than the previous year, indicating<br />
this well responded considerably to the spreading grounds recharge and possibly the Long Beach<br />
In-Lieu program. The lower chart on Figure C shows the water levels for this well.<br />
Central Basin Pressure Area<br />
The <strong>District</strong> monitors key wells 4S/13W-12K01 (LACDPW No. 906D) and 4S/12W-28H09<br />
(LACDPW No. 460K) which represent the conditions <strong>of</strong> the pressurized groundwater levels in the<br />
Central Basin Pressure Area. The hydrographs for these two wells are shown on Figure D.<br />
Groundwater highs were observed in these wells in 1935 when they began to continually drop over<br />
110 feet until their lows in 1961 due to the over-pumping and insufficient natural recharge.<br />
Groundwater levels recovered substantially during the early 1960s as a result <strong>of</strong> replenishment<br />
operations and reduced pumping. Between 1995 and 2007 there have been 100-foot swings in water<br />
levels each year from winter to summer. These swings were due to pumping pattern changes by<br />
some <strong>of</strong> the Central Basin producers who operate with more groundwater in the summer months and<br />
less groundwater in the winter months, and took advantage <strong>of</strong> the MWD and WRD In-Lieu<br />
programs. From May 2007 to March 2011 the In-Lieu water has not been available, so pumping<br />
remained more constant throughout the year and the water levels remain low without the rebound as<br />
shown in the two hydrographs. Between October 2010 and January 2011 the City <strong>of</strong> Long Beach<br />
shut down their wells for operational purposes which caused water levels to rebound nearly 50 feet,<br />
then the wells turned back on for two months and water levels fell 25 feet, and the wells were shut<br />
<strong>of</strong>f again through October when MWD In-Lieu water became available and water levels rose 55 feet.<br />
The overall net rise between October 2010 and October 2011 was nearly 80 feet.<br />
At the end <strong>of</strong> WY 2010/2011, water levels in well 4S/13W-12K01 were 50 feet higher than the<br />
previous year and well 4S/12W-28H09 was 79 feet higher than the previous year.<br />
West Coast Basin<br />
The West Coast Basin is separated from the Central Basin by the Newport-Inglewood Uplift which<br />
is a series <strong>of</strong> discontinuous, subparallel hills and faults that may act as a partial barrier to<br />
groundwater flow in some places. Groundwater moves across the uplift based on water levels on<br />
either side <strong>of</strong> the uplift and the “tightness” <strong>of</strong> the fault along various reaches.<br />
Figure E shows the hydrographs <strong>of</strong> key wells 3S/14W-22L01 (LACDPW No. 760C) and WRD’s<br />
monitoring well Wilmington 1_3 which replaced 4S/13W-22P01 due to a lack <strong>of</strong> data from the later<br />
well. These two wells represent the general conditions <strong>of</strong> the water levels in the West Coast Basin.<br />
In 1955, the control <strong>of</strong> groundwater extractions in the West Coast Basin resulted in stabilizing and<br />
reversal <strong>of</strong> the declining water levels in the center <strong>of</strong> the basin (well 3S/14W-22L01), whereas at the<br />
eastern end near the Dominguez Gap Barrier water levels continued to decline until about 1971,<br />
when a recovery began due mostly to the startup <strong>of</strong> the Dominguez Gap Barrier Project. For the<br />
previous year 2010/2011, water levels in both wells were about 2 feet higher than the previous year.<br />
WRD Engineering Survey and Report, 2012<br />
III-5
Groundwater Conditions<br />
<strong>Water</strong> levels in the West Coast Basin are expected to rise another couple feet in the current year due<br />
to reduced pumping and increased injection.<br />
Plate 3 shows the water level changes over the entire CBWCB over the previous water year.<br />
Because <strong>of</strong> the storm water captured, the purchase <strong>of</strong> replenishment water by WRD (both Tier 1 and<br />
discounted), and the WRD-Long Beach In-Lieu program, the Montebello Forebay experienced a rise<br />
<strong>of</strong> up to 30 feet and the Long Beach area rose over 90 feet compared to the previous year. The West<br />
Coast Basin was less impacted and generally saw increases up to 10 feet in some areas and decreases<br />
<strong>of</strong> up to 5 feet in other areas.<br />
For the current WY, rainfall is below normal so far and MWD is not <strong>of</strong>fering its replenishment<br />
programs. In addition, pumping is greater than the previous year. Therefore, although WRD is<br />
maximizing recycled water replenishment within regulatory limits, the <strong>District</strong> expects a decrease in<br />
water levels in both the Central Basin and West Coast Basin in WY 2011/12 as compared to the<br />
previous year 2009/2010.<br />
Based on the current groundwater levels in the CBWCB and the anticipated replenishment activities<br />
by WRD, the <strong>District</strong> anticipates having sufficient supplies <strong>of</strong> safe and reliable groundwater to meet<br />
the demands <strong>of</strong> the pumpers in the ensuing year.<br />
Change in Storage<br />
The <strong>District</strong> determines the change in storage by comparing water levels from one year to the next.<br />
Rising water levels means an increase in storage groundwater whereas a drop in water levels means<br />
a decrease in storage. Using groundwater elevation data collected from WRD's monitoring well<br />
network and selected production wells, the <strong>District</strong> constructs a groundwater level change map<br />
showing water level differences from one year to the next (Plate 3). The data from this map are<br />
multiplied by the storage coefficient values for the aquifers as obtained from the USGS calibrated<br />
model <strong>of</strong> the <strong>District</strong> to produce the change in storage estimate for the previous water year.<br />
As reported in the Annual Overdraft discussion, the gain in storage in WY 2010/2011 was 110,000<br />
AF. This was the highest gain in storage recorded by the <strong>District</strong> and was caused by a wet winter<br />
and abundant stormwater capture, the purchase <strong>of</strong> imported replenishment water by WRD, reduced<br />
pumping, and the WRD-Long Beach In-Lieu program. In addition, the relatively low groundwater<br />
levels prior to this year allowed the storage space for this water to be captured. The basins are<br />
operating well and as intended by WRD – rising when water is plentiful and demands are low, and<br />
draining when replenishment water is lacking and demands are high. In the past 10 years,<br />
groundwater in storage has declined on average by 400 AF per year. Table 8 provides the historical<br />
groundwater storage changes in the CBWCB.<br />
Optimum Groundwater Quantity<br />
In response to a 2002 State audit <strong>of</strong> the <strong>District</strong>’s activities, the Board <strong>of</strong> Directors adopted an<br />
Optimum Quantity for groundwater amounts in the Central and West Coast Basins. The Optimum<br />
Quantity is based on the Accumulated Overdraft (AOD) concept described in the <strong>Water</strong> Code and in<br />
this ESR. The historic maximum groundwater drawdown due to over pumping reported in the<br />
CBWCB between 1904 and 1957 was 1,080,000 AF. This is defined as the historic maximum AOD.<br />
As pumping eased and artificial replenishment occurred, more water was put back into the basins<br />
and the AOD was reduced resulting in rising water levels.<br />
WRD Engineering Survey and Report, 2012<br />
III-6
Groundwater Conditions<br />
After considerable analysis and discussion, the Board <strong>of</strong> Directors on April 19, 2006 established an<br />
Optimum Quantity <strong>of</strong> an AOD <strong>of</strong> 612,000 AF. This value was based on an extensive review <strong>of</strong> over<br />
70 years <strong>of</strong> water level fluctuations in the <strong>District</strong> and recognizing that at the end <strong>of</strong> WY 1999/2000<br />
groundwater amounts were at a healthy quantity to sustain the adjudicated pumping rights in the<br />
basins. The AOD at that time was 611,900 AF (rounded to 612,000 AF), and therefore was set by<br />
the Board <strong>of</strong> Directors as the new Optimum Quantity.<br />
The Board <strong>of</strong> Directors at that April 19, 2006 meeting also adopted a policy to make up the<br />
Optimum Quantity should it fall too low. The policy is as follows:<br />
An Accumulated Overdraft greater than the Optimum Quantity is a deficit. WRD will<br />
make up the deficit within a 20 year period as decided by the Board on an annual<br />
basis. If the deficit is within 5 percent <strong>of</strong> the Optimum Quantity, then no action needs<br />
to be taken to allow for natural replenishment to makeup the deficit.<br />
Since the end <strong>of</strong> WY 1999/2000 a total <strong>of</strong> approximately 4,300 AF have been lost from storage,<br />
brining the AOD down to 616,300 AF from its Optimum Quantity. Based on the adopted policy, the<br />
Board will not need to consider options to make up the AOD at this time.<br />
WRD Engineering Survey and Report, 2012<br />
III-7
CHAPTER IV<br />
GROUNDWATER REPLENISHMENT:<br />
QUANTITIES, AVAILABILITY, AND COSTS<br />
Groundwater <strong>Replenishment</strong><br />
As discussed in the previous chapter, the Central Basin and West Coast Basin (CBWCB) have an<br />
annual overdraft because more groundwater is pumped out than is replaced naturally. The <strong>District</strong><br />
purchases supplemental water (artificial replenishment water) each year to help <strong>of</strong>fset this overdraft<br />
through managed aquifer recharge. The purchased water enters the groundwater basins at the<br />
Montebello Forebay spreading grounds, at the seawater barrier injection wells, and through the<br />
<strong>District</strong>'s In-Lieu Program. The purpose <strong>of</strong> this Chapter is to determine the quantities <strong>of</strong> water<br />
needed for purchase in the ensuing year and to determine the availability and cost <strong>of</strong> that water.<br />
Sources <strong>of</strong> <strong>Replenishment</strong> <strong>Water</strong><br />
The <strong>District</strong> currently has available to it recycled and imported water sources for use as artificial<br />
replenishment water. These two sources are described below:<br />
<br />
<br />
Recycled <strong>Water</strong>: Recycled water is wastewater from the sewer systems that is reclaimed through<br />
extensive treatment at water reclamation plants (“WRP”s). The water is treated to high quality<br />
standards so that it can be reused safely. Some agencies and businesses use recycled water for<br />
non-potable purposes, such as for irrigation <strong>of</strong> parks, golf courses, and street medians, or for<br />
industrial purposes. WRD has used recycled water for groundwater recharge since 1962 and so<br />
this year, 2012, celebrates WRD’s 50 th anniversary <strong>of</strong> using recycled water for groundwater<br />
recharge. In semi-arid areas such as <strong>Southern</strong> <strong>California</strong> where groundwater and imported<br />
water are in short supply, recycled water has proven to be a safe and reliable additional<br />
resource to supplement the water supply. Recycled water is used at the spreading grounds and<br />
the seawater barrier wells. Although recycled water is high quality, relatively low cost, and a<br />
reliable supply all year long, the <strong>District</strong> is limited by regulatory agencies in the amount it can<br />
use for replenishment. Therefore, imported water is also used for recharge.<br />
Imported <strong>Water</strong>: River water from northern <strong>California</strong> (State <strong>Water</strong> Project) and the Colorado<br />
River is imported into <strong>Southern</strong> <strong>California</strong> by the Metropolitan <strong>Water</strong> <strong>District</strong> <strong>of</strong> <strong>Southern</strong><br />
<strong>California</strong> (“MWD” or “Met”). MWD then sells this water to their member agencies for<br />
multiple uses, including potable water and recharge water. WRD uses raw (untreated) imported<br />
water at the spreading grounds and potable (treated) imported water at the seawater intrusion<br />
barriers and for the In-Lieu program for groundwater recharge. Because <strong>of</strong> treatment and<br />
transportation costs, it is the most expensive source for recharge water. The supply is under full<br />
upstream control, and its availability at the spreading grounds is limited and variable, especially<br />
during drought years. In fact, from May 2007 through May 2011 MWD stopped delivery <strong>of</strong> its<br />
historically available discounted replenishment and In-Lieu waters due to reduced supply,<br />
environmental issues and judicial decisions. They <strong>of</strong>fered a limited quantity (225,000 AF) for all<br />
their customers between May and September 2011, but that amount was quickly used up and no<br />
discounted water has been <strong>of</strong>fered since. MWD is currently reviewing their replenishment<br />
program and is expected to adopt a policy for a new program some time in 2012. As a result <strong>of</strong><br />
the lack <strong>of</strong> discounted replenishment water, the <strong>District</strong> must plan on purchasing the more<br />
expensive Tier 1 water from MWD member agencies for spreading and In-Lieu. Barrier<br />
injection water continues to be purchased at the non-interruptible Tier 1 rate.<br />
WRD Engineering Survey and Report, 2012<br />
IV-1
Groundwater <strong>Replenishment</strong><br />
Recommended Quantities <strong>of</strong> <strong>Replenishment</strong> <strong>Water</strong><br />
With information presented in the preceding chapters regarding the pumping demands in the<br />
CBWCB and the overall condition <strong>of</strong> the groundwater basins, WRD can estimate its projected need<br />
for replenishment water in the ensuing year.<br />
Spreading<br />
Groundwater recharge through surface spreading occurs in the Montebello Forebay Spreading<br />
Grounds adjacent to the Rio Hondo and the San Gabriel River, within the unlined portion <strong>of</strong> the San<br />
Gabriel River, and behind the Whittier Narrows Dam in the Whittier Narrows Reservoir. Owned<br />
and operated by the Los Angeles County Department <strong>of</strong> Public Works (“LACDPW”), they were<br />
originally constructed in 1938 for flood control and conservation <strong>of</strong> local storm water, but have been<br />
used since the 1950s to replenish the basins with imported water and since 1962 with recycled water.<br />
Since recycled water is a high quality, less expensive, and available year-round source <strong>of</strong><br />
replenishment water, the <strong>District</strong> maximizes its use within established regulatory limits. These<br />
limits are discussed below under “Expected Availability <strong>of</strong> <strong>Replenishment</strong> <strong>Water</strong>”. In general, the<br />
<strong>District</strong> plans on purchasing 50,000 AF in the ensuing year to maximize the amount under regulatory<br />
limits, unless lack <strong>of</strong> dilution water (storm water and imported water) causes a reduction in the<br />
recycled water amounts. Currently the WRD is working closely with CSDLAC and LACDPW to<br />
maximize the spreading <strong>of</strong> recycled water.<br />
Additional replenishment water is needed beyond the 50,000 AFY <strong>of</strong> recycled water and will have to<br />
come from imported water. In 2003, the WRD Board adopted the long term average <strong>of</strong> 27,600 AFY<br />
<strong>of</strong> imported water to purchase for spreading. This value was based on long-term (30 year) averages<br />
<strong>of</strong> the overall water budget <strong>of</strong> the basins using the USGS computer model. The 2003 ESR discusses<br />
the derivation <strong>of</strong> this value in more detail.<br />
Since that time, the <strong>District</strong> has invested in cooperative projects with the LACDPW to capture more<br />
storm water and to lessen the need for imported water as part <strong>of</strong> WRD’s <strong>Water</strong> Independence Now<br />
program, or WIN. Improvements to the Whittier Narrows Conservation Pool are expected to<br />
conserve an additional 3,000 AFY <strong>of</strong> storm water on average. Two new rubber dams were built in<br />
the San Gabriel River near Valley Boulevard and are expected to conserve an additional 3,600 AFY<br />
on average. Therefore, the new Long Term Average for imported spreading demands is 21,000<br />
AFY.<br />
During the 2012/2013 budget workshops in March, April and May 2012, the <strong>District</strong> presented<br />
various alternatives to imported water spreading purchases for the ensuing year. Considerations<br />
were made to increase purchases beyond 21,000 AF to makeup previously unavailable water,<br />
keeping the long-term average for purchase, or reducing the spreading water next year to take<br />
advantage <strong>of</strong> the extra spreading water purchased the past two years and the special Long Beach In-<br />
Lieu program that both significantly increased water levels in the groundwater basins. At the May 4,<br />
2012 Board <strong>of</strong> Directors’ meeting, the Board adopted a budget and replenishment assessment to<br />
reflect an imported spreading water purchase <strong>of</strong> 2,180 AF for the ensuing year. This amount plus<br />
the recycled demand cited earlier brings the total WRD spreading needs for the ensuing year to<br />
51,280 AF (50,000 AF recycled and 2,180 AF imported).<br />
Table 9 presents the currently anticipated imported water replenishment needs.<br />
WRD Engineering Survey and Report, 2012<br />
IV-2
Groundwater <strong>Replenishment</strong><br />
Injection<br />
Another way <strong>of</strong> replenishing the groundwater supply is to inject water at the three seawater intrusion<br />
barriers owned and operated by the LACDPW, including the West Coast Basin Barrier, Dominguez<br />
Gap Barrier, and Alamitos Barrier. Although the primary purpose <strong>of</strong> the barriers is for seawater<br />
intrusion control, groundwater replenishment also occurs as the freshwater is injected into the<br />
CBWCB aquifers and then moves inland towards pumping wells.<br />
To determine the amount <strong>of</strong> barrier water estimated for the ensuing year, WRD under an Agreement<br />
with LACDPW gets annual estimates from the expected demand at the barriers. WRD reviews these<br />
estimates and makes adjustments as necessary. For the ensuing year, WRD estimates for the West<br />
Coast Basin Barrier Project 18,000 AF will be injected <strong>of</strong> which 13,500 AF (75%) is recycled water<br />
and 4,500 AF (25%) is imported water. These numbers may change depending on recycled water<br />
availability from WBMWD. For the Dominguez Gap Barrier Project, 8,000 AF <strong>of</strong> imported water<br />
are estimated for injection and no recycled water since the City <strong>of</strong> Los Angeles’ Terminal Island<br />
Treatment Plant, which provides recycled water to the barrier, is currently shut down for major<br />
upgrades and improvements. For the Alamitos Barrier Project, 4,340 AF are estimated to be<br />
purchased by WRD (does not include barrier water purchased by Orange County <strong>Water</strong> <strong>District</strong>)<br />
which includes 1,800 AF (41%) <strong>of</strong> recycled water and 2,540 AF (59%) <strong>of</strong> imported water.<br />
The total barrier demand for WRD in the ensuing year is estimated at 30,340 AF, including 13,040<br />
AF imported water (43%) and 17,300 AF recycled water (57%) (see Table 9).<br />
In-Lieu <strong>Replenishment</strong> <strong>Water</strong><br />
The basic premise <strong>of</strong> WRD’s In-Lieu Program is to <strong>of</strong>fset the pumping in the basin to lower the<br />
annual overdraft and reduce the artificial replenishment needs. It helps provide an alternate means<br />
<strong>of</strong> replenishing the groundwater supply by encouraging basin pumpers to purchase discounted<br />
imported water when available instead <strong>of</strong> pumping groundwater. This can help raise water levels in<br />
areas that are otherwise more difficult to address. From May 2007 through May 2011, and from<br />
October 2011 to present the In-Lieu water has not been made available by MWD. WRD took<br />
advantage <strong>of</strong> the limited availability between May 2011 and September 2011 to hold a special In-<br />
Lieu program with the City <strong>of</strong> Long Beach where they reduced all pumping and significantly raised<br />
water levels in the basin (see Chapter III). However, because MWD is not currently <strong>of</strong>fering the<br />
program, WRD is not expecting to include the In-Lieu program in the ensuing year, although may<br />
consider new programs if they come along.<br />
Expected Availability <strong>of</strong> <strong>Replenishment</strong> <strong>Water</strong><br />
The availability <strong>of</strong> water supplies for the ensuing water year has been taken into account when<br />
determining how funds should be raised. If a particular resource is expected to be unavailable<br />
during a given year, money can still be raised to fund the purchase <strong>of</strong> that quantity <strong>of</strong> water in a<br />
succeeding year.<br />
Recycled <strong>Water</strong><br />
Recycled water is reliable all year round but its use is capped by regulatory limits. The current<br />
limits for recycled water spreading in the Montebello Forebay are established by the <strong>California</strong><br />
Regional <strong>Water</strong> Quality Control Board (RWQCB) and are detailed in Order No. 91-100 adopted on<br />
WRD Engineering Survey and Report, 2012<br />
IV-3
Groundwater <strong>Replenishment</strong><br />
September 9, 1991 with amendments on April 2, 2009 under Order No. R4-2009-0048. The <strong>District</strong><br />
is limited to spreading 35% recycled water over a 5-year period based on the total inflow <strong>of</strong> all<br />
waters into the Montebello Forebay, meaning that at least 65% <strong>of</strong> the waters entering the forebay<br />
must be dilution waters such as storm water, underflow, rainfall, and imported water. As these<br />
dilution sources become scarce due to dry years or continued lack <strong>of</strong> imported replenishment water,<br />
the amount <strong>of</strong> recycled water will have to be reduced to maintain the 35% regulatory cap.<br />
Alternatively, if dilution sources are higher than average from wet years and/or substantial imported<br />
water availability, additional recycled water can be spread to remain within the 35% cap.<br />
The Sanitation <strong>District</strong>s <strong>of</strong> Los Angeles County (SDLAC) provides the recycled water to WRD for<br />
spreading by LACDPW. This water comes from the Whittier Narrows <strong>Water</strong> Reclamation Plant<br />
(“WNWRP”), San Jose Creek <strong>Water</strong> Reclamation Plant (“SJCWRP”), and Pomona <strong>Water</strong><br />
Reclamation Plant (“PWRP”). WRD purchases water from the WNWRP and SJCWRP, whereas the<br />
water from the PWRP is incidental recharge to the river channels and is not purchased by WRD. For<br />
planning purposes, the <strong>District</strong> assumes purchasing 50,000 AFY <strong>of</strong> recycled water each year to meet<br />
the regulatory cap, although these amounts can vary throughout the year based on percentage limits<br />
and availability <strong>of</strong> the recycled water and spreading grounds. Table 2 shows the breakdown<br />
amounts for these purchases.<br />
Recycled water for injection into the seawater barrier wells comes from different agencies depending<br />
on the specific barrier. At the WCBBP, the water is provided by WBMWD's Edward C. Little<br />
<strong>Water</strong> Recycling Facility. Per regulatory limits, this resource can provide up to 75% <strong>of</strong> the water<br />
injected into the West Coast Basin Barrier with an increase up to 100% being planned under their<br />
Phase V construction activities. Because <strong>of</strong> recent operational issues at the treatment, only about<br />
40% to 75% recycled water has been available to the barriers with imported water making up the<br />
difference. For the ensuing year, it will be estimated that 75% <strong>of</strong> the barrier water will be recycled<br />
water, although the Phase V plant expansion is expected to be completed and could increase the<br />
recycled water percentage.<br />
Recycled water for the DGBP is typically available from the City <strong>of</strong> Los Angeles’ Terminal Island<br />
Treatment Plant (Harbor Recycled <strong>Water</strong> Project). The plant is permitted to provide the barrier with<br />
up to 5 million gallons per day (mgd) or 5,600 AFY, or 50% <strong>of</strong> the total barrier supply, whichever is<br />
less. On November 1, 2011, the plant was shut down for at least a year for significant upgrades and<br />
improvements. When back online, it is expected that the plant will be able to consistently close to<br />
the permitted amount <strong>of</strong> recycled water. Because the plant is currently shut down, it is anticipated<br />
for the ensuing year that all 8,000 AF will be imported water.<br />
Recycled water for the ABP is available from WRD's Leo J. Vander Lans <strong>Water</strong> Treatment Facility.<br />
This treatment plant is permitted to provide up to 50% <strong>of</strong> barrier water with recycled water with the<br />
remainder being imported, although actual operational conditions have <strong>of</strong>ten produced less than 50%<br />
recycled water. The facility is undergoing final design to expand to 100% recycled water in a couple<br />
<strong>of</strong> years. But for the ensuing year, 4,340 AF are estimated to be purchased by WRD (does not<br />
include barrier water purchased by Orange County <strong>Water</strong> <strong>District</strong>) which includes 1,800 AF (41%)<br />
<strong>of</strong> recycled water and 2,540 AF (59%) <strong>of</strong> imported water.<br />
WRD Engineering Survey and Report, 2012<br />
IV-4
Groundwater <strong>Replenishment</strong><br />
Imported <strong>Water</strong><br />
Since October 2011, MWD terminated its temporary discounted replenishment water program<br />
(available from May-September 2011) and has not yet <strong>of</strong>fered a new replenishment program. As<br />
imported deliveries are cut back during dry years or with climate change or extended periods <strong>of</strong><br />
drought, WRD will look at other sources for replenishment water such as increased use <strong>of</strong> recycled<br />
water and storm water. However, in the meantime, WRD must plan on purchasing the more<br />
expensive Tier 1 water for spreading and In-Lieu. The purchase <strong>of</strong> Tier 1 water occurred for the first<br />
time for WRD in 2009/2010 and continued into 2010/2011 and into the ensuing year 2011/2012.<br />
For the imported water used for injection at the seawater barrier wells, the <strong>District</strong> pays the premium<br />
price for “non-interruptible” treated Tier 1 water meaning that it will be available all year long.<br />
Because <strong>of</strong> the increasing water costs at the barriers, the <strong>District</strong> is looking at ways to minimize costs<br />
such as reduction <strong>of</strong> pumping near the barriers, increased recycled water to <strong>of</strong>fset imported water, or<br />
banking water at lower seasonal rates. At the ABP, the City <strong>of</strong> Long Beach and WRD have entered<br />
into an agreement to bank seasonal treated water and Tier 1 water through inland injection wells and<br />
then extract the water for injection at the barriers when needed, thus saving considerable costs on<br />
barrier water. In 2009/2010, the 2,000 AF <strong>of</strong> Tier 1 water banked in 2008/2009 was utilized. The<br />
seasonal water banked in 2004/2005 through 2006/2007 has 2,160 AF remaining and can be called at<br />
any time that serves the <strong>District</strong> most effectively.<br />
Projected Cost <strong>of</strong> <strong>Replenishment</strong> <strong>Water</strong><br />
WRD has estimated it will need 82,520 AF <strong>of</strong> replenishment water in the ensuing year. Using<br />
currently available information and estimates for the cost <strong>of</strong> replenishment water to WRD from the<br />
various water suppliers, the 82,520 AF will cost WRD approximately $29,368,625.<br />
Tables 1 and 2 provide a detailed breakdown <strong>of</strong> the estimated replenishment water costs for the<br />
ensuing water year. These estimated costs are for water purchases only and do not include the<br />
additional costs for projects and programs required to replenish the basins and to protect<br />
groundwater quality. These projects and programs are discussed in detail in Chapter V. The<br />
anticipated costs <strong>of</strong> these projects and programs have been discussed in <strong>District</strong> budget workshops<br />
held in March, April and May which led to the Board <strong>of</strong> Directors adopting the 2012/2013<br />
<strong>Replenishment</strong> Assessment <strong>of</strong> $244/AF on May 4, 2012. This assessment is unchanged from the<br />
previous year.<br />
WRD Engineering Survey and Report, 2012<br />
IV-5
CHAPTER V<br />
PROJECTS AND PROGRAMS<br />
Projects and Programs<br />
<strong>California</strong> <strong>Water</strong> Code Sections 60220 through 60226 describe the broad purposes and powers <strong>of</strong> the<br />
<strong>District</strong> to perform any acts necessary to replenish, protect, and preserve the groundwater supplies <strong>of</strong><br />
the <strong>District</strong>. In order to meet its statutory responsibilities, WRD has instituted numerous projects<br />
and programs in a continuing effort to effectively manage groundwater replenishment and<br />
groundwater quality in the Central Basin and West Coast Basin (“CBWCB”). These projects and<br />
programs include activities that enhance the replenishment program, increase the reliability <strong>of</strong> the<br />
groundwater resources, improve and protect groundwater quality, and ensure that the groundwater<br />
supplies are suitable for beneficial uses.<br />
These projects and programs have had a positive influence on the basins, and WRD anticipates<br />
continuing these activities into the ensuing year. The following is a discussion <strong>of</strong> the projects and<br />
programs that WRD intends to continue or initiate during the ensuing year.<br />
001 – Leo J. Vander Lans <strong>Water</strong> Treatment Facility Project<br />
The Leo J. Vander Lans <strong>Water</strong> Treatment Facility provides advanced treated recycled water to the<br />
Alamitos Seawater Intrusion Barrier. The facility receives tertiary-treated water from the Sanitation<br />
<strong>District</strong>s and provides the advanced treatment through a process train that includes micr<strong>of</strong>iltration,<br />
reverse-osmosis, and ultraviolet light. The facility’s operations permit was approved by the Los<br />
Angeles Regional <strong>Water</strong> Quality Control Board on September 1, 2005, and the replenishment<br />
operations <strong>of</strong> this facility started in October 2005. The product water has since been discharging to<br />
the barrier to replace up to 50% <strong>of</strong> the potable imported water currently used, thereby improving the<br />
reliability and quality <strong>of</strong> the water supply to the barrier. The plant is designed to produce<br />
approximately 3,000 acre-feet per year (AFY) for delivery to the barrier. The Long Beach <strong>Water</strong><br />
Department (LBWD) is responsible for operation and maintenance <strong>of</strong> the treatment plant under<br />
contract with WRD.<br />
Final design is in progress to expand the capacity <strong>of</strong> the facility so that it can provide up to 100% <strong>of</strong><br />
the barrier with full advanced treated recycled water thereby eliminating the need for the imported<br />
water. Expected costs for the coming year will involve operation and maintenance <strong>of</strong> the plant,<br />
construction for plant expansion, as well as groundwater monitoring at the barrier. Because the<br />
primary purpose <strong>of</strong> this project is to provide a more reliable means <strong>of</strong> replenishing the basin through<br />
injection, 100% <strong>of</strong> the costs are considered to be drawn from the <strong>Replenishment</strong> Fund.<br />
002 – Robert W. Goldsworthy Desalter Project<br />
The Robert W. Goldsworthy Desalter has been operating since 2002 to remove brackish<br />
groundwater from a saline plume in the Torrance area that was stranded inland <strong>of</strong> the West Coast<br />
Basin Barrier after the barrier was put into operation in the 1950s and 1960s. The production well<br />
and desalting facility are located within the City <strong>of</strong> Torrance (City), and the product water is<br />
delivered for potable use to the City’s distribution system. The treatment plan capacity is about<br />
2,200 AFY. The City is responsible for operation and maintenance <strong>of</strong> the treatment plant under<br />
contract with WRD.<br />
WRD Engineering Survey and Report, 2012 V-1
Projects and Programs<br />
The <strong>District</strong> is conducting a feasibility study to evaluate the expansion <strong>of</strong> the treatment plant.<br />
Expected costs for the coming year will involve operation and maintenance <strong>of</strong> the plant and the<br />
feasibility study for the expansion. The purpose <strong>of</strong> the desalter is directly related to remediating<br />
degraded groundwater quality, and costs are thus attributed 100% to the Clean <strong>Water</strong> Fund.<br />
Additional measures may be necessary in the future to fully contain and remediate the saline plume,<br />
which extends outside <strong>of</strong> the Torrance area. WRD is conducting a water master plan on the West<br />
Coast Basin for long-term solutions to this problem. The <strong>District</strong> continues to work with the City <strong>of</strong><br />
Torrance Municipal <strong>Water</strong> Department, the pumpers’ Technical Advisory Committee, and other<br />
stakeholders on the future <strong>of</strong> the saline plume removal in the West Coast Basin.<br />
004 – Recycled <strong>Water</strong> Program<br />
Recycled water (reclaimed municipal wastewater) has been used for groundwater recharge by WRD<br />
since 1962. This year 2012 is our 50 th year <strong>of</strong> successfully using recycled water for groundwater<br />
recharge. Using recycled water to replenish the groundwater basins provides a reliable source <strong>of</strong><br />
high quality water for surface spreading in the Montebello Forebay and injection at the seawater<br />
intrusion barriers. In view <strong>of</strong> the drought conditions that periodically occur in <strong>California</strong> and<br />
uncertainty in the future availability and cost <strong>of</strong> imported supplies, this resource has become<br />
increasingly vital as a replenishment source.<br />
WRD participates in various research and testing activities to ensure that the use <strong>of</strong> recycled water<br />
continues to be a safe and reliable resource for groundwater recharge. WRD, along with other<br />
stakeholders, is working closely with the <strong>California</strong> Department <strong>of</strong> Public Health (“CDPH”) to<br />
review and to update the regulations on groundwater recharge using recycled water. Through this<br />
dialogue, WRD and CDPH exchange information and develop a mutual understanding <strong>of</strong> each<br />
agency’s perspectives.<br />
From an operational standpoint, the <strong>District</strong> continues to coordinate with the SDLAC with permit<br />
compliance activities, including groundwater monitoring and reporting, to ensure that the current<br />
practice and operation <strong>of</strong> replenishing with recycled water continues to be safe. Many monitoring<br />
wells and production wells are sampled frequently by WRD staff, and the results are reported as<br />
required to the regulatory agencies.<br />
In addition to regular monitoring and sampling around the spreading grounds, WRD is partnering<br />
with others to more fully investigate the effectiveness <strong>of</strong> soil aquifer treatment (“SAT”) during<br />
recharge activities. Research is being conducted by specialists and experts and includes specific<br />
tests to characterize the percolation process and to quantify the filtering and purifying properties <strong>of</strong><br />
the underlying soil with respect to constituents <strong>of</strong> concern, such as nitrogen, total organic carbon,<br />
and chemicals <strong>of</strong> emerging concern (CECs). The <strong>District</strong> continues to be vigilant in monitoring<br />
research on the detection, significance, and treatment <strong>of</strong> CECs, such as pharmaceuticals, endocrine<br />
disruptors, and personal care products.<br />
Three separate groundwater tracer studies to track and verify the movement <strong>of</strong> water from the<br />
spreading grounds and monitoring wells and production wells have been performed in 2003-2005,<br />
2005-2006, and 2010-2011. Results showed that the depth rather than the horizontal distance from<br />
WRD Engineering Survey and Report, 2012 V-2
Projects and Programs<br />
the recharge ponds is the key factor influencing arrival times <strong>of</strong> water to wells (travel time to deeper<br />
wells is greater than to shallower wells, even if the deeper wells are very near the spreading<br />
grounds). In some cases, WRD made modifications to wells to seal <strong>of</strong>f their shallow perforations so<br />
that the wells would only produce from the deeper aquifers. Tracer tests subsequent to well<br />
modification demonstrated an increased travel time compared to earlier results. These efforts, in<br />
addition to periodic studies assessing health effects and toxicological issues, are necessary to provide<br />
continued assurances that recycled water for groundwater recharge remains safe and compliant with<br />
regulatory standards in the local basins.<br />
Recycled water is also injected into the three seawater intrusion barriers in Los Angeles County<br />
(Alamitos, West Coast, and Dominguez Gap barriers). WRD has its Leo J. Vander Lans <strong>Water</strong><br />
Treatment Facility to produce recycled water for the Alamitos Barrier. The City <strong>of</strong> Los Angeles<br />
operates the Terminal Island <strong>Water</strong> Reclamation Plant to produce recycled water for the Dominguez<br />
Gap Barrier. And the West Basin Municipal <strong>Water</strong> <strong>District</strong>s operates its Edward C. Little <strong>Water</strong><br />
Recycling Facility to produce recycled water for the West Coast Barrier. Extensive monitoring and<br />
modeling <strong>of</strong> the treated water is continually performed to ensure the treatment plants are operating as<br />
intended and that the injected water is making a positive contribution to the groundwater basins.<br />
Projects under this program help to improve the reliability and utilization <strong>of</strong> an available local<br />
resource, i.e. locally produced recycled water. This resource is used to improve replenishment<br />
capabilities and is thus funded 100% from the <strong>Replenishment</strong> Fund.<br />
005 – Groundwater Resources Planning Program<br />
The Groundwater Resources Planning Program was instituted to evaluate basin management issues<br />
and to provide a means <strong>of</strong> assessing project impacts over the CBWCB. Prior to moving forward<br />
with a new project, an extensive evaluation is undertaken. Within the Groundwater Resources<br />
Planning Program, new projects and programs are analyzed based on benefits to overall basin<br />
management. This analysis includes performing an extensive economic evaluation to compare<br />
estimated costs with anticipated benefits. As part <strong>of</strong> this evaluation process, all new capital projects<br />
are brought to the <strong>District</strong>’s Technical Advisory Committee for review and recommendation.<br />
One <strong>of</strong> the main programs currently underway is the development <strong>of</strong> a Master Plan for the CBWCB.<br />
This effort is to identify future pumping demands so that the <strong>District</strong> can be prepared for future<br />
replenishment needs. In the upcoming year, the focus will be on the development <strong>of</strong> a Programmatic<br />
Environmental Impact Report (PEIR) for this Master Plan. Also under this program, <strong>District</strong> staff<br />
will continue to monitor State and Federal funding programs to determine applicability to the<br />
<strong>District</strong>’s list <strong>of</strong> potential projects. In the coming year, the <strong>District</strong> will continue participation in<br />
Integrated Regional <strong>Water</strong> Management Planning (“IRWMP”) for Greater Los Angeles County.<br />
Collaborative development <strong>of</strong> the region’s IRWM plan is a requirement for entities to secure grant<br />
funding under Proposition 84 and Proposition 1E which were passed in November 2006. It is<br />
expected that this plan will play a significant role in future grant funding opportunities at the Local,<br />
State and Federal levels. <strong>District</strong> staff will also monitor the ongoing AB303 and <strong>Water</strong>SMART<br />
grant funding programs.<br />
WRD Engineering Survey and Report, 2012 V-3
Projects and Programs<br />
Projects under the Groundwater Resources Planning Program serve to improve replenishment<br />
operations and general basin management. Accordingly, this program is also wholly funded through<br />
the <strong>Replenishment</strong> Fund.<br />
006 – Groundwater Quality Program<br />
This comprehensive program constitutes an ongoing effort to address water quality issues that affect<br />
WRD projects and the pumpers’ facilities. The <strong>District</strong> monitors and evaluates the impacts <strong>of</strong><br />
proposed, pending and recently promulgated drinking water regulations and proposed legislation.<br />
The <strong>District</strong> assesses the justification and reasoning used to draft these proposals and, if warranted,<br />
joins in coordinated efforts with other interested agencies to resolve concerns during the early phases<br />
<strong>of</strong> the regulatory and/or legislative process.<br />
The <strong>District</strong> continually evaluates current and proposed water quality compliance in production<br />
wells, monitoring wells, and spreading/injection waters <strong>of</strong> the basins. If noncompliance is identified,<br />
WRD staff quickly investigates to determine the causes <strong>of</strong> noncompliance, develops recommended<br />
courses <strong>of</strong> action and estimates their associated costs to address the problem, and implements the<br />
best alternative to achieve compliance.<br />
Effective January 1, 2007, the <strong>District</strong> assumed responsibility for the Central Basin Title 22<br />
Groundwater Monitoring Program that had been administered previously by the Central Basin<br />
Municipal <strong>Water</strong> <strong>District</strong>. This program provides services for monitoring <strong>of</strong> drinking water wells as<br />
required by state statutes to ensure that the wells continue to be safe for domestic use. Currently,<br />
twenty pumpers with 80 wells are participating in this program. In addition, a new contract for<br />
sample collection and laboratory analysis was issued for this work. This program is paid for by the<br />
participants, and therefore, does not impact the <strong>District</strong>’s replenishment assessment.<br />
In recent years, new CECs have been identified as potentially impacting local surface water and<br />
groundwater, not only in the CBWCB but also in neighboring regions such as the Main San Gabriel<br />
Basin, Orange County Basin, Chino Basin, etc. Constituents such as perchlorate, n-nitroso<br />
dimethylamine (NDMA), hexavalent chromium, and 1,4-dioxane have emerged as CECs and may<br />
pose a potential threat to the local resources; although just their detection in the environment does<br />
not mean that they pose a public health threat at their measured concentrations. Monitoring<br />
associated with surface spreading groundwater recharge facilities may increase, specifically for<br />
CECs pending future adoption <strong>of</strong> a resolution by the State <strong>Water</strong> Resources Control Board regarding<br />
its Scientific Advisory Panel’s recommendations for monitoring CECs in recycled water.<br />
WRD’s service area contains a large and diverse industrial and commercial base. Consequently,<br />
many potential groundwater contamination sources exist within <strong>District</strong> boundaries. Examples <strong>of</strong><br />
potential contamination sources include leaking underground storage tanks, petroleum pipeline leaks<br />
at refineries and petrochemical plants, and discharges from dry cleaning facilities, auto repair shops,<br />
metal works facilities, and others. Such contamination sources may pose a threat to the drinking<br />
water aquifers. Accordingly, WRD established its Groundwater Contamination Prevention Program<br />
as a key component <strong>of</strong> the Groundwater Quality Program, in an effort to minimize or eliminate<br />
threats to groundwater supplies.<br />
WRD Engineering Survey and Report, 2012 V-4
Projects and Programs<br />
The Groundwater Contamination Prevention Program includes several ongoing efforts:<br />
<br />
<br />
<br />
Central and West Coast Basin Groundwater Contamination Forum: More than eight years<br />
ago, WRD established this data-sharing and discussion forum with key stakeholders<br />
including the U.S. Environmental Protection Agency (“USEPA”), the <strong>California</strong> Department<br />
<strong>of</strong> Toxic Substances Control (“DTSC”), the <strong>California</strong> Regional <strong>Water</strong> Quality Control<br />
Board – Los Angeles (“RWQCB-LA”), the <strong>California</strong> Department <strong>of</strong> Public Health<br />
(“CDPH”), the U.S. Geological Survey (“USGS”), and various cities and purveyors.<br />
Stakeholders drafted and signed a Memorandum <strong>of</strong> Understanding (“MOU”) agreeing to<br />
meet regularly (meetings are held 3 to 4 times per year at WRD) and share data on<br />
contaminated groundwater sites within the <strong>District</strong>. WRD has acted as the meeting<br />
coordinator and data repository/distributor, helping stakeholders to characterize the extent <strong>of</strong><br />
contamination to identify pathways for shallow contaminants in shallow aquifers to reach<br />
deeper drinking water aquifers and develop optimal methods for remediating contaminated<br />
groundwater.<br />
With the cooperation and support <strong>of</strong> all stakeholders in this Forum, WRD developed a list <strong>of</strong><br />
high-priority contaminated groundwater sites within the <strong>District</strong>. This list is a living<br />
document, subject to cleanup and “closure” <strong>of</strong> sites, as well as discovery <strong>of</strong> new sites<br />
warranting further attention. Currently, the list includes 46 sites across the CBWCB. WRD<br />
works with the lead regulatory agencies for each <strong>of</strong> these sites to keep abreast <strong>of</strong> their status,<br />
<strong>of</strong>fer data collection, review and recommendations as needed, and facilitate progress in site<br />
characterization and cleanup.<br />
Beginning in April 2010, WRD commenced work with the U.S. Geological Survey on the<br />
Central Basin Groundwater Contamination Study. The purpose <strong>of</strong> this study is to<br />
characterize the threat <strong>of</strong> multiple contaminant plumes moving downward through potential<br />
preferential pathways to deeper potable aquifers in the Central Basin. The study area<br />
encompasses a large portion <strong>of</strong> the Central Basin, including the locations <strong>of</strong> several highpriority<br />
contaminated groundwater sites. Study tasks include compilation <strong>of</strong> existing data,<br />
sequence stratigraphic analysis, water quality sampling, geochemical analyses, and<br />
characterization <strong>of</strong> the groundwater flow system. The study is expected to be completed by<br />
June 2012. WRD received AB303 grant funding to support this project.<br />
WRD remains committed to projects seeking opportunities and innovative project concepts to<br />
enhance capture and recharge <strong>of</strong> local stormwater run<strong>of</strong>f in order to augment local groundwater<br />
resources, as follows:<br />
<br />
The <strong>District</strong> has been participating in the <strong>Water</strong> Augmentation Study (“WAS”) <strong>of</strong> the Los<br />
Angeles and San Gabriel Rivers <strong>Water</strong>shed Council. This is a multi-year investigation to<br />
evaluate the feasibility <strong>of</strong> capturing more storm run<strong>of</strong>f at localized sites in lieu <strong>of</strong> discharge<br />
into the storm drains, channels, and ultimately to the ocean. It is a potential source <strong>of</strong> new<br />
replenishment water and would be in addition to stormwater currently captured and retained<br />
for percolation at the existing spreading grounds within the <strong>District</strong>. The underlying concept<br />
for the WAS is to retain more stormwater rather than allow it to be lost to the ocean;<br />
however, precautions must be taken to ensure that this new water does not degrade<br />
WRD Engineering Survey and Report, 2012 V-5
Projects and Programs<br />
groundwater quality if allowed to percolate at local sites. More stormwater could be saved<br />
by utilizing Best Management Practices (BMPs), e.g., bioswales, infiltration basins, and<br />
porous pavements. Much <strong>of</strong> the WAS is focused on evaluating the technical feasibility <strong>of</strong><br />
this project and the potential impacts on groundwater quality. Other aspects <strong>of</strong> the WAS<br />
include modeling to estimate the amount <strong>of</strong> water that can be percolated in the local<br />
watershed and the economic value <strong>of</strong> this additional source <strong>of</strong> water. In 2009, the Elmer<br />
Avenue neighborhood BMP demonstration project was constructed to evaluate the<br />
effectiveness and potential <strong>of</strong> a large-scale project. Extensive monitoring <strong>of</strong> the BMP<br />
demonstration project is planned for the coming years to assess the effectiveness <strong>of</strong> the<br />
BMPs in water capture and maintaining or improving groundwater quality.<br />
<br />
<br />
Stormwater Recharge Feasibility Study, which began mid-2011 and projected to finish in<br />
May 2012, investigates regional and distributed alternatives to capture more stormwater for<br />
groundwater recharge. To identify catchments or parcels with greatest potential to provide<br />
additional groundwater recharge and reduce pollutant loading <strong>of</strong> surface water bodies (by<br />
capturing and diverting stormwater, which otherwise would have discharged to rivers, creeks,<br />
or the ocean), an in-depth, regional assessment was conducted using spatial analysis and<br />
locally developed models, including the Structural Best management practices Prioritization<br />
and Analysis Tool (SBPAT), the Groundwater Augmentation Model (GWAM), and the<br />
WRD/U.S. Geological Survey (USGS) MODular three-dimensional finite-difference groundwater<br />
FLOW model (MODFLOW). The assessment considered a suite <strong>of</strong> factors important<br />
to siting groundwater recharge projects (e.g. surface flows, soil conditions, depth to water,<br />
and subsurface geologic conditions, preexisting contamination, and permanent dewatering<br />
activities) as well as local water quality objectives. Preliminary results have identified that<br />
approximately 10% <strong>of</strong> the 270,000 acres within the WRD service area can be considered<br />
high priority sites for local and regional stormwater recharge where expected water supply<br />
benefits range from 8,000 to 13,000 acre-feet per year. A single 100 acre catchment was<br />
selected and concept designs for a catchment-wide pilot stormwater capture and recharge<br />
effort are under development and will be completed in spring 2012. Results from the<br />
analyses and pilot project are scalable to inform future decisions about widespread<br />
implementation <strong>of</strong> distributed and regional stormwater capture projects.<br />
In 2011, as a member <strong>of</strong> the <strong>Southern</strong> <strong>California</strong> <strong>Water</strong> Committee (SCWC), the <strong>District</strong><br />
played a key role in the development <strong>of</strong> a whitepaper (released January 2012) on stormwater<br />
capture opportunities throughout the coastal plain <strong>of</strong> <strong>Southern</strong> <strong>California</strong>. The paper is the<br />
product <strong>of</strong> SCWC’s Stormwater Task Force, which was formed one year ago for the purpose<br />
<strong>of</strong> collaborating regionally (Ventura, LA, Orange, San Bernardino, Riverside and San Diego<br />
Counties representing approximately 20 million residents) on capturing more stormwater as a<br />
water supply augmentation strategy within the coastal plain <strong>of</strong> <strong>Southern</strong> <strong>California</strong>. Towards<br />
this effort, WRD collaborated with county flood control districts, water districts, other<br />
groundwater management agencies, cities, builders, public interest groups and other<br />
community leaders, who are all part <strong>of</strong> the SCWC Stormwater Task Force. This white paper<br />
examined a number <strong>of</strong> relevant topics including: (1) existing statewide policies and goals and<br />
regional plans related to integrated stormwater management; (2) trends, structure, and<br />
requirements <strong>of</strong> municipal separate storm sewer systems (MS4) permits as they pertain to<br />
both opportunities and constraints to maximizing stormwater capture for water supply<br />
WRD Engineering Survey and Report, 2012 V-6
Projects and Programs<br />
purposes; and (3) the advantages and disadvantages <strong>of</strong> two different, perhaps complementary<br />
strategies <strong>of</strong> stormwater management: onsite low impact development and regional<br />
stormwater capture and infiltration.<br />
Much <strong>of</strong> the work for the coming year will involve additional investigations at well sites known to<br />
have contaminated water, continued monitoring <strong>of</strong> water quality regulations and proposals affecting<br />
production and replenishment operations, further characterization <strong>of</strong> contaminant migration into the<br />
deeper aquifers, and monitoring and expediting cleanup activities at contaminated sites. All work<br />
under this program is related to water quality and cleanup efforts; therefore, 100% <strong>of</strong> it is funded<br />
from the Clean <strong>Water</strong> Fund.<br />
010 – Geographic Information System (GIS)<br />
The <strong>District</strong> maintains an extensive database and Geographic Information System (GIS) in-house.<br />
The database includes water level and water quality data throughout the entire WRD service area<br />
with information drawn not only from the <strong>District</strong>’s Regional Groundwater Monitoring Program and<br />
permit compliance monitoring, but also from water quality data obtained from the CDPH. The<br />
system requires continuous update and maintenance but serves as a powerful tool for understanding<br />
basin characteristics and overall basin health.<br />
The GIS is used to provide better planning and basin management. The system is used to organize<br />
and store an extensive database <strong>of</strong> spatial information, including well locations, water level data,<br />
water quality information, well construction data, production data, aquifer locations, and computer<br />
model files. Additionally, in the coming year, this information will be further integrated with readily<br />
available data from other state and federal agencies. Staff uses the system daily for project support<br />
and database management. Specific information is available to any <strong>District</strong> pumper or stakeholder<br />
upon request and can be delivered through the preparation <strong>of</strong> maps, tables, reports, or other<br />
compatible format. Additionally, the <strong>District</strong> has made its web-based Interactive Well Search tool<br />
available to selected users. This web site provides these users with limited access to WRD’s water<br />
quality and production database.<br />
<strong>District</strong> staff will continue to streamline and refine the existing data management system and website<br />
as well as satisfy both internal and external data requests. As part <strong>of</strong> the streamlining <strong>of</strong> the data,<br />
staff will work closely with other <strong>District</strong> departments to evaluate and implement updates to the<br />
<strong>District</strong>’s existing system to facilitate the seamless transfer <strong>of</strong> data and access to that data.<br />
Additionally, <strong>District</strong> staff will continue the development <strong>of</strong> applications to more efficiently manage<br />
and report groundwater production information. Continued use, upkeep, and maintenance <strong>of</strong> the GIS<br />
are planned for the coming year. The use <strong>of</strong> the system supports both replenishment activities and<br />
groundwater quality efforts. Accordingly, the cost for this program is equally split between the<br />
<strong>Replenishment</strong> and Clean <strong>Water</strong> Funds.<br />
011 – Regional Groundwater Monitoring Program<br />
WRD has been monitoring groundwater quality and water levels in the CBWCB for over 50 years.<br />
The Regional Groundwater Monitoring Program provides for the collection <strong>of</strong> basic information<br />
WRD Engineering Survey and Report, 2012 V-7
Projects and Programs<br />
used for groundwater basin management including groundwater level data and water quality data. It<br />
currently consists <strong>of</strong> a network <strong>of</strong> nearly 300 WRD and USGS-installed monitoring wells at over 50<br />
locations throughout the <strong>District</strong>, supplemented by the existing groundwater production wells<br />
operated by the water purveyors. The information generated by this program is stored in the<br />
<strong>District</strong>’s GIS and provides the basis to better understand the dynamic changes in the Central Basin<br />
and West Coast Basin. WRD technical staff, comprised <strong>of</strong> hydrogeologists and engineers, provides<br />
the in-house capability to collect, analyze and report groundwater data.<br />
<strong>Water</strong> quality samples from the monitoring wells are collected twice a year. <strong>Water</strong> levels are<br />
measured in most monitoring wells with automatic data loggers daily, while water levels in all<br />
monitoring wells are measured by WRD field staff a minimum <strong>of</strong> four times per year. On an annual<br />
basis, staff prepares a report (the Regional Groundwater Monitoring Report) that documents<br />
groundwater level and groundwater quality conditions throughout the <strong>District</strong>. This report is<br />
distributed to the groundwater pumpers in WRD and is also posted on our website. In 2011, the<br />
National Groundwater Associated presented WRD with the “2011 Groundwater Protection Project<br />
Award” in recognition <strong>of</strong> our regional groundwater monitoring program.<br />
Most <strong>of</strong> the work during the coming year will involve continuous field activities including quarterly<br />
and semi-annual data collection, well and equipment maintenance, and annual reporting activities. In<br />
addition, new nested monitoring wells will be constructed. Work associated with the Regional<br />
Groundwater Monitoring Program also supports activities relating to both replenishment and water<br />
quality projects. The program, therefore, is funded 50% each from the <strong>Replenishment</strong> and Clean<br />
<strong>Water</strong> Funds.<br />
012 – Safe Drinking <strong>Water</strong> Program<br />
WRD’s Safe Drinking <strong>Water</strong> Program (“SDWP”) has operated since 1991 and is intended to<br />
promote the cleanup <strong>of</strong> groundwater resources at specific well locations. Through the installation <strong>of</strong><br />
wellhead treatment facilities at existing production wells, the <strong>District</strong> hopes to remove contaminants<br />
from the underground supply and deliver the extracted water for potable purposes. Projects<br />
implemented through this program are accomplished through direct input and coordination with well<br />
owners. One treatment facilities was constructed in 2011 in Maywood for the removal <strong>of</strong> iron and<br />
manganese. The removal mechanism is a pressurized filtration system.<br />
The current program focuses on the removal <strong>of</strong> VOCs and <strong>of</strong>fers financial assistance for the design<br />
and equipment <strong>of</strong> the selected treatment facility. Another component <strong>of</strong> the program <strong>of</strong>fers nointerest<br />
loans for secondary constituents <strong>of</strong> concern that affect a specific production well. The<br />
capital costs <strong>of</strong> wellhead treatment facilities range from $800,000 to over $2,000,000. Due to<br />
financial constraints, this initial cost is generally prohibitive to most pumpers. Financial assistance<br />
through the <strong>District</strong>’s SDWP makes project implementation much more feasible.<br />
There are several current projects in various stages <strong>of</strong> completion and new candidates for<br />
participation are on the rise. A total <strong>of</strong> sixteen (16) facilities are already completed and online and<br />
one facility has successfully completed removal <strong>of</strong> the contamination and no longer needs<br />
treatment. While continued funding <strong>of</strong> this program is anticipated for next year, the <strong>District</strong> has<br />
revised the guidelines <strong>of</strong> the SDWP to place a greater priority on projects involving VOC<br />
WRD Engineering Survey and Report, 2012 V-8
Projects and Programs<br />
contamination or other anthropogenic (man-made) constituents, now classified as Priority A<br />
Projects. Further, any treatment projects for naturally-occurring constituents would be classified as<br />
Priority B Projects and funded on a secondary priority, on a case-by-case basis, and only if program<br />
monies are still available during the fiscal year. While such projects are <strong>of</strong> interest to WRD,<br />
availability <strong>of</strong> funding for them will not be determined until after the budget process.<br />
Projects under the SDWP involve the treatment <strong>of</strong> contaminated groundwater for subsequent<br />
beneficial use. This water quality improvement assists in meeting the <strong>District</strong>’s groundwater<br />
cleanup objectives. Thus, funding for the costs <strong>of</strong> the program is drawn wholly from the Clean<br />
<strong>Water</strong> Fund.<br />
018 – Dominguez Gap Barrier Recycled <strong>Water</strong> Injection<br />
This Project involves the delivery <strong>of</strong> recycled water from the City <strong>of</strong> Los Angeles Department <strong>of</strong><br />
<strong>Water</strong> and Power’s (“LADWP”) Terminal Island Treatment Plant (“TITP”) Advanced <strong>Water</strong><br />
Treatment Facility (“AWTF”) to the Dominguez Gap Barrier (“DGB”). Deliveries <strong>of</strong> recycled water<br />
to the barrier commenced in late February 2006 and have continued to November 2011 when the<br />
plant was shut down for upgraded and maintenance.<br />
The influent water is being treated with micr<strong>of</strong>iltration, reverse osmosis, and chlorination before<br />
being injected into the DGB. The project is permitted to maintain an overall ratio <strong>of</strong> 50% recycled<br />
water and 50% potable water up to a maximum <strong>of</strong> 5 mgd to satisfy regulatory requirements.<br />
Additional water quality requirements, including turbidity and modified fouling index (“MFI”), must<br />
also be met to minimize potential fouling <strong>of</strong> injection wells in the DGB, which is owned and<br />
operated by the County <strong>of</strong> Los Angeles Department <strong>of</strong> Public Works.<br />
While LADWP is responsible for the treatment and delivery <strong>of</strong> the recycled water and all the water<br />
quality sampling associated with those activities, WRD has responsibility over groundwater<br />
monitoring compliance. As part <strong>of</strong> the permit, groundwater monitoring is required to measure and<br />
track water quality conditions and to anticipate potential problems before recycled water arrives at<br />
downgradient drinking water wells. In addition, a tracer study was conducted at the start <strong>of</strong> recycled<br />
water injection (February 2006) through fall 2010 to determine the extent <strong>of</strong> travel and movement <strong>of</strong><br />
the recycled water blend. The tracer study confirmed that adequate mixing and further blending in<br />
the ground is occurring and that groundwater samples being collected are representative <strong>of</strong> the<br />
recycled water blend.<br />
Recycled water use at the seawater intrusion barriers in Los Angeles County improves the reliability<br />
<strong>of</strong> a supply that is needed on a continuous basis. Traditionally, water purchases for the barriers have<br />
been viewed as a replenishment function. Therefore, this program is funded 100% through the<br />
<strong>Replenishment</strong> Fund.<br />
023 – <strong>Replenishment</strong> Operations<br />
WRD actively monitors the operation and maintenance practices at the LACDPW-owned and<br />
operated spreading grounds and seawater barriers within the <strong>District</strong>. Optimizing replenishment<br />
opportunities is fundamentally important to WRD, in part because imported and recycled water<br />
WRD Engineering Survey and Report, 2012 V-9
Projects and Programs<br />
deliveries directly affect the <strong>District</strong>’s annual budget. Consequently, the <strong>District</strong> seeks to ensure that<br />
the conservation <strong>of</strong> stormwater is maximized, and that imported and recycled water replenishment is<br />
optimized.<br />
Due to the reduction and unreliability <strong>of</strong> imported water for replenishment, WRD is working on its<br />
<strong>Water</strong> Independence Now (“WIN”) program to eventually become independent from imported water<br />
for groundwater recharge. Currently, the <strong>District</strong> needs about 37,240 AF <strong>of</strong> imported water for<br />
recharge; 21,000 AF for spreading and 16,240 AF for injection at the seawater barriers. By<br />
maximizing the use <strong>of</strong> recycled water and stormwater, the amount <strong>of</strong> imported water can eventually<br />
be reduced or eliminated, thereby providing the groundwater basins with full replenishment needs<br />
through locally-derived water.<br />
WRD coordinates regular meetings with LACDPW, MWD, SDLAC, and other water interests to<br />
discuss replenishment water availability, spreading grounds operations, barrier operations,<br />
scheduling <strong>of</strong> replenishment deliveries, seawater barrier improvements, upcoming maintenance<br />
activities, and facility outages or shutdowns. The <strong>District</strong> tracks groundwater levels in the<br />
Montebello Forebay weekly to assess general basin conditions and determine the level <strong>of</strong> artificial<br />
replenishment needed. WRD also monitors the amount <strong>of</strong> recycled water used at the spreading<br />
grounds and seawater barriers to maximize use while complying with pertinent regulatory limits.<br />
In 2011 the <strong>District</strong> and LACDPW completed construction <strong>of</strong> the Interconnection Pipeline. This<br />
jointly-funded project is a new, dedicated pipeline and pumping station constructed between the Rio<br />
Hondo and San Gabriel Coastal Spreading Grounds to transfer replenishment water in either<br />
direction via gravity flow or pumping. The project is expected to conserve approximately 1,300<br />
AFY <strong>of</strong> additional stormwater on average, help maximize the amount <strong>of</strong> recycled water conserved<br />
by approximately 5,700 AFY, and provide operational flexibility to mitigate obstacles to performing<br />
replenishment at these spreading grounds. The Interconnection Pipeline project is a key component<br />
<strong>of</strong> the <strong>District</strong>’s WIN.<br />
While improvements undertaken in recent years by LACDPW/WRD (e.g., expansion <strong>of</strong> Whittier<br />
Narrows Conservation Pool, installation <strong>of</strong> rubber dams on San Gabriel River, Interconnection<br />
Pipeline) have considerably increased the stormwater portion <strong>of</strong> WRD’s supply portfolio, the<br />
potential for further increasing the use <strong>of</strong> stormwater for groundwater augmentation remains<br />
significant. Results <strong>of</strong> the <strong>Water</strong> Augmentation Study (described under Project 006 above) suggest<br />
that nearly 180,000 AFY <strong>of</strong> stormwater run<strong>of</strong>f is lost to the ocean from WRD’s service area.<br />
Accordingly, the <strong>District</strong> plans to work with the LASGRWC on the Stormwater Recharge Feasibility<br />
Study and Pilot Project Development effort. This effort will identify regional and parcel-based<br />
locations and pilot project concepts and their respective costs and benefits within the <strong>District</strong> to<br />
achieve maximum stormwater capture for water supply benefit. Existing but independent analyses,<br />
datasets and modeling tools will be combined to identify where potential pilot projects may be<br />
located and to provide concept designs within a focused area. The study will identify with great<br />
specificity the best locations for stormwater capture and filtration and the technologies best suited to<br />
the locations.<br />
The <strong>District</strong> plans to continue working with the LACDPW on several design projects for the Rio<br />
Hondo and San Gabriel Coastal Spreading Grounds with the goal <strong>of</strong> increasing the volume <strong>of</strong><br />
WRD Engineering Survey and Report, 2012 V-10
Projects and Programs<br />
recycled water conserved. The <strong>District</strong> is continually looking for opportunities to work with the<br />
LACDPW on improvement projects at the recharge facilities. Several potential projects have been<br />
identified and are being further evaluated to determine if they should be pursued. In addition, the<br />
<strong>District</strong> will be partnering with LACDPW to construct additional monitoring wells near the Alamitos<br />
Seawater Barrier to investigate the quality <strong>of</strong> groundwater and potential for saltwater intrusion.<br />
As its name implies, the <strong>Replenishment</strong> Operations Program deals primarily with replenishment<br />
issues and therefore its costs are borne completely through the <strong>Replenishment</strong> Fund.<br />
025 – Hydrogeology Program<br />
This program accounts for the projects and programs related to hydrogeologic investigations <strong>of</strong> the<br />
<strong>District</strong> and surrounding areas to ensure safe and reliable groundwater. Work performed under this<br />
program includes the preparation <strong>of</strong> the annual Engineering Survey and Report, which incorporates<br />
the calculation and determination <strong>of</strong> annual overdraft, accumulated overdraft, changes in storage,<br />
pumping amounts, and replenishment water availability into a document to help the <strong>District</strong> assess<br />
its replenishment needs and costs in the ensuing year. Extensive amounts <strong>of</strong> data are compiled and<br />
analyzed by Staff to determine these values. Maps are created showing water levels in the basins<br />
and production patterns and amounts. The updates, maintenance, and use <strong>of</strong> the Regional<br />
Groundwater Flow Model developed by the USGS and WRD are part <strong>of</strong> this program. This model is<br />
a significant analytical tool utilized by WRD to determine basin benefits and impacts <strong>of</strong> changes<br />
proposed in the management <strong>of</strong> the Central and West Coast Basins.<br />
An ongoing effort at the <strong>District</strong> to better characterize the hydrogeologic conditions across the<br />
Central and West Coast Basins is called the "Hydrogeologic Conceptual Model". This long-term<br />
project involves compiling and interpreting the extensive amounts <strong>of</strong> data generated during drilling<br />
and logging <strong>of</strong> the WRD/USGS monitoring wells, and collected from historical information for<br />
production wells and oil wells within the <strong>District</strong>. The ultimate goal <strong>of</strong> this project is to incorporate<br />
these data in WRD's database/GIS and apply the system to generate aquifer surfaces and crosssections<br />
for comparison with historical interpretations <strong>of</strong> basin hydrogeology. The final conceptual<br />
model will significantly improve the understanding <strong>of</strong> the aquifer depths, extents, and thicknesses<br />
throughout the <strong>District</strong>, and will assist Staff, pumpers and stakeholders with planning for<br />
groundwater resource projects such as new well drilling, storage opportunities, or modeling. The<br />
data will also be made available on WRD's website to be used as a reference source for<br />
hydrogeologic interpretations and fulfilling project-related data requests.<br />
Hydrogeologic analysis is also needed for projects associated with groundwater quality concerns and<br />
specific cleanup projects. Staff work may include investigative surveys, data research, and oversight<br />
<strong>of</strong> specific project studies. Such efforts are used to relate water quality concerns with potential<br />
impact to basin resources. An example <strong>of</strong> this type <strong>of</strong> Staff work is the <strong>District</strong>’s Well Pr<strong>of</strong>iling<br />
Program. The <strong>District</strong> assists pumpers in evaluating drinking water supply well contamination.<br />
Services may include existing data collection and review, and field tasks such as spinner logging and<br />
depth-discrete sampling. WRD’s evaluation helps pumpers to determine the best course <strong>of</strong> action;<br />
e.g., sealing <strong>of</strong>f a particular screened interval <strong>of</strong> a well, wellhead treatment, or well destruction.<br />
WRD Engineering Survey and Report, 2012 V-11
Projects and Programs<br />
Salt / Nutrient Management Plans are a new State requirement for all groundwater basins throughout<br />
<strong>California</strong>. The Plans are required as part <strong>of</strong> the Recycled <strong>Water</strong> Policy issued by the State <strong>Water</strong><br />
Resources Control Board (SWRCB) and effective as <strong>of</strong> May 14, 2009. As stated in the Policy, its<br />
purpose is to “establish uniform requirements for recycled water use and to develop sustainable<br />
water supplies throughout the state”. The SWRCB therefore “supports and encourages every<br />
region…to develop a Salt / Nutrient Management Plan by 2014”. With one exception (elevated TDS<br />
concentrations near the coast due to historic seawater intrusion, now controlled through freshwater<br />
barrier injection), salts and nutrients have not been shown to be a concern in the CBWCB. However,<br />
since Salt / Nutrient Management Plans are required, WRD has initiated the process with other<br />
stakeholders and the Regional <strong>Water</strong> Quality Control Board and has completed a work plan and will<br />
make considerable progress on the S/Nutrient Management Plan in the ensuing year.<br />
For the ensuing year, it is expected that the program will include other projects such as the Technical<br />
Bulletins, investigative research into the saline plume, continued modeling <strong>of</strong> the Alamitos and<br />
Dominguez seawater barriers, and significant updates to the USGS computer model.<br />
The Hydrogeology Program addresses both groundwater replenishment objectives and groundwater<br />
quality matters. This dual service warrants that the cost <strong>of</strong> the program be split evenly between the<br />
<strong>Replenishment</strong> and Clean <strong>Water</strong> Funds.<br />
033 – Groundwater Reliability Improvement Program (“GRIP”)<br />
The WRD continues to pursue projects through its <strong>Water</strong> Independence Now (WIN) program that<br />
develop local and sustainable sources <strong>of</strong> water for use in groundwater replenishment activities. This<br />
has become increasingly important in light <strong>of</strong> the environmental and political issues limiting delivery<br />
<strong>of</strong> imported water to Los Angeles area together with the potential for a drought to hit <strong>California</strong>.<br />
To address these issues, WRD is seeking alternative sources <strong>of</strong> water to <strong>of</strong>fset the imported water<br />
used for replenishment in the Montebello Forebay. This program is referred to as the Groundwater<br />
Reliability Improvement Program (GRIP). The effort <strong>of</strong> this program is to evaluate all feasible<br />
alternatives for replacing or <strong>of</strong>fsetting the current quantity <strong>of</strong> imported water used for<br />
replenishment. One alternative being considered is the use <strong>of</strong> advanced treated recycled municipal<br />
wastewater (micr<strong>of</strong>iltration, reverse osmosis, ultra-violet light with hydrogen peroxide) from the<br />
Sanitation <strong>District</strong>s <strong>of</strong> Los Angeles County’s (SDLAC) San Jose Creek <strong>Water</strong> Reclamation Plant.<br />
To determine the viability <strong>of</strong> this concept, a consultant was retained to perform a conceptual design<br />
<strong>of</strong> a facility for the purpose <strong>of</strong> developing preliminary cost estimates. The concept will be to deliver<br />
advanced treated water to the San Gabriel River spreading basins or a dedicated injection well field<br />
to meet a portion <strong>of</strong> WRD’s replenishment requirements.<br />
Upon finding the concept feasible, a second consultant was retained to perform an Alternatives<br />
Analysis to evaluate various options, in addition to the proposed treatment facility, for developing<br />
the additional replenishment water supply. This effort was completed in mid 2011. WRD has since<br />
entered into a partnership with SDLAC to further develop the concept <strong>of</strong> an advanced water<br />
treatment facility. The next steps will include the performance <strong>of</strong> and environmental impact<br />
report/study (EIR/EIS) followed by regulatory permitting. Any new source <strong>of</strong> replenishment water<br />
WRD Engineering Survey and Report, 2012 V-12
Projects and Programs<br />
developed through the GRIP will help to improve the reliability and utilization <strong>of</strong> an available local<br />
resource.<br />
This resource is used to improve replenishment capabilities and is thus funded 100% from the<br />
<strong>Replenishment</strong> Fund.<br />
035 - West Coast Seawater Barrier Monitoring Well Sampling Project<br />
In a cooperative agreement with West Basin Municipal <strong>Water</strong> <strong>District</strong> (WBMWD), WRD has been<br />
contracted to sample eight West Coast Barrier monitoring wells to help satisfy WBMWD’s permit<br />
compliance criteria for recycled water injection into the West Coast Barrier. WRD’s<br />
hydrogeologists sample the eight wells quarterly and submit the samples to WBMWD’s laboratory<br />
for analysis. Sampling <strong>of</strong> the eight monitoring wells is required by WBMWD’s Regional <strong>Water</strong><br />
Quality Control Board permit, which enforces the monitoring and testing <strong>of</strong> the recycled water that<br />
is injected into the West Coast Basin Barrier to prevent seawater intrusion. WBMWD is responsible<br />
for all the fees and expenses generated by each quarterly sampling, which therefore has no impact on<br />
WRD’s replenishment assessment.<br />
WRD Engineering Survey and Report, 2012 V-13
TABLES
Table 1<br />
GROUNDWATER CONDITIONS AND REPLENISHMENT SUMMARY<br />
WATER YEAR<br />
Oct 1 - Sep 30<br />
2010-2011 2011-2012 (a) 2012-2013 (a)<br />
Total Groundwater Production 215,196 AF 243,500 AF 244,500 AF<br />
Annual Overdraft 16,100 AF (111,300) AF (99,300) AF<br />
Accumulated Overdraft (616,300) AF (650,600) AF<br />
Spreading<br />
Quantity Required for Artificial <strong>Replenishment</strong> for the Ensuing Year<br />
Imported for Spreading in Montebello Forebay<br />
2,180 AF<br />
Recycled for Spreading in Montebello Forebay 50,000<br />
Subtotal Spreading 52,180<br />
Injection<br />
Alamitos Seawater Barrier Imported <strong>Water</strong> (WRD side only) 2,540<br />
Alamitos Seawater Barrier Recycled <strong>Water</strong> (WRD side only) 1,800<br />
Dominguez Gap Seawater Barrier Imported <strong>Water</strong> 8,000<br />
Dominguez Barrier Seawater Barrer Recycled <strong>Water</strong> -<br />
West Coast Seawater Barrier Imported <strong>Water</strong> 4,500<br />
West Coast Seawater Barrier Recycled <strong>Water</strong> 13,500<br />
Subtotal Injection 30,340<br />
In-lieu (b) Subtotal In-lieu -<br />
Total<br />
Source and Unit Cost <strong>of</strong> <strong>Replenishment</strong> <strong>Water</strong> for the Ensuing Year<br />
82,520 AF<br />
Spreading Oct-Dec Jan-Sep<br />
MWD Commodity Rate for Tier 1 Untreated Imported $ 560 /AF $ 593 /AF<br />
CBMWD Administrative Surcharge (a) $ 90 /AF $ 90 /AF<br />
(a)<br />
CBMWD Readiness to Serve (RTS) charge *<br />
$ 31 /AF $ 31 /AF<br />
Cost to WRD (sum <strong>of</strong> above) (a) $ 681 /AF $ 714 /AF<br />
plus CBMWD <strong>Water</strong> Service Charge (a) $ 69 /cfs/mo $ 69 /cfs/mo<br />
SDLAC recycled water from San Jose Creek $ 34.40 /AF $ 40.00 /AF<br />
SDLAC recylced water from Whittier Narrows WRP $ 7 /AF $ 7 /AF<br />
SDLAC makeup for undercharges in 2007-2009 $ 19,074.86 /mo $ 19,074.86 /mo<br />
Injection<br />
Alamitos Barrier<br />
MWD Commodity Rate for Tier 1 Treated Imported $ 794 /AF $ 847 /AF<br />
Long Beach RTS $ 90 /AF $ 90 /AF<br />
Long Beach Administrative Surcharge $ 5 /AF $ 5 /AF<br />
Cost to WRD (sum <strong>of</strong> above) $ 889 /AF $ 942 /AF<br />
plus Long Beach Capacity Charge * $ 600 /cfs/mo $ 600 /cfs/mo<br />
Recycled water from WRD Vander Lans plant $ 546 /AF $ 546 /AF<br />
Dominguez Gap and West Coast Barriers<br />
MWD Commodity Rate for Tier 1 Treated Imported $ 794 /AF $ 847 /AF<br />
WBMWD Administrative Surcharge $ 107 /AF $ 107 /AF<br />
WBMWD RTS * $ 135 /AF $ 135 /AF<br />
Cost to WRD (sum <strong>of</strong> above) $ 1,036 /AF $ 1,089 /AF<br />
plus WBMWD <strong>Water</strong> Service Charge $ 42 /cfs/mo $ 42 /cfs/mo<br />
plus WBMWD Capacity Charge * $ 542 /cfs/mo $ 458 /cfs/mo<br />
Recycled water from LADWP (Dominguez Gap) $ 431 /AF $ 431 /AF<br />
Recycled water from WBMWD (West Coast) $ 705 /AF $ 705 /AF<br />
In-lieu (b) MWD Member Agency no In-Lieu Program<br />
WBMWD Customer no In-Lieu Program<br />
(a) Estimated values<br />
(b) Amounts and rates for In-lieu are estimated. Not yet been established by the Board for ensuing year<br />
* Amount is a direct pass through to MWD
Imported <strong>Water</strong> Summary - All <strong>Water</strong><br />
Recycled <strong>Water</strong><br />
Table 2<br />
QUANTITY AND COST OF REPLENISHMENT WATER FOR THE ENSUING WATER YEAR<br />
Item Quantity (AF) Total Cost<br />
Spreading - Tier 1 Untreated Imported<br />
Spreading - Recycled<br />
Alamitos Barrier - Imported<br />
Alamitos Barrier - Recycled*<br />
Dominguez Barrier - Imported<br />
Dominguez Barrier - Recycled<br />
West Coast Barrier - Imported<br />
West Coast Barrier - Recycled<br />
In-Lieu MWD Member<br />
In-Lieu WBMWD Customer<br />
TOTAL<br />
82,520<br />
Detailed Breakout <strong>of</strong> <strong>Water</strong> Costs and Surcharges to WRD<br />
2,180 $<br />
1,911,135<br />
50,000<br />
$<br />
1,842,898<br />
2,540<br />
$<br />
2,389,265<br />
1,800<br />
$<br />
-<br />
8,000<br />
$<br />
8,756,276<br />
0<br />
$<br />
-<br />
4,500<br />
$<br />
4,951,551<br />
13,500<br />
$<br />
9,517,500<br />
0<br />
0<br />
$<br />
$<br />
-<br />
-<br />
Item Quantity Oct-Dec Jan-Sep Melded Total<br />
CBMWD<br />
MWD Untreated Tier 1 - Spreading ($/af) 2,180 $ 560 $ 593 $ 585 $ 1,274,755<br />
MWD RTS ($/af) 2,180 $ 31 $ 31 $ 31 $ 67,580<br />
CBMWD Administrative Surcharge ($/af) 2,180 $ 90 $ 90 $ 90 $ 196,200<br />
CBMWD <strong>Water</strong> Service Charge ($/cfs/month) 450 $ 69 $ 69 $ 69 $ 372,600<br />
Total to CBMWD $ 1,911,135<br />
LBWD<br />
MWD Treated Tier 1 - Alamitos Barrier ($/af) 2,540 $ 794 $ 847 $ 834 $ 2,117,725<br />
MWD Capacity Charge ($/cfs/month) 4.20 $ 600 $ 600 $ 600 $ 30,240<br />
LBWD RTS ($/af) 2,540 $ 90 $ 90 $ 90 $ 228,600<br />
LBWD Administrative Surcharge ($/af) 2,540 $ 5 $ 5 $ 5 $ 12,700<br />
Total to LBWD $ 2,389,265<br />
WBMWD<br />
MWD Tier 1 - Barriers (DG,WCB) ($/af) 12,500 $ 794 $ 847 $ 834 $ 10,421,875<br />
MWD RTS ($/af) 12,500 $ 135 $ 135 $ 135 $ 1,687,500<br />
MWD Capacity Charge ($/cfs/month) 34 $ 542 $ 458 $ 479 $ 195,432<br />
WBMWD Administrative Surcharge ($/af) 12,500 $ 107 $ 107 $ 107 $ 1,337,500<br />
WBMWD <strong>Water</strong> Service Charge ($/cfs/month) 130 $ 42 $ 42 $ 42 $ 65,520<br />
Total to West Basin MWD $ 13,707,827<br />
IN-LIEU<br />
MWD Member Agency ($/af) 0 - - - No IL Program<br />
WBMWD Member Agency ($/af) 0 - - - No IL Program<br />
Total for In-Lieu Payments $<br />
-<br />
LADWP<br />
LADWP Recycled <strong>Water</strong> ($/af) 0 - - - Budget Imported<br />
Total to LADWP $<br />
-<br />
SDLAC<br />
SDLAC - San Jose Creek WRP ($/af) 40,000 $ 34 $ 40 $ 38.60 $ 1,544,000<br />
SDLAC - Whittier Narrows WRP ($/af) 10,000 $ 7 $ 7 $ 7 $ 70,000<br />
SDLAC - Makeup Payment ($) $ 228,898<br />
Total to SDLAC $ 1,842,898<br />
WBMWD<br />
WBMWD Recycled <strong>Water</strong> ($/af) 13,500 $ 705 $ 705 $ 705 $ 9,517,500<br />
Total to WBMWD $ 9,517,500<br />
WRD<br />
WRD Recycled <strong>Water</strong> Vander Lans ($/af) 1,800 $ 546 $ 546 $ 546 $ 982,800<br />
WRD Recycled <strong>Water</strong> Vander Lans ($/af)* (1,800) $ 546 $ 546 $ 546 $ (982,800)<br />
Total to WRD $<br />
-<br />
TOTAL $ 29,368,625<br />
* Cost is based on O&M less MWD rebate. Shown as a water cost but deducted out since it's part <strong>of</strong> the Vander Lans project<br />
$<br />
29,368,625
Table 3<br />
WRD PROJECTS AND PROGRAMS<br />
PROJECT / PROGRAM<br />
DISTRICT FUNCTION<br />
<strong>Replenishment</strong><br />
Clean <strong>Water</strong><br />
001 Leo J. Vander Lans <strong>Water</strong> Treatment Facility Project 100%<br />
002 Robert W. Goldsworthy Desalter Project 100%<br />
004 Recycled <strong>Water</strong> Program 100%<br />
005 Groundwater Resources Planning Program 100%<br />
006 Groundwater Quality Program 100%<br />
010 Geographic Information System 50% 50%<br />
011 Regional Groundwater Monitoring Program 50% 50%<br />
012 Safe Drinking <strong>Water</strong> Program 100%<br />
018 Dominguez Gap Barrier Recycled <strong>Water</strong> Injection 100%<br />
023 <strong>Replenishment</strong> Operations (Spreading & Barriers) 100%<br />
025 Hydrogeology Program 50% 50%<br />
033 Groundwater Resources Improvement Program (GRIP) 100% 0%<br />
035 West Coast Seawater Barrier Monitoring Well Sampling 50% 50%
Table 4<br />
30-YEAR AVERAGE GROUNDWATER BALANCE<br />
FROM USGS AND WRD REGIONAL MODEL<br />
INFLOWS Average AFY OUTFLOWS Average AFY<br />
Natural Inflows:<br />
Artificial Outflows:<br />
Local water conserved at spreading grounds (1) 48,825 Pumping 250,590<br />
Interior and mountain front recharge 47,900<br />
Net underflow from adjacent basins (2) 48,480<br />
Subtotal Natural Inflows: 145,205<br />
Artificial Inflows:<br />
Imported and recycled spreading (3) 74,075<br />
Barrier injection water (4) 34,600<br />
Subtotal Artificial Inflows: 108,675<br />
Total Inflows: 253,880 Total Outflows: 250,590<br />
Average Annual Groundwater Deficiency (afy) = Natural Inflows - Total Outflows = (105,385)<br />
(1) includes stormwater and base flow water captured and recharged at the spreading grounds<br />
(2) does not include average <strong>of</strong> 7,100 afy <strong>of</strong> seawater intrusion, which can not be considered as replenishment per the water code<br />
(3)<br />
includes all imported purchased, all recycled purchased, and Pomona Plant (free) recycled water.<br />
(4)<br />
includes all injected water at the three barrier systems, including all <strong>of</strong> Alamitos Barrier. Model value may differ slightly from actual purchases.<br />
Description <strong>of</strong> the model can be found in USGS, 2003, Geohydrology, Geochemistry, and Ground-<strong>Water</strong> Simulation - Optimization<br />
<strong>of</strong> the Central and West Coast Basins, Los Angeles County, <strong>California</strong>; <strong>Water</strong> Resources Investigation Report 03-4065<br />
by Reichard, E.G., Land, M., Crawford, S.M., Johnson, T., Everett, R.R., Kulshan, T.V., Ponti, D.J., Halford, K.J., Johnson, T.A.,<br />
Paybins, K.S., and Nishikawa, T.
<strong>Water</strong><br />
Year<br />
Inches<br />
Table 5<br />
HISTORICAL RAINFALL<br />
Station #107D, Downey Fire Department<br />
<strong>Water</strong><br />
Year<br />
Inches<br />
<strong>Water</strong><br />
Year<br />
Inches<br />
<strong>Water</strong><br />
Year<br />
Inches<br />
1925-26 12.63 1950-51 8.27 1975-76 9.55 2000-01 14.98<br />
1926-27 16.92 1951-52 24.68 1976-77 11.23 2001-02 2.52<br />
1927-28 11.97 1952-53 10.53 1977-78 33.85 2002-03 19.89<br />
1928-29 11.52 1953-54 12.33 1978-79 18.68 2003-04 7.73<br />
1929-30 10.84 1954-55 11.84 1979-80 28.29 2004-05 23.43<br />
1930-31 10.45 1955-56 13.97 1980-81 8.74 2005-06 11.36<br />
1931-32 14.52 1956-57 9.89 1981-82 13.41 2006-07 1.95<br />
1932-33 10.02 1957-58 24.65 1982-83 30.3 2007-08 17.11<br />
1933-34 11.1 1958-59 6.68 1983-84 11.96 2008-09 9.49<br />
1934-35 21.94 1959-60 9.84 1984-85 12.44 2009-10 13.02<br />
1935-36 9.65 1960-61 4.3 1985-86 19.47 2010-11 17.73<br />
1936-37 22.11 1961-62 18.46 1986-87 6.49<br />
1937-38 21.75 1962-63 10.9 1987-88 11.47<br />
1938-39 18.69 1963-64 6.86 1988-89 7.82<br />
1939-40 12.81 1964-65 13.27 1989-90 7.87<br />
1940-41 34.21 1965-66 17.02 1990-91 12.22<br />
1941-42 14.66 1966-67 17.78 1991-92 16.07<br />
1942-43 17.91 1967-68 11.46 1992-93 26.55<br />
1943-4444 17.89 1968-6969 22.33 1993-9494 926 9.26<br />
1944-45 11.25 1969-70 7.52 1994-95 26.82<br />
1945-46 10.31 1970-71 11.45 1995-96 10.68<br />
1946-47 15.24 1971-72 6.4 1996-97 13.95<br />
1947-48 8.62 1972-73 18.57 1997-98 32.47<br />
1948-49 9.04 1973-74 14.51 1998-99 7.29<br />
1949-50 10.14 1974-75 15.01 1999-00 9.21<br />
Period <strong>of</strong> Record<br />
Running 86 Year Average<br />
86 years<br />
14.30 inches<br />
Minimum 1.95 inches<br />
Maximum 34.21 inches
Table 6<br />
ANNUAL OVERDRAFT CALCULATION<br />
for Current and Ensuing <strong>Water</strong> Years (in acre-feet)*<br />
Item<br />
WATER YEAR<br />
2011-2012 2012-2013<br />
Average Annual Groundwater Deficiency (from Table 4)<br />
(105,385) (105,385)<br />
Adjustments/Variances to AAGD<br />
(1) Local <strong>Water</strong> at Spreading Grounds (a) (10,000) (d) 0 (d)<br />
(2) Precipitation, mountain front recharge, applied water (a) (3,000) (d) 0 (d)<br />
(3) Subsurface inflow (b) 0 (d) 0 (d)<br />
(4) Groundwater Extractions (c) (7,100) (d) (6,100) (d)<br />
ANNUAL OVERDRAFT [AAGD+(1)+(2)+(3)-(4)]<br />
(111,300) (99,300)<br />
* Previous Year Annual Overdraft is derived in Chapter III<br />
(a) Difference between actual and model average. Positive value indicates increased recharge.<br />
(b) Difference between annual model value and average model value. Positive value indicates increased inflow.<br />
Does not include seawater intrusion inflow<br />
(c) Difference between actual and model average. Positive value indicates increased pumpage.<br />
(d) Estimated Values. A value <strong>of</strong> zero indicates average year was assumed.
Table 7<br />
ACCUMULATED OVERDRAFT CALCULATION (in acre-feet)<br />
ITEM<br />
AMOUNT<br />
Accumulated Overdraft at End <strong>of</strong> Previous <strong>Water</strong> Year (616,300)<br />
Estimated Annual Overdraft for Current Year (111,300)<br />
Subtotal without artificial replenishment (727,600)<br />
Planned Artificial <strong>Replenishment</strong> for Current Year<br />
Imported <strong>Water</strong> Purchased for Spreading -<br />
Recycled <strong>Water</strong> Purchased for Spreading 50,000<br />
Imported and Recycled <strong>Water</strong> Purchased for Barrier Wells 27,000<br />
<strong>Replenishment</strong> Subtotal 77,000<br />
PROJECTED ACCUMULATED OVERDRAFT FOR<br />
CURRENT YEAR<br />
(650,600)
Table 8<br />
CHANGES IN GROUNDWATER STORAGE<br />
WATER<br />
YEAR<br />
ANNUAL<br />
CHANGE<br />
IN<br />
STORAGE<br />
(AF)<br />
CUMULATIVE<br />
CHANGE<br />
IN STORAGE<br />
(AF)<br />
WATER<br />
YEAR<br />
ANNUAL<br />
CHANGE<br />
IN<br />
STORAGE<br />
(AF)<br />
CUMULATIVE<br />
CHANGE<br />
IN STORAGE<br />
(AF)<br />
WATER<br />
YEAR<br />
ANNUAL<br />
CHANGE<br />
IN<br />
STORAGE<br />
(AF)<br />
CUMULATIVE<br />
CHANGE<br />
IN STORAGE<br />
(AF)<br />
1961-62 88,500 88,500 1985-86 10,600 238,200 2009-10 27,000 141,500<br />
1962-63 (11,100) 77,400 1986-87 4,000 242,200 2010-11 110,000 251,500<br />
1963-64 10,300 87,700 1987-88 (11,700) 230,500 2011-12 - -<br />
1964-65 35,200 122,900 1988-89 10,400 240,900 2012-13 - -<br />
1965-66 21,100 144,000 1989-90 13,600 254,500 2013-14 - -<br />
1966-67 21,400 165,400 1990-91 28,400 282,900 2014-15 - -<br />
1967-68 11,400 176,800 1991-92 1,600 284,500 2015-16 - -<br />
1968-69 (7,500) 169,300 1992-93 45,800 330,300 2016-17 - -<br />
1969-70 (800) 168,500 1993-94 (28,500) 301,800 2017-18 - -<br />
1970-71 (3,400) 165,100 1994-95 19,400 321,200 2018-19 - -<br />
1971-72 (50,600) 114,500 1995-96 12,500 333,700 2019-20 - -<br />
1972-73 34,800 149,300 1996-97 15,700 349,400 2020-21 - -<br />
1973-74 (2,400) 146,900 1997-98 16,700 366,100 2021-22 - -<br />
1974-75 (14,100) 132,800 1998-99 (80,200) 285,900 2022-23 - -<br />
1975-76 (40,200) 92,600 1999-00 (30,000) 255,900 2023-24 - -<br />
1976-77 (32,900) 59,700 2000-01 (400) 255,500 2024-25 - -<br />
1977-78 88,600 148,300 2001-02 (36,500) 219,000 2025-26 - -<br />
1978-79 30,100 178,400 2002-03 (10,500) 208,500 2026-27 - -<br />
1979-80 (1,100) 177,300 2003-04 (43,000) 165,500 2027-28 - -<br />
1980-81 17,100 194,400 2004-05 89,100 254,600 2028-29 - -<br />
1981-82 18,400 212,800 2005-06 12,000 266,600 2029-30 - -<br />
1982-83 46,800 259,600 2006-07 (59,000) 207,600 2030-31 - -<br />
1983-84 (22,400) 237,200 2007-08 (41,600) 166,000 2031-32 - -<br />
1984-85 (9,600) 227,600 2008-09 (51,500) 114,500 2032-33 - -<br />
Note: Numbers in parentheses represent negative values.<br />
400<br />
CUMMULATIVE CHANGE IN STORAGE<br />
350<br />
Year-End Storage (x1000 AF)<br />
300<br />
250<br />
200<br />
150<br />
100<br />
50<br />
0<br />
1962<br />
1964<br />
1966<br />
1968<br />
1970<br />
1972<br />
1974<br />
1976<br />
1978<br />
1980<br />
1982<br />
1984<br />
1986<br />
1988<br />
1990<br />
1992<br />
1994<br />
1996<br />
1998<br />
2000<br />
2002<br />
2004<br />
2006<br />
2008<br />
2010<br />
Year
Table 9<br />
QUANTITY OF WATER REQUIRED FOR ARTIFICIAL REPLENISHMENT<br />
WATER TYPE<br />
Long Term Average for Imported Spreading (updated, see below)*<br />
Recycled <strong>Water</strong> for Spreading (WRD Purchases)<br />
Total Spreading<br />
West Coast Barrier - Imported<br />
West Coast Barrier - Recycled<br />
Dominguez Gap - Imported<br />
Dominguez Gap - Recycled<br />
Alamitos Barrier - Imported - WRD portion only<br />
Alamitos Barrier - Recycled - WRD portion only<br />
Total Barriers<br />
In-Lieu Central Basin<br />
In-Lieu West Coast Basin<br />
Total In-Lieu<br />
Total <strong>Water</strong> Purchase Estimate for Ensuing Year<br />
Less Board-Adopted Imported <strong>Water</strong> Spreading Reduction<br />
on 5/4/2012 (Board approved 2,180 AF for ensuing year)<br />
AMOUNT (AF)<br />
21,000<br />
50,000<br />
71,000<br />
4,500<br />
13,500<br />
8,000<br />
0<br />
2,540<br />
1,800<br />
30,340<br />
0<br />
0<br />
0<br />
101,340<br />
(18,820)<br />
Total <strong>Water</strong> Purchase Estimate for Ensuing Year 82,520<br />
* - Derivation <strong>of</strong> new Long Term Imported Spreading Requirement is possible due to new projects<br />
that will capture more storm/recycled water for conservation, and thus less imported needs:<br />
1. Long Term Average <strong>of</strong> 27,600 af defined in 2003 ESR<br />
2. Minus 3,000 afy for increasing Whittier Narrows Conservation Pool<br />
3. Minus 3,600 afy for two new rubber dams on San Gabriel River<br />
4 Equals new Long Term Average <strong>of</strong> 21,000 afy imported spreading
WATER<br />
YEAR<br />
HISTORICAL AMOUNTS OF WATER PURCHASED<br />
(a) (g)<br />
FOR SPREADING IN THE MONTEBELLO FOREBAY<br />
(in acre-feet)<br />
Imported <strong>Water</strong> Recycled <strong>Water</strong> Local <strong>Water</strong> Make-up <strong>Water</strong><br />
LACFC<br />
D or<br />
Other WRD TOTAL<br />
Whittier<br />
WRP<br />
San Jose<br />
Creek<br />
WRP<br />
Pomona<br />
WRP<br />
TOTAL<br />
Stormwater and<br />
River Baseflow<br />
USGVMW<br />
D<br />
&<br />
CBMWD TOTAL<br />
TOTAL<br />
1959-60 80,900 80,900 - 20,064 - 100,964<br />
1960-61 80,800 67,000 147,800 - 9,118 - 156,918<br />
1961-62 39,500 168,622 208,122 1,178 1,178 39,548 - 248,848<br />
1962-63 4,800 75,790 80,590 12,405 12,405 14,565 - 107,560<br />
1963-64 - 104,900 104,900 13,258 13,258 9,992 - 128,150<br />
1964-65 75,500 84,670 160,170 14,528 14,528 13,097 - 187,795<br />
1965-66 67,800 53,900 121,700 15,056 15,056 45,754 6,500 6,500 189,010<br />
1966-67 74,100 10,200 84,300 16,223 16,223 59,820 - - 160,343<br />
1967-68 66,600 28,800 95,400 18,275 18,275 39,760 - - 153,435<br />
1968-69 12,500 5,300 17,800 13,877 13,877 119,395 - - 151,072<br />
1969-70 25,800 43,100 68,900 17,158 17,158 52,917 - - 138,975<br />
1970-71 46,700 25,400 72,100 19,494 3,232 22,726 44,757 - - 139,583<br />
1971-72 - 34,400 34,400 17,543 4,456 21,999 17,688 - - 74,087<br />
1972-73 - 71,947 71,947 13,622 8,327 5,937 27,886 45,077 - 20,000 20,000 164,910<br />
1973-74 - 68,237 68,237 13,385 7,064 3,003 23,452 29,171 - 23,921 23,921 144,781<br />
1974-75 - 71,900 71,900 14,650 6,549 5,592 26,791 29,665 - - - 128,356<br />
1975-76 - 50,800 50,800 12,394 9,062 6,231 27,687 22,073 - - - 100,560<br />
1976-77 - 9,300 9,300 10,158 12,705 6,496 29,359 19,252 14,500 6,900 21,400 79,311<br />
1977-78 - 39,900 39,900 13,104 5,997 6,621 25,722 147,317 7,800 - 7,800 220,739<br />
1978-79 - 65,300 65,300 10,716 11,741 6,403 28,860 68,859 - - - 163,019<br />
1979-80 - 10,200 10,200 14,568 9,815 5,023 29,406 106,820 10,900 - 10,900 157,326<br />
1980-81 3,300 28,700 32,000 11,464 14,645 5,613 31,722 50,590 31,500 - 31,500 145,812<br />
1981-82 - 4,600 4,600 14,133 15,285 4,634 34,052 47,930 30,900 - 30,900 117,482<br />
1982-83 - 2,000 2,000 12,818 4,217 5,735 22,770 126,076 8,900 - 8,900 159,746<br />
1983-84 - 1,500 1,500 13,194 14,590 4,457 32,241 60,710 20,800 - 20,800 115,251<br />
1984-85 - 40,600 40,600 12,905 14,093 4,380 31,378 39,099 - - - 111,077<br />
1985-86 - 21,500 21,500 13,827 11,487 3,965 29,279 66,966 - - - 117,745<br />
1986-87 - 49,200 49,200 15,280 20,041 2,655 37,976 27,613 - 6,500 6,500 121,289<br />
1987-88 - 23,300 23,300 14,585 27,182 1,582 43,349 50,068 5,800 - 5,800 122,517<br />
1988-89 - 50,300 50,300 13,830 33,327 2,616 49,773 17,096 6,500 - 6,500 123,669<br />
1989-90 - 52,700 52,700 15,043 33,498 1,568 50,109 9,388 13,600 - 13,600 125,797<br />
1990-91 - 56,300 56,300 13,841 38,603 1,420 53,864 35,717 100 - 100 145,981<br />
1991-92 - 43,100 43,100 12,620 31,326 2,957 46,903 136,357 - - - 226,360<br />
1992-93 - 16,561 16,561 11,026 29,811 8,027 48,864 147,699 - - - 213,124<br />
1993-94 - 20,411 20,411 10,249 40,768 2,965 53,981 55,896 - - - 130,288<br />
1994-95 - 21,837 21,837 10,642 18,431 4,228 33,300 100,578 - - - 155,715<br />
1995-96 - 18,012 18,012 9,971 40,922 2,969 53,862 62,920 - - - 134,794<br />
1996-97 - 22,738 22,738 9,850 36,977 3,132 49,959 58,262 - - - 130,959<br />
1997-98 - 952 952 8,378 26,483 2,156 37,017 96,706 - - - 134,675<br />
1998-99 - - - 10,968 34,782 1,451 47,201 32,013 - - - 79,214<br />
1999-00 - 45,037 45,037 8,950 30,481 3,839 43,270 20,607 - - - 108,914<br />
2000-01 - 23,451 23,451 8,253 35,165 2,925 46,343 39,725 - - - 109,519<br />
2001-02 - 42,875 42,875 (c) 8,474 50,194 1,928 60,596 17,000 - - - 120,471<br />
2002-03 - 22,366 22,366 (d) 5,156 35,320 2,320 42,796 58,202 - - - 123,364<br />
2003-04 - 27,520 27,520 (e) 8,195 34,033 2,697 44,925 30,467 - - - 102,912<br />
2004-05 - 25,296 25,296 (e) 6,741 20,547 2,215 29,503 148,674 - - - 203,473<br />
2005-06 - 33,229 33,229 8,868 30,180 2,973 42,022 60,377 - - - 135,628<br />
2006-07 - 40,214 40,214 7,334 34,823 2,882 45,039 11,495 - - - 96,748<br />
2007-08 1,510 - 1,510 (b) 6,212 29,131 4,424 39,767 54,518 - - - 95,795<br />
2008-09 - - - 5,202 29,999 4,410 39,611 35,348 - - - 74,959<br />
2009-10 - 26,286 26,286 5,431 45,538 4,762 55,731 35,398 - - - 117,415<br />
2010-11 - 37,315 37,315 7,576 24,323 5,231 37,131 113,295 - - - 187,741<br />
TOTAL 579,810 1,887,565 2,467,375 582,608 957,462 160,105 1,700,176 2,801,500 157,800 57,321 215,121 7,184,172<br />
(a) Imported and Recycled are purchased, local and Pomona WRP are incidental recharge. Purchased water may have losses to Main Basin before reaching the Spreading Grounds<br />
(b) CBMWD purchased 1,510 af <strong>of</strong> imported water for spreading for Downey, Lakewood, and Cerritos.<br />
(c) Includes 1,607 af <strong>of</strong> EPA extracted groundwater from Whittier Narrows considered imported water to WRD. Paid for in 2003.<br />
(d) Includes 5,069 af <strong>of</strong> EPA extracted groundwater from W.N. considered imported water to WRD. Paid for in June 2005.<br />
(e) Includes 13,000 af <strong>of</strong> water banked by Long Beach under a storage agreement with WRD (792 af 02/03, 12,210 af 3/04).<br />
(g) Includes the Rio Hondo Spreading Grounds, Whitter Narrows Conservation Pool, San Gabriel Spreading Grounds and unlined San Gabriel River.
HISTORICAL AMOUNTS OF WATER PURCHASED FOR INJECTION (c)<br />
(in acre-feet)<br />
<strong>Water</strong> West Coast Dominguez Gap Alamitos Barrier<br />
Barrier (a)<br />
Barrier (b)<br />
Year<br />
WRD OCWD Total TOTAL<br />
Imported Recycled Total Imported Recycled Total Imported Recycled Total Imported Recycled Total<br />
1959-60 3,700 3,700 3,700<br />
1960-61 4,420 4,420 4,420<br />
1961-62 4,460 4,460 4,460<br />
1962-63 4,150 4,150 4,150<br />
1963-64 10,450 10,450 10,450<br />
1964-65 33,020 33,020 2,760 2,760 200 200 2,960 35,980<br />
1965-66 44,390 44,390 3,370 3,370 350 350 3,720 48,110<br />
1966-67 43,060 43,060 3,390 3,390 490 490 3,880 46,940<br />
1967-68 39,580 39,580 4,210 4,210 740 740 4,950 44,530<br />
1968-69 36,420 36,420 4,310 4,310 950 950 5,260 41,680<br />
1969-70 29,460 29,460 3,760 3,760 720 720 4,480 33,940<br />
1970-71 29,870 29,870 2,200 2,200 3,310 3,310 822 822 4,132 36,202<br />
1971-72 26,490 26,490 9,550 9,550 4,060 4,060 936 936 4,996 41,036<br />
1972-73 28,150 28,150 8,470 8,470 4,300 4,300 883 883 5,183 41,803<br />
1973-74 27,540 27,540 7,830 7,830 6,140 6,140 1,148 1,148 7,288 42,658<br />
1974-75 26,430 26,430 5,160 5,160 4,440 4,440 716 716 5,156 36,746<br />
1975-76 35,220 35,220 4,940 4,940 4,090 4,090 565 565 4,655 44,815<br />
1976-77 34,260 34,260 9,280 9,280 4,890 4,890 885 885 5,775 49,315<br />
1977-78 29,640 29,640 5,740 5,740 4,020 4,020 831 831 4,851 40,231<br />
1978-79 23,720 23,720 5,660 5,660 4,220 4,220 898 898 5,118 34,498<br />
1979-80 28,630 28,630 4,470 4,470 3,560 3,560 575 575 4,135 37,235<br />
1980-81 26,350 26,350 3,550 3,550 3,940 3,940 524 524 4,464 34,364<br />
1981-82 24,640 24,640 4,720 4,720 4,540 4,540 394 394 4,934 34,294<br />
1982-83 33,950 33,950 6,020 6,020 3,270 3,270 1,943 1,943 5,213 45,183<br />
1983-84 28,000 28,000 7,640 7,640 2,440 2,440 1,402 1,402 3,842 39,482<br />
1984-85 25,210 25,210 7,470 7,470 3,400 3,400 1,446 1,446 4,846 37,526<br />
1985-86 20,260 20,260 6,160 6,160 3,410 3,410 1,863 1,863 5,273 31,693<br />
1986-87 26,030 26,030 6,230 6,230 4,170 4,170 2,754 2,754 6,924 39,184<br />
1987-88 24,270 24,270 7,050 7,050 3,990 3,990 2,173 2,173 6,163 37,483<br />
1988-89 22,740 22,740 5,220 5,220 3,900 3,900 2,173 2,173 6,073 34,033<br />
1989-90 20,279 20,279 5,736 5,736 4,110 4,110 1,929 1,929 6,039 32,054<br />
1990-91 16,039 16,039 7,756 7,756 4,096 4,096 1,799 1,799 5,895 29,690<br />
1991-92 22,180 22,180 6,894 6,894 4,172 4,172 1,552 1,552 5,724 34,798<br />
1992-93 21,516 21,516 4,910 4,910 3,350 3,350 1,565 1,565 4,915 31,341<br />
1993-94 15,482 15,482 5,524 5,524 2,794 2,794 1,309 1,309 4,103 25,109<br />
1994-95 14,237 1,480 15,717 4,989 4,989 2,883 2,883 890 890 3,773 24,479<br />
1995-96 12,426 4,170 16,596 5,107 5,107 3,760 3,760 2,010 2,010 5,770 27,473<br />
1996-97 11,372 6,241 17,613 5,886 5,886 3,854 3,854 1,750 1,750 5,604 29,103<br />
1997-98 8,173 8,306 16,479 3,771 3,771 3,677 3,677 1,504 1,504 5,181 25,431<br />
1998-99 10,125 6,973 17,097 4,483 4,483 4,012 4,012 1,689 1,689 5,700 27,280<br />
1999-00 11,172 7,460 18,632 6,010 6,010 4,028 4,028 1,707 1,707 5,735 30,377<br />
2000-01 13,988 6,838 20,826 3,923 3,923 3,710 3,710 1,964 1,964 5,674 30,423<br />
2001-02 12,724 7,276 20,000 5,459 5,459 3,961 3,961 2,232 2,232 6,193 31,652<br />
2002-03 10,419 6,192 16,611 8,056 8,056 3,445 3,445 1,197 1,197 4,642 29,309<br />
2003-04 9,304 3,669 12,973 6,089 6,089 3,876 3,876 2,092 2,092 5,968 25,030<br />
2004-05 4,548 3,920 8,468 8,557 8,557 2,870 2,870 1,685 1,685 4,555 21,580<br />
2005-06 5,997 4,249 10,246 7,259 1,450 8,709 1,042 921 1,963 330 254 584 2,547 21,502<br />
2006-07 4,373 10,960 15,333 5,510 1,733 7,243 1,568 219 1,787 543 165 708 2,495 25,071<br />
2007-08 3,662 10,954 14,616 4,468 2,452 6,920 3,467 1,284 4,751 1,283 475 1,758 6,509 28,045<br />
2008-09 7,178 6,434 13,612 4,550 2,414 6,964 4,145 1,275 5,420 1,518 535 2,053 7,473 28,049<br />
2009-10 9,661 7,620 17,281 5,495 2,037 7,532 2,596 1,775 4,371 659 470 1,129 5,500 30,313<br />
2010-11 7,466 7,440 14,906 3,929 2,363 6,292 1,968 1,482 3,450 638 875 1,513 4,963 26,161<br />
TOTAL 1,026,831 110,181 1,137,012 241,721 12,449 254,170 171,274 6,956 178,230 58,226 2,774 61,000 239,229 1,630,411<br />
(a) Prior to 10/1/71, water was purchased by the State, West Basin <strong>Water</strong> Association, local water interests,<br />
Zone II <strong>of</strong> the LA County Flood Control <strong>District</strong> and WRD. After 10/1/71, all purchases have been by WRD<br />
(b) In 1970-71, purchases were shared by WRD and Zone II. After 10/1/71, all purchases have been by WRD<br />
(c) Numbers updated and reconfirmed in the 2011 ESR by reviewing data from all previous ESRs
HISTORICAL AMOUNTS OF THE IN-LIEU PROGRAM<br />
(in acre-feet)<br />
WATER<br />
YEAR<br />
TOTAL<br />
1965-66 - 745 745<br />
1966-67 - 851 851<br />
1967-68 - 850 850<br />
1968-69 - 850 850<br />
1969-70 - 900 900<br />
1970-71 - 881 881<br />
1971-72 - 756 756<br />
1972-73 - 901 901<br />
1973-74 - 901 901<br />
1974-75 - 400 400<br />
1975-76 - 400 400<br />
1976-77 - 400 400<br />
1977-78 11,316 4,815 16,131<br />
1978-79 9,723 8,655 18,378<br />
1979-80 10,628 4,333 14,961<br />
FISCAL YEAR<br />
CENTRAL<br />
BASIN<br />
WEST COAST<br />
BASIN<br />
1980-81 17,617 6,206 23,823<br />
1981-82 14,050 4,833 18,883<br />
1982-83 13,813 5,939 19,752<br />
1983-84 29,216 12,524 41,740<br />
1984-85 23,246 13,594 36,840<br />
1985-86 15,505 10,627 26,132<br />
1986-87 16,205 12,997 29,202<br />
1987-88 15,518 12,893 28,411<br />
1988-89 11,356 14,069 25,425<br />
1989-90 16,858 12,293 29,151<br />
1990-91 11,886 10,153 22,039<br />
1991-92 13,000 6,104 19,104<br />
1992-93 37,652 15,654 53,306<br />
1993-94 83,488 26,093 109,581<br />
1994-95 32,904 17,994 50,898<br />
1995-96 37,517 13,816 51,333<br />
1996-97 34,547 4,847 39,394<br />
1997-98 22,995 7,335 30,330<br />
1998-99 13,213 10,303 23,516<br />
1999-00 18,799 3,479 22,278<br />
2000-01 18,364 2,817 21,181<br />
2001-02 11,931 8,789 20,720<br />
2002-03 6,866 4,339 11,205<br />
2003-04 - - -<br />
2004-05 6,000 1,804 7,804<br />
2005-06 7,475 2,414 9,889<br />
2006-07 5,779 3,480 9,259<br />
2007-08 - - -<br />
2008-09 - - -<br />
2009-10 6,724 - 6,724<br />
2010-11 7,950 - 7,950<br />
TOTAL<br />
582,142 272,035 854,177
HISTORICAL AMOUNTS OF REPLENISHMENT WATER<br />
(in acre-feet)<br />
MONTEBELLO FOREBAY SPREADING WATER INJECTION WATER* IN-LIEU<br />
WATER<br />
YEAR<br />
IMPORTED RECLAIMED LOCAL MAKEUP<br />
TOTAL Imported Recycled Total Total<br />
WATER WATER WATER WATER<br />
TOTAL<br />
1959-60 80,900 - 20,064 - 100,964 3,700 - 3,700 104,664<br />
1960-61 147,800 - 9,118 - 156,918 4,420 - 4,420 161,338<br />
1961-62 208,122 1,178 39,548 - 248,848 4,460 - 4,460 253,308<br />
1962-63 80,590 12,405 14,565 - 107,560 4,150 - 4,150 111,710<br />
1963-64 104,900 13,258 9,992 - 128,150 10,450 - 10,450 138,600<br />
1964-65 160,170 14,528 13,097 - 187,795 35,980 - 35,980 223,775<br />
1965-66 121,700 15,056 45,754 6,500 189,010 48,110 - 48,110 745 237,865<br />
1966-67 84,300 16,223 59,820 - 160,343 46,940 - 46,940 851 208,134<br />
1967-68 95,400 18,275 39,760 - 153,435 44,530 - 44,530 850 198,815<br />
1968-69 17,800 13,877 119,395 - 151,072 41,680 - 41,680 850 193,602<br />
1969-70 68,900 17,158 52,917 - 138,975 33,940 - 33,940 900 173,815<br />
1970-71 72,100 22,726 44,757 - 139,583 36,202 - 36,202 881 176,666<br />
1971-72 34,400 21,999 17,688 - 74,087 41,036 - 41,036 756 115,879<br />
1972-73 71,947 27,886 45,077 20,000 164,910 41,803 - 41,803 901 207,614<br />
1973-74 68,237 23,452 29,171 23,921 144,781 42,658 - 42,658 901 188,340<br />
1974-75 71,900 26,791 29,665 - 128,356 36,746 - 36,746 400 165,502<br />
1975-76 50,800 27,687 22,073 - 100,560 44,815 - 44,815 400 145,775<br />
1976-77 9,300 29,359 19,252 21,400 79,311 49,315 - 49,315 400 129,026<br />
1977-78 39,900 25,722 147,317 7,800 220,739 40,231 - 40,231 16,131 277,101<br />
1978-79 65,300 28,860 68,859 - 163,019 34,498 - 34,498 18,378 215,895<br />
1979-80 10,200 29,406 106,820 10,900 157,326 37,235 - 37,235 14,961 209,522<br />
1980-81 32,000 31,722 50,590 31,500 145,812 34,364 - 34,364 23,823 203,999<br />
1981-82 4,600 34,052 47,930 30,900 117,482 34,294 - 34,294 18,883 170,659<br />
1982-83 2,000 22,770 126,076 8,900 159,746 45,183 - 45,183 19,752 224,681<br />
1983-84 1,500 32,241 60,710 20,800 115,251 39,482 - 39,482 41,740 196,473<br />
1984-85 40,600 31,378 39,099 - 111,077 37,526 - 37,526 36,840 185,443<br />
1985-86 21,500 29,279 66,966 - 117,745 31,693 - 31,693 26,132 175,570<br />
1986-87 49,200 37,976 27,613 6,500 121,289 39,184 - 39,184 29,202 189,675<br />
1987-88 23,300 43,349 50,068 5,800 122,517 37,483 - 37,483 28,411 188,411<br />
1988-89 50,300 49,773 17,096 6,500 123,669 34,033 - 34,033 25,425 183,127<br />
1989-90 52,700 50,109 9,388 13,600 125,797 32,054 - 32,054 29,151 187,002<br />
1990-91 56,300 53,864 35,717 100 145,981 29,690 - 29,690 22,039 197,710<br />
1991-92 43,100 46,903 136,357 - 226,360 34,798 - 34,798 19,104 280,262<br />
1992-93 16,561 48,864 147,699 - 213,124 31,341 - 31,341 53,306 297,771<br />
1993-94 20,411 53,981 55,896 - 130,288 25,109 - 25,109 109,581 264,978<br />
1994-95 21,837 33,300 100,578 - 155,715 22,999 1,480 24,479 50,898 231,092<br />
1995-96 18,012 53,862 62,920 - 134,794 23,304 4,170 27,473 51,333 213,600<br />
1996-97 22,738 49,959 58,262 - 130,959 22,862 6,241 29,103 39,394 199,456<br />
1997-98 952 37,017 96,706 - 134,675 17,125 8,306 25,431 30,330 190,436<br />
1998-99 - 47,201 32,013 - 79,214 20,308 6,973 27,280 23,516 130,010<br />
1999-00 45,037 43,270 20,607 - 108,914 22,917 7,460 30,377 22,278 161,569<br />
2000-01 23,451 46,343 39,725 - 109,519 23,585 6,838 30,423 21,181 161,123<br />
2001-02 42,875 60,596 17,000 - 120,471 24,376 7,276 31,652 20,720 172,843<br />
2002-03 22,366 42,796 58,202 - 123,364 23,117 6,192 29,309 11,205 163,878<br />
2003-04 27,520 44,925 30,467 - 102,912 21,361 3,669 25,030 - 127,942<br />
2004-05 25,296 29,503 148,674 - 203,473 17,660 3,920 21,580 7,804 232,857<br />
2005-06 33,229 42,022 60,377 - 135,628 14,628 6,874 21,502 9,889 167,019<br />
2006-07 40,214 45,039 11,495 - 96,748 11,994 13,077 25,071 9,259 131,078<br />
2007-08 1,510 39,767 54,518 - 95,795 12,880 15,165 28,045 - 123,840<br />
2008-09 - 39,611 35,348 - 74,959 17,391 10,658 28,049 - 103,008<br />
2009-10 26,286 55,731 35,398 - 117,415 18,411 11,902 30,313 6,724 154,452<br />
2010-11 37,315 37,131 113,295 - 187,741 14,001 12,160 26,161 7,950 221,852<br />
TOTAL 2,467,375 1,700,176 2,801,500 215,121 7,184,172 1,498,051 132,360 1,630,411 854,177 9,668,759<br />
* - Including Orange County sidc <strong>of</strong> Alamitos Barrier
HISTORICAL AMOUNTS OF<br />
GROUNDWATER PRODUCTION<br />
(in acre-feet)<br />
WATER CENTRAL WEST<br />
YEAR BASIN COAST<br />
TOTAL<br />
1959-60 245,400 66,600 312,000<br />
1960-61 292,500 61,900 354,400<br />
1961-62 275,800 59,100 334,900<br />
1962-63 225,400 59,100 284,500<br />
1963-64 219,100 61,300 280,400<br />
1964-65 211,600 59,800 271,400<br />
1965-66 222,800 60,800 283,600<br />
1966-67 206,700 62,300 269,000<br />
1967-68 220,100 61,600 281,700<br />
1968-69 213,800 61,600 275,400<br />
1969-70 222,200 62,600 284,800<br />
1970-71 211,600 60,900 272,500<br />
1971-72 216,100 64,800 280,900<br />
1972-73 205,600 60,300 265,900<br />
1973-74 211,300 55,000 266,300<br />
1974-75 213,100 56,700 269,800<br />
1975-76 215,300 59,400 274,700<br />
1976-77 211,500 59,800 271,300<br />
1977-78 196,600 58,300 254,900<br />
1978-79 207,000 58,000 265,000<br />
1979-80 209,500 57,100 266,600<br />
1980-81 211,915 57,711 269,626<br />
1981-82 202,587 61,874 264,461<br />
1982-83 194,548 57,542 252,090<br />
1983-84 196,660 51,930 248,590<br />
1984-85 193,085 52,746 245,831<br />
1985-86 86 195,972972 53,362362 249,334<br />
1986-87 196,660 48,026 244,686<br />
1987-88 194,704 43,837 238,541<br />
1988-89 200,207 44,323 244,530<br />
1989-90 197,621 48,047 245,668<br />
1990-91 187,040 53,660 240,700<br />
1991-92 196,400 56,318 252,718<br />
1992-93 150,495 40,241 190,736<br />
1993-94 156,565 41,826 198,391<br />
1994-95 180,269 41,729 221,998<br />
1995-96 182,414 52,222 234,636<br />
1996-97 187,561 52,576 240,137<br />
1997-98 188,305 51,859 240,164<br />
1998-99 204,418 51,926 256,344<br />
1999-00 198,483 53,599 252,082<br />
2000-01 195,361 53,870 249,231<br />
2001-02 200,168 50,063 250,231<br />
2002-03 190,268 51,946 242,214<br />
2003-04 200,365 48,013 248,378<br />
2004-05 188,707 41,297 230,004<br />
2005-06 191,030 36,809 227,839<br />
2006-07 198,115 37,655 235,770<br />
2007-08 206,260 38,472 244,732<br />
2008-09 198,156 45,246 243,402<br />
2009-10 197,387 43,942 241,329<br />
2010-11 170,799 44,397 215,196<br />
TOTAL 10,605,525 2,774,064 13,379,589
WATER<br />
YEAR<br />
HISTORICAL AMOUNTS OF WATER USE<br />
IN THE WRD SERVICE AREA*<br />
GROUNDWATER<br />
PRODUCTION<br />
(in acre-feet)<br />
IMPORTED<br />
WATER FOR<br />
DIRECT USE*<br />
RECLAIMED<br />
WATER FOR<br />
DIRECT USE*<br />
TOTAL<br />
1960-61 312,000 196,800 508,800<br />
1961-62 334,900 178,784 513,684<br />
1962-63 284,500 222,131 506,631<br />
1963-64 280,400 257,725 538,125<br />
1964-65 271,400 313,766 585,166<br />
1965-66 283,600 308,043 591,643<br />
1966-67 269,000 352,787 621,787<br />
1967-68 281,700 374,526 656,226<br />
1968-69 275,400 365,528 640,928<br />
1969-70 284,800 398,149 682,949<br />
1970-71 272,500 397,122 669,622<br />
1971-72 280,900 428,713 709,613<br />
1972-73 265,900 400,785 666,685<br />
1973-74 266,300 410,546 676,846<br />
1974-75 269,800 380,228 650,028<br />
1975-76 274,700 404,958 679,658<br />
1976-77 271,300 355,896 627,196<br />
1977-78 254,900 373,116 628,016<br />
1978-79 265,000 380,101 100 (a) 645,201<br />
1979-80 266,600 397,213 200 664,013<br />
1980-81 269,626 294,730 300 564,656<br />
1981-82 264,461 391,734 300 656,495<br />
1982-83 252,090 408,543 400 661,033<br />
1983-84 248,590 441,151 1,800 691,541<br />
1984-85 245,831 451,549 2,000 699,380<br />
1985-86 249,334 427,860 2,400 679,594<br />
1986-87 244,686 478,744 2,300 725,730<br />
1987-88 238,541 479,318 3,500 721,359<br />
1988-89 244,530 466,166 5,300 715,996<br />
1989-90 245,668 448,285 5,900 699,853<br />
1990-91 240,700 485,109 5,000 730,809<br />
1991-92 252,718 395,191 4,900 652,809<br />
1992-93 190,736 388,949 824 580,509<br />
1993-94 198,391 483,287 3,413 685,091<br />
1994-95 221,998 437,191 6,143 665,332<br />
1995-96 234,636 426,699 19,804 681,139<br />
1996-97 240,137 436,569 25,046 701,752<br />
1997-98 240,164 375,738 27,075 642,977<br />
1998-99 256,344 396,655 30,510 683,509<br />
1999-00 252,082 395,681 33,589 681,352<br />
2000-01 249,231 395,024 32,589 676,844<br />
2001-02 250,231 395,799 38,694 684,724<br />
2002-03 242,214 381,148 38,839 662,201<br />
2003-04 248,378 389,233 36,626 674,237<br />
2004-05 230,004 402,660 33,988 666,652<br />
2005-06 227,839 366,815 35,301 629,955<br />
2006-07 235,770 376,492 41,899 654,161<br />
2007-08 244,732 346,035 45,120 635,887<br />
2008-09 243,402 320,711 43,153 607,266<br />
2009-10 241,329 278,857 43,547 563,734<br />
2010-11 215,196 286,448 39,418 541,062<br />
TOTAL 13,025,189 19,345,288 609,979 32,980,455<br />
(a) Los Coyotes on-line in 1979; Long Beach on-line in 1980<br />
* - Includes imported & recycled at seawater barriers, but not spreading grounds.
WATER<br />
YEAR<br />
CITY OF LONG BEACH<br />
WRD GROUNDWATER BANKING PROGRAMS<br />
(in acre-feet)<br />
LONG BEACH/ALAMITOS BARRIER<br />
Seasonal <strong>Water</strong><br />
LONG BEACH/ALAMITOS BARRIER<br />
Tier 1 <strong>Water</strong><br />
TOTAL<br />
Banked Called Balance Banked Called Balance Banked Called Balance Banked Called Balance<br />
2002-03 4,864 - 4,864 - - - - - - 4,864 - 4,864<br />
2003-04 8,136 - 13,000 - - - - - - 8,136 - 13,000<br />
2004-05 - - 13,000 3,652 - 3,652 - - - 3,652 - 16,652<br />
2005-06 - - 13,000 1,324 56 4,919 - - - 1,324 56 17,919<br />
2006-07 - - 13,000 300 1,561 3,658 - - - 300 1,561 16,658<br />
2007-08 - 2,416 10,584 - 1,498 2,160 - - - - 3,914 12,744<br />
2008-09 - 4,182 6,402 - - 2,160 2,000 - 2,000 2,000 4,182 10,562<br />
2009-10 - - 6,402 - - 2,160 - 2,000 - - 2,000 8,562<br />
2010-11 - - 6,402 - - 2,160 - - - - - 8,562<br />
TOTAL 13,000 6,598 5,275 3,115 2,000 2,000 20,275 11,713
FIGURES
2006/07<br />
2001/02<br />
1996/97<br />
HISTORICAL RAINFALL<br />
DPW Station #107D - WRD Tracking Station<br />
86 Year Running<br />
Average = 14.3"<br />
1991/92<br />
1986/87<br />
1981/82<br />
1976/77<br />
1971/72<br />
1966/67<br />
1961/62<br />
1956/57<br />
1951/52<br />
1946/47<br />
<strong>Water</strong> Year<br />
1941/42<br />
1936/37<br />
1931/32<br />
1926/27<br />
35<br />
30<br />
25<br />
20<br />
Rainfall (inches)<br />
15<br />
10<br />
5<br />
0<br />
Figure A
240<br />
220<br />
200<br />
180<br />
160<br />
140<br />
120<br />
100<br />
80<br />
60<br />
40<br />
20<br />
0<br />
-20<br />
-40<br />
-60<br />
-80<br />
-100<br />
-120<br />
-140<br />
Ground Surface<br />
Well No. 2S/11W-18K03<br />
LACDPW No. 1620E<br />
Well No. 2S/11W-18K02<br />
LACDPW No. 1620G<br />
Well No.<br />
Pico 1, Zone 4<br />
WRD<br />
240<br />
220<br />
200<br />
180<br />
160<br />
140<br />
120<br />
100<br />
80<br />
60<br />
40<br />
20<br />
0<br />
-20<br />
-40<br />
-60<br />
-80<br />
-100<br />
-120<br />
-140<br />
ELEVATION IN FEET - USGS DATUM<br />
1930<br />
240<br />
220<br />
200<br />
180<br />
160<br />
140<br />
120<br />
100<br />
80<br />
60<br />
40<br />
20<br />
0<br />
-20<br />
-40<br />
-60<br />
-80<br />
-100<br />
-120<br />
-140<br />
1930<br />
240<br />
220<br />
200<br />
180<br />
160<br />
140<br />
120<br />
100<br />
80<br />
60<br />
40<br />
20<br />
0<br />
-20<br />
-40<br />
-60<br />
-80<br />
-100<br />
-120<br />
-140<br />
1935<br />
1935<br />
1940<br />
1940<br />
1945<br />
1950<br />
Ground Surface<br />
1955<br />
Well No. 2S/12W-24M03<br />
LACDPW No. 1601P<br />
1945<br />
1950<br />
Ground Surface<br />
Well No. 3S/12W-01A06<br />
LACDPW No. 1615P<br />
1955<br />
1960<br />
1960<br />
1965<br />
1965<br />
1970<br />
1970<br />
1975<br />
1975<br />
1980<br />
1980<br />
1985<br />
1985<br />
1990<br />
1990<br />
1995<br />
1995<br />
2000<br />
2000<br />
2005<br />
Well No. 2S/12W-24M08<br />
LACDPW No. 1601T<br />
2005<br />
2010<br />
2010<br />
2015<br />
2015<br />
240<br />
220<br />
200<br />
180<br />
160<br />
140<br />
120<br />
100<br />
80<br />
60<br />
40<br />
20<br />
0<br />
-20<br />
-40<br />
-60<br />
-80<br />
-100<br />
-120<br />
-140<br />
240<br />
220<br />
200<br />
180<br />
160<br />
140<br />
120<br />
100<br />
80<br />
60<br />
40<br />
20<br />
0<br />
-20<br />
-40<br />
-60<br />
-80<br />
-100<br />
-120<br />
-140<br />
1930<br />
1935<br />
1940<br />
1945<br />
1950<br />
1955<br />
1960<br />
1965<br />
1970<br />
1975<br />
1980<br />
1985<br />
1990<br />
1995<br />
2000<br />
2005<br />
2010<br />
2015<br />
YEARS<br />
FLUCTUATION OF WATER LEVELS IN THE<br />
MONTEBELLO FOREBAY<br />
Figure C
240<br />
220<br />
Ground Surface<br />
240<br />
220<br />
200<br />
200<br />
ELEVATION IN FEET - USGS DATUM<br />
180<br />
160<br />
140<br />
120<br />
100<br />
80<br />
60<br />
40<br />
20<br />
0<br />
-20<br />
-40<br />
-60<br />
-80<br />
-100<br />
-120<br />
Well No. 2S/13W-10A01<br />
LACDPW No. 2778<br />
180<br />
160<br />
140<br />
120<br />
100<br />
80<br />
60<br />
40<br />
20<br />
0<br />
-20<br />
-40<br />
-60<br />
-80<br />
-100<br />
-120<br />
-140<br />
-140<br />
1930<br />
1935<br />
1940<br />
1945<br />
1950<br />
1955<br />
1960<br />
1965<br />
1970<br />
1975<br />
1980<br />
1985<br />
1990<br />
1995<br />
2000<br />
2005<br />
2010<br />
2015<br />
YEARS<br />
FLUCTUATION OF WATER LEVELS IN THE<br />
LOS ANGELES FOREBAY<br />
Figure B
120<br />
100<br />
80<br />
60<br />
40<br />
20<br />
0<br />
-20<br />
-40<br />
-60<br />
-80<br />
Ground Surface<br />
Well No. 4S/13W-12K01<br />
LACDPW No. 906D<br />
120<br />
100<br />
80<br />
60<br />
40<br />
20<br />
0<br />
-20<br />
-40<br />
-60<br />
-80<br />
ELEVATION IN FEET - USGS DATUM<br />
-100<br />
-120<br />
-140<br />
120<br />
100<br />
80<br />
60<br />
40<br />
20<br />
1930<br />
1935<br />
1940<br />
1945<br />
1950<br />
Well No. 4S/12W-28H09<br />
LACDPW No. 460K<br />
Ground Surface<br />
1955<br />
1960<br />
1965<br />
1970<br />
1975<br />
1980<br />
1985<br />
1990<br />
1995<br />
2000<br />
2005<br />
2010<br />
2015<br />
-100<br />
-120<br />
-140<br />
120<br />
100<br />
80<br />
60<br />
40<br />
20<br />
0<br />
0<br />
-20<br />
-20<br />
-40<br />
-40<br />
-60<br />
-60<br />
-80<br />
-80<br />
-100<br />
-100<br />
-120<br />
-120<br />
-140<br />
-140<br />
1930<br />
1935<br />
1940<br />
1945<br />
1950<br />
1955<br />
1960<br />
1965<br />
1970<br />
1975<br />
1980<br />
1985<br />
1990<br />
1995<br />
2000<br />
2005<br />
2010<br />
2015<br />
YEARS<br />
FLUCTUATION OF WATER LEVELS IN THE<br />
CENTRAL BASIN PRESSURE AREA<br />
Figure D
120<br />
120<br />
100<br />
100<br />
80<br />
Ground Surface<br />
80<br />
60<br />
40<br />
20<br />
0<br />
-20<br />
Well No. 3S/14W-21B02<br />
LACDPW No. 1349/1349A<br />
Well No. 3S/14W-22L01<br />
LACDPW No. 760C<br />
60<br />
40<br />
20<br />
0<br />
-20<br />
-40<br />
-40<br />
-60<br />
-60<br />
-80<br />
-80<br />
-100<br />
-100<br />
ELEVATION IN FEET - USGS DATUM<br />
-120<br />
-140<br />
120<br />
100<br />
80<br />
60<br />
40<br />
20<br />
0<br />
-20<br />
-40<br />
1930<br />
1935<br />
1940<br />
1945<br />
1950<br />
Ground Surface<br />
1955<br />
1960<br />
1965<br />
Well No.4S/13W-21H05<br />
LACDPW No. 868H<br />
1970<br />
1975<br />
1980<br />
1985<br />
1990<br />
Well No.<br />
Well No.4S/13W-22P01<br />
LACDPW No. 869<br />
1995<br />
2000<br />
2005<br />
Wilmington1_3<br />
2010<br />
2015<br />
-120<br />
-140<br />
120<br />
100<br />
80<br />
60<br />
40<br />
20<br />
0<br />
-20<br />
-40<br />
-60<br />
-60<br />
-80<br />
-80<br />
-100<br />
-100<br />
-120<br />
-120<br />
-140<br />
-140<br />
1930<br />
1935<br />
1940<br />
1945<br />
1950<br />
1955<br />
1960<br />
1965<br />
1970<br />
1975<br />
1980<br />
1985<br />
1990<br />
1995<br />
2000<br />
2005<br />
2010<br />
2015<br />
YEARS<br />
FLUCTUATION OF WATER LEVELS IN THE<br />
WEST COAST BASIN<br />
Figure E
PLATES
Walnut Creek<br />
San Gabriel River<br />
§¨¦ 10 §¨¦ 110<br />
§¨¦ 710<br />
San Jose Creek<br />
§¨¦ 110 ÄÅ 60<br />
Rio Hondo<br />
§¨¦ 105 §¨¦ 405 §¨¦ 605 ÄÅ 22<br />
§¨¦ 5<br />
§¨¦ 710 ÄÅ 91 §¨¦ 5<br />
North Fork Coyote Cre<br />
Inglewood<br />
Fault<br />
e k<br />
Compton Creek<br />
San Gabriel River<br />
Uplift<br />
Dominguez Channel<br />
Carbon Creek<br />
Coyote Creek<br />
Los Angeles River<br />
Marina<br />
Del Rey<br />
Harbor<br />
Lake<br />
Alamitos<br />
Bay Marina<br />
§¨¦ 405<br />
Ballona C reek<br />
Santa<br />
Monica<br />
Bay<br />
PACIFIC<br />
OCEAN<br />
!(<br />
!( !(!(!(!(!(<br />
!(!(<br />
!( !( !( !(!(<br />
!( !( !(<br />
!( !( !(!(<br />
!( !(<br />
!(!(<br />
!(<br />
!( !(<br />
!(!(<br />
!( !( !( !(<br />
!( !(<br />
!(<br />
!( !(!( !(<br />
!(<br />
!(<br />
!(<br />
!( !( !(<br />
!(<br />
!( !(<br />
!(<br />
!( !( !(<br />
!(<br />
!( !(!( !(<br />
!( !( !( !(!(<br />
!(<br />
!( !( !(<br />
!( !(<br />
!(<br />
!(<br />
!(<br />
!(<br />
!(<br />
!(<br />
!(<br />
!(<br />
!( !( !( !(<br />
!(<br />
!(<br />
!( !(<br />
!( !(<br />
!(<br />
!(!(<br />
!(<br />
!( !(<br />
!( !( !(<br />
!( !(!(<br />
!(<br />
!( !(<br />
!(<br />
!(!(!( !(<br />
!( !(!(<br />
!(<br />
!( !( !(<br />
!(!(!(<br />
!( !(<br />
!( !(<br />
San Pedro<br />
Bay<br />
§¨¦ 405 §¨¦<br />
Newport<br />
!( !(<br />
!(<br />
!(<br />
!(<br />
!(!(<br />
!(<br />
!(<br />
!(<br />
!(<br />
!(<br />
!( !(<br />
!(<br />
!(<br />
!(<br />
!(<br />
!( !(<br />
!(!(<br />
!( !( !(!( !(<br />
!(!( !( !(<br />
!( !( !(<br />
!(!(<br />
!( !(<br />
!(<br />
!(<br />
!( !( !(<br />
!(<br />
!(<br />
!(<br />
!(!(<br />
!( !(<br />
!( !(!(<br />
!( !( !(!(!( !(<br />
!( !(<br />
!( !(<br />
!(<br />
!(<br />
!( !(<br />
!(<br />
!(!(<br />
!(<br />
!(!(!(!(<br />
!(!(<br />
!(!( !( !(!( !( !(<br />
!(<br />
!( !(<br />
!(<br />
!(!( !( !( !(<br />
!(<br />
!( !(<br />
!(<br />
!(<br />
!( !(!(!(!(<br />
!(<br />
!(<br />
!( !( !( !( !(<br />
!(!(!(!(!(!(!(!(!(<br />
!(<br />
!( !( !(<br />
!(<br />
!(<br />
!( !(<br />
!(<br />
!(<br />
!(<br />
!( !( !( !(<br />
!(<br />
!( !( !( !(<br />
!(<br />
!(<br />
!(<br />
!(<br />
!( !( !(<br />
!( !( !(!(!(<br />
!(!(!(<br />
!(<br />
!( !( !(!(!( !(<br />
!(<br />
!(<br />
!( !( !(<br />
!(<br />
!( !(<br />
!(<br />
!(<br />
!(<br />
!(<br />
!( !(<br />
!(<br />
!(<br />
!(<br />
!(<br />
!( !(<br />
!(<br />
!( !(!(!( !(<br />
!(<br />
!(<br />
!(<br />
!(<br />
!(<br />
!(<br />
!(<br />
!(<br />
!(!(<br />
!(!(!(!(!(<br />
!(<br />
!(<br />
!(<br />
®<br />
0 2 4<br />
Miles<br />
PLATE 1<br />
GROUNDWATER PRODUCTION<br />
WATER YEAR<br />
2010 - 2011<br />
LEGEND<br />
Groundwater Production (AF/Y)<br />
!( < 500 Acre Ft/Yr<br />
!(<br />
!(<br />
500 - 2,000 Acre Ft/Yr<br />
> 2,000 Acre Ft/Yr<br />
Data Source: WRD Production Database<br />
Barrier Injection Wells<br />
WRD Boundary<br />
Forebay<br />
Charnock
ROSEMEAD<br />
WEST COVINA<br />
SOUTH<br />
EL MONTE<br />
MONTEREY PARK<br />
WALNUT<br />
LA PUENTE<br />
MONTEBELLO<br />
CULVER CITY<br />
LOS ANGELES<br />
INDUSTRY<br />
VERNON<br />
COMMERCE<br />
WHITTIER<br />
HUNTINGTON<br />
PARK<br />
PICO<br />
RIVERA<br />
DIAM<br />
§¨¦ 10<br />
§¨¦ 710<br />
§¨¦ 405<br />
BELL<br />
BELL<br />
GARDENS<br />
CUDAHY<br />
LA HABRA HEIGHTS<br />
§¨¦ 110 ÄÅ 60<br />
170<br />
160<br />
150<br />
§¨¦ 10 §¨¦ 110<br />
A<br />
A<br />
2S/13W-10A01S<br />
Newport<br />
190<br />
130<br />
180<br />
110<br />
!H !><br />
A<br />
140<br />
A<br />
Charnock<br />
A<br />
!H<br />
A<br />
A<br />
-10<br />
-20<br />
0<br />
A<br />
!><br />
2S/11W-18K03S<br />
120<br />
100<br />
MAYWOOD<br />
-20<br />
A<br />
-30<br />
A<br />
!H<br />
80<br />
A<br />
A<br />
A<br />
-10<br />
2S/12W-24M03S<br />
90<br />
60<br />
-10<br />
A<br />
-30<br />
70<br />
50<br />
40<br />
A<br />
-20<br />
A<br />
§¨¦ 5<br />
SOUTH GATE<br />
INGLEWOOD<br />
A<br />
!H<br />
30<br />
DOWNEY<br />
A<br />
-30<br />
-40<br />
PLATE 2<br />
3S/12W-01A06S<br />
§¨¦ 710 ÄÅ 91 §¨¦ 5<br />
§¨¦ 105 §¨¦ 405 §¨¦ 605 ÄÅ 22<br />
A<br />
-40<br />
10<br />
SANTA FE<br />
SPRINGS<br />
0<br />
A<br />
20<br />
-50<br />
GROUNDWATER<br />
ELEVATION<br />
CONTOURS<br />
FALL 2011<br />
A<br />
10<br />
A<br />
A<br />
LYNWOOD<br />
-100<br />
HAWTHORNE<br />
NORWALK<br />
A<br />
Inglewood<br />
Fault<br />
-90<br />
A<br />
EL<br />
SEGUNDO<br />
LA MIR ADA<br />
PARAMOUNT<br />
COMPTON<br />
GARDENA<br />
3S/14W-22L01S<br />
BELLFLOWER<br />
A<br />
A<br />
-80<br />
!H<br />
LAWNDALE<br />
!><br />
MANHATTAN<br />
BEACH<br />
A<br />
-70<br />
LEGEND<br />
A<br />
-60<br />
A<br />
!><br />
ARTESIA<br />
Groundwater Elevation Contours<br />
10 ft. elevation<br />
CERRITOS<br />
Uplift<br />
HERMOSA<br />
BEACH<br />
A<br />
A<br />
LAKEWOOD<br />
A 4S/13W-12K01S<br />
A<br />
A<br />
A<br />
A<br />
-10<br />
-20<br />
Below seal level<br />
A<br />
A<br />
TORRANCE<br />
HAWAIIAN<br />
GARDENS<br />
!H<br />
-30<br />
-50<br />
A<br />
!><br />
REDONDO<br />
BEACH<br />
Sea level and above<br />
A<br />
CARSON<br />
A<br />
!>!><br />
-20<br />
A<br />
SIGNAL<br />
HILL<br />
!H<br />
A<br />
-40<br />
Key wells used for hydrographs<br />
(Figures B - E)<br />
!H<br />
-10<br />
4S/13W-21H05S<br />
A<br />
A<br />
!H<br />
A<br />
!><br />
LOMITA<br />
PALOS VERDES<br />
ESTATES<br />
Wells used for contouring:<br />
4S/12W-28H09S<br />
LONG BEACH<br />
A<br />
A<br />
!> Other Wells<br />
A<br />
A<br />
ROLLING<br />
HILLS ESTATES<br />
ROLLING<br />
HILLS<br />
A WRD Nested Wells<br />
RANCHO PALOS VERDES<br />
<strong>Water</strong> Level Data Source: Courtesy <strong>of</strong> Los Angeles Department <strong>of</strong><br />
Public Works and WRD Regional Groundwater Monitoring Program.<br />
§¨¦ 405<br />
®<br />
0 2 4<br />
LOS ANGELES<br />
Barrier Injection Wells<br />
WRD Boundary<br />
Forebay<br />
Miles
§¨¦ 10<br />
§¨¦ 710<br />
§¨¦ 405<br />
§¨¦ 10 §¨¦ 110<br />
§¨¦ 110 ÄÅ 60<br />
Newport<br />
§¨¦ 105 §¨¦ 405 §¨¦ 605 ÄÅ 22<br />
§¨¦ 5<br />
§¨¦ 710 ÄÅ 91 §¨¦ 5<br />
A<br />
A<br />
A<br />
A A<br />
A<br />
A A<br />
A<br />
A<br />
A<br />
A A<br />
A<br />
A<br />
A<br />
A<br />
A<br />
A<br />
A<br />
A<br />
A<br />
A A<br />
A<br />
A<br />
A A<br />
A A<br />
A<br />
A<br />
A A<br />
A<br />
A<br />
A<br />
A A<br />
A<br />
A<br />
A A A<br />
A<br />
A<br />
A<br />
A<br />
A<br />
Inglewood<br />
Fault<br />
A<br />
A<br />
Uplift<br />
§¨¦ 405<br />
Charnock<br />
A<br />
A<br />
A<br />
A<br />
A<br />
A<br />
A<br />
®<br />
0 2 4<br />
Miles<br />
PLATE 3<br />
CHANGES IN<br />
GROUNDWATER LEVELS<br />
FALL 2010 TO FALL 2011<br />
(Upper San Pedro Formation Aquifers)<br />
LEGEND<br />
Groundwater Level Changes:<br />
>90' Increase<br />
70' - 90' Increase<br />
50' - 70' Increase<br />
30' - 50' Increase<br />
20' - 30' Increase<br />
10' - 20' Increase<br />
1' - 10' Increase<br />
No Significant Change<br />
1' - 5' Decrease<br />
A<br />
Wells Used for Analysis<br />
Data Source: WRD Regional Groundwater Monitoring Program<br />
Barrier Injection Wells<br />
WRD Boundary<br />
Forebay
<strong>Water</strong> <strong>Replenishment</strong> <strong>District</strong><br />
<strong>of</strong> <strong>Southern</strong> <strong>California</strong><br />
4040 Paramount Boulevard<br />
Lakewood CA 90712<br />
(562) 921-5521 phone<br />
(562) 921-6101 fax<br />
www.wrd.org