Springboard 7, Unit 12, Section 1 Line graphs
Springboard 7, Unit 12, Section 1 Line graphs
Springboard 7, Unit 12, Section 1 Line graphs
- No tags were found...

Create successful ePaper yourself
Turn your PDF publications into a flip-book with our unique Google optimized e-Paper software.
UNIT<strong>12</strong> 1SUGGESTED TIMENOTES HANDLING FOR DATA THETEACHER3 hoursºTEACHING OBJECTIVES• Represent and interpret data in a line graph (for example, the weight of a baby atmonthly intervals from birth to one year).• Recognise when points can be joined to show trends.• Solve a problem by extracting and interpreting information presented in tables,<strong>graphs</strong> and charts.SECTION 1<strong>Line</strong> <strong>graphs</strong>SECTION 2Pie charts and bar chartsSECTION 3Information from tables and listsHOMEWORK• All of the Star Challenges can be used as follow-up activities.Key Stage 3 National Strategy© CROWN COPYRIGHT 2001PAGE390
UNIT<strong>12</strong>SECTION 1: LINE GRAPHSDIRECT TEACHING POINTS• Discuss the appropriateness of joining up the points on each of the <strong>graphs</strong>.Establish when intermediate points have meaning and when they do not.Discuss whether joining the points helps to show a trend.• In exercise 1, the intermediate points have meaning. Emphasise that they areestimates, not actual temperature readings, and that the estimate for 11.30 amis likely to be fairly good, while that for 5 pm is likely to be less accurate.• In exercise 2, intermediate points have no meaning, but joining the points mayhelp to see the pattern of sales.• In exercise 3, intermediate points have meaning and the graph can be extendedto read off further values.KEYVOCABUL ARYline graphintermediate pointsTOLEARUSEANDKey Stage 3 National Strategy© CROWN COPYRIGHT 2001PAGE392
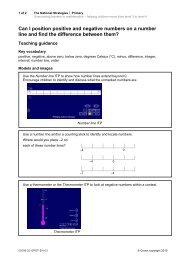
Key Stage 3 National StrategySPRINGBOARD 7PART 3 UNIT <strong>12</strong> SECTION 1UNIT<strong>Line</strong> <strong>graphs</strong><strong>12</strong>1The temperature graphPupils in a Year 7 class kept a record of the classroom temperature.The points on this graph have been joined with lines.The values between the plotted points are all estimates, not actual values.Estimates between two plotted points are usually more accurate thanvalues obtained by extending a graph.181614<strong>12</strong>Temperature ˚C10864209.00am10.00 11.00 <strong>12</strong>.00 1.00 2.00 3.00 4.00 5.00Timepm<strong>12</strong>34At what time was the first temperature taken? .........................At what time was the last temperature taken? ..........................What was the highest temperature recorded? ..........................˚CAt what time was the highest temperature recorded? ..........................Key Stage 3 National Strategy© CROWN COPYRIGHT 2001567What was the lowest temperature recorded? ..........................˚CWhat was the temperature at 11.00 am? ..........................˚C(a) Read the temperature at 11.30 am. ..........................˚C(b) Would this temperature be the actual temperature at 11.30 am, or anestimate? ..........................8Estimate the temperature at 5 pm. ..........................˚CPAGE393
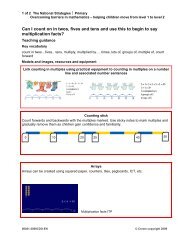
Key Stage 3 National StrategySPRINGBOARD 7PART 3 UNIT <strong>12</strong> SECTION 1UNIT<strong>12</strong><strong>Line</strong> <strong>graphs</strong>2The sales graphThis is the sales graph for a company which makes toys called ‘Whizzbangs’.Sales Graph9876Sales in thousands543210JanFeb Mar Apr May Jun Jul Aug SepMonths in Year 2000<strong>12</strong>3456How many months does the graph cover? .........................How many Whizzbangs were sold in April? ..........................How many Whizzbangs were sold in July? ..........................Which month had the lowest sales? ..........................Which month had the highest sales? ..........................Do points between the plotted points have a meaning? ............Explain your answer. ............................................................................................................................................................................................................................................................................................Key Stage 3 National Strategy© CROWN COPYRIGHT 20017Why might the sales be higher in summer?....................................................................................................................................................................................................................PAGE394
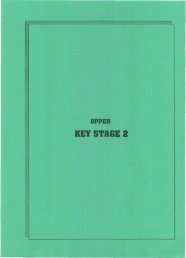
Key Stage 3 National StrategySPRINGBOARD 7PART 3 UNIT <strong>12</strong> SECTION 1UNIT<strong>Line</strong> <strong>graphs</strong><strong>12</strong>3The currency conversiongraphYou can use the values between the plotted points,and extend the graph to give you more values.1101009080Conversion graphFrench Francs < > Pounds (£)French Francs70605040302010002 4 6 8 10 <strong>12</strong>British Pounds (£)Molly wants to change her British money into French Francs.1How many francs would she get for £10? ..........................francsKey Stage 3 National Strategy© CROWN COPYRIGHT 200<strong>12</strong>34How many francs would she get for £6? ..........................francsWhat are 40 francs worth in £? £..........................What are 25 francs worth in £? £..........................56What is £1 worth in francs? ..........................francsCan you use the graph to work out what £100 is worth in francs?........................................................................................................PAGE395
UNIT<strong>12</strong>Key Stage 3 National StrategySPRINGBOARD 7PART 3 UNIT <strong>12</strong> 11 SECTION ANSWERS 1CHALLENGESTAR"1Car sales<strong>Line</strong> <strong>graphs</strong>Number ofcars soldCar sales200180160140<strong>12</strong>0100806040200Jan Feb Mar Apr May Jun Jul Aug Sep Oct Nov Dec1998 1998All correct 1 star<strong>12</strong>Which month had the lowest sales? ...........................Most cars were sold in the month when the car registration letter changed.Which month was that? ...........................34In which months were fewer than 40 cars sold? ...........................How many cars were sold in September? ...........................Number ofcars soldCar sales200180160140<strong>12</strong>0100806040200Jan Feb Mar Apr May Jun Jul Aug Sep Oct Nov Dec1999 19995678Which month had the lowest sales? ...........................In which months were more than <strong>12</strong>0 cars sold? ...........................The registration letter changed twice this year.In which two months did it change? ...........................Is it sensible to join the points on this graph? ...........................Key Stage 3 National Strategy© CROWN COPYRIGHT 2001Explain your answer. ..................................................................................................................................................................................................PAGE396
UNIT<strong>12</strong>SECTION 2: PIE CHARTS AND BAR GRAPHSSECTION 3: INFORMATION FROM TABLESAND LISTSDIRECT TEACHING POINTS• <strong>Section</strong> 2 exercises 1 and 2 are basic examples and are suitable for class orgroup discussion.• Work on bar charts is consolidated in Star Challenge 2.• Star Challenge 3 extends the work on pie charts to use simple fractions of acomplete circle.• You can also use topical examples drawn from newspapers and magazines.KEYTOVOCABUL ARYLEARUSEANDpie chart sector multiple bar charttable list informationKey Stage 3 National Strategy© CROWN COPYRIGHT 2001PAGE397
Key Stage 3 National StrategySPRINGBOARD 7PART 3 UNIT <strong>12</strong> SECTION 2UNIT<strong>12</strong>Pie charts and bar charts1The darts competition20Numberof wins16<strong>12</strong>84Sally Chip Roy Kaz Yusuf MegCompetitors<strong>12</strong>345How many matches did Sally win? .........................................................How many matches did Meg win? ..........................................................Who was the best player? ......................................................................Who was the worst player? ....................................................................How many matches were there? ............................................................Numberof wins2016<strong>12</strong>84Darts on targetDarts thrownSally Chip Roy Kaz Yusuf MegCompetitors678Roy had 14 throws. How many were on target? .....................................Who had the most misses? .....................................................................Who hit the target most often? ..............................................................Key Stage 3 National Strategy© CROWN COPYRIGHT 2001910Who had the least number of misses? ....................................................On this form, who do you think should win the final match? Give a reason why................................................................................................................PAGE398
Key Stage 3 National StrategySPRINGBOARD 7PART 3 UNIT <strong>12</strong> SECTION 2Pie charts and bar chartsUNIT<strong>12</strong>2Reading simple pie charts1PulpBlurTravisOasis<strong>12</strong> boys chose their favourite pop group.How many chose Pulp? .......................How many chose Blur? .......................How many chose Oasis? .......................2■▲My stamp collectionI have 300 stamps in my collection.How many ■ stamps do I have? .......................How many ▲ stamps do I have? .......................How many stamps do I have? ......................." 2All correct 1 starCHALLENGESTARTree plantingSix friends want to plant some trees at their school.They need to raise some money to buy the trees.AdiPeterKarenLornaErrolSalifAmounts of money raised so farKey Stage 3 National Strategy© CROWN COPYRIGHT 200110 1 2 3 4 5 6 7 8 9 10Amount in pounds (£)Who has raised the most money so far? ...............................234How much has Lorna raised? ................................................How much has Salif raised? ..................................................They need to raise £50 to buy the trees.How much more do they still need to raise? .........................PAGE399
Key Stage 3 National StrategySPRINGBOARD 7PART 3 UNIT <strong>12</strong> SECTION 2UNIT<strong>12</strong>Pie charts and bar chartsSTAR"3 Pie chartsCHALLENGEColour of cars in the car park10 correct 2 stars8-9 correct 1 starbluered90º45ºothers45ºwhite1There are 10 blue cars in the car park.(a) How many cars are white? .....................................(b) How many cars are red? .........................................(c) How many cars are there altogether? .....................(d) How many ‘others’ are there? ................................2The pie chart below shows where space explorers spent theirholidays in the solar system in 2392.30 explorers went to Earth.Complete the table, using the information in the pie chart.Venus Saturn<strong>12</strong>0º 90º60º90ºEarthMarsHoliday Angle Number ofdestinations on spacepie chart explorersEarth 60˚ 30MarsVenusSaturnKey Stage 3 National Strategy© CROWN COPYRIGHT 2001Holiday destinationsPAGE400
Key Stage 3 National StrategySPRINGBOARD 7PART 3 UNIT <strong>12</strong> SECTION 3Information fromtables and listsUNIT<strong>12</strong>1Household goodsOwn Rent Video Microwave Dishwasher Computer Mobilea TV a TV Recorder Cooker PhoneSmith 2 1 1 3Brown 1 1 1Kuri 1 1 1 1Green 2 1 2 1 2 2Ono 1 1 1 1 1<strong>12</strong>345678910How many of these families own a dishwasher? .....................................How many of these families own a video recorder? .................................How many of these household goods has the Kuri family? ......................Which family has the least number of these goods? ................................How many families own a TV? ................................................................How many of these families rent or own a TV? .......................................How many TVs do these families have altogether? ..................................How many families have a computer? ....................................................Which two families do not have a mobile phone? ...................................Which family has a dishwasher but no microwave? ................................2Fly to the USATravel CheapNew York £202Miami £262Washington £219Los Angeles £270WandererChicago £227Los Angeles £275Washington £235New York £207Out of this WorldMiami £249New York £215Washington £215Chicago £223Cheapest and BestChicago £218New York £207Los Angeles £230Washington £222Key Stage 3 National Strategy© CROWN COPYRIGHT 2001<strong>12</strong>3What does it cost to fly to New York with ‘Wanderer’? .........................What does it cost to fly to Los Angeles with ‘Travel Cheap’? .........................Which company does not give a price to fly to Los Angeles? .........................How much is the cheapest flight to:4 New York? ................. 5 Chicago? ............... 6 Miami? ..................Which company offers the cheapest flight to:7 Los Angeles? .................... 8 Washington? ...........................................PAGE401
Key Stage 3 National StrategySPRINGBOARD 7PART 3 UNIT <strong>12</strong> SECTION 3UNIT<strong>12</strong>Information fromtables and listsCHALLENGESTAR"4Yesterday’s weatheraround the world9-10 correct 1 starMaxWeather Temp (˚C)Ajaccio (Corsica) S 17Athens (Greece) R 17Beijing (China) Sh 14Berlin (Germany) Th 15Boston (USA) Cl 6Cairo (Egypt) Cl 20Dallas (USA) S 27Dublin (Ireland) R 8MaxWeather Temp (˚C)Helsinki (Finland) Cl 15Hong Kong (China) F 28Istanbul (Turkey) Cl 17Lima (Peru) F 19Lisbon (Portugal) F 17Madrid (Spain) Cl 16New York (USA) R 8Paris (France) Th 13Th thundery S sunny F fair Sh showery R rain Cl cloudy<strong>12</strong>34567What was the maximum temperature in Athens? .....................................What was the maximum temperature in Dallas? .....................................Which place was warmer, Helsinki or Madrid? .....................................What was the weather in New York? .....................................Which was hotter, Cairo or Madrid? .....................................Which place had the highest temperature? .....................................Name two places that had amaximum temperature of 8˚C. ....................... ...........................8910Which two places had thundery weather? ...................... ...........................Which place was the coldest? .....................................Three places had rainy weather.Which of these three was the warmest? ....................................Key Stage 3 National Strategy© CROWN COPYRIGHT 2001PAGE402
Key Stage 3 National StrategySPRINGBOARD 7PART 3 UNIT <strong>12</strong> SECTION 3Information fromtables and listsUNIT<strong>12</strong>CHALLENGESTAR"5The castle visitAll correct 1 starPeckforton CastleCost per personAdults £3.50Children £1.20(11 and over)Children75p(under 11)Visit the haunted room and meetthe ghost.20p per adult10p per child1Sara is twelve years old. How much will it cost Sara to visit the castle?............................................................................................................2Asif and Vikram are nine and ten years old. They are going to the castlewith their mother. How much will it cost for all three of them to get intothe castle?............................................................................................................Key Stage 3 National Strategy© CROWN COPYRIGHT 200134Ten children (all under 11) and two teachers are going to visit the castle.How much will it cost?............................................................................................................Mr and Mrs Young, Luke (<strong>12</strong>), Joanne (9) and Connor (4) visited the castle,and also went into the haunted room. What was the total cost of their visit?............................................................................................................PAGE403
Key Stage 3 National StrategySPRINGBOARD 7PART 3 UNIT <strong>12</strong> ANSWERSUNIT<strong>12</strong><strong>Unit</strong> <strong>12</strong>Answers<strong>Section</strong> 1<strong>Line</strong> <strong>graphs</strong>1The temperature graph1 9.00 am 3 16˚C 5 8˚C 7 (a) 13˚C (b) estimate2 4.00 pm 4 1.00 pm 6 11˚C 8 11˚C2The sales graph<strong>12</strong>39 months 4 March5000 5 May550067No. There are no dates between eachof the months on the graph, so youcannot have sales figures for them.Summer toy (or other valid reason).3The currency conversion graph1 100 francs 3 £4 5 10 francs2 60 francs 4 £2.50 6 Yes, 1000 francs<strong>Section</strong> 2Pie charts and bar charts1The darts competition<strong>12</strong>10 3 Roy 5 60 7 Yusuf 9 Roy4 4 Meg 6 <strong>12</strong> 8 Chip 10Roy. He gets the greatestproportion of shots on target.2Reading simple pie charts16, 2, 2 2 150, 50, 100<strong>Section</strong> 31Information from tables and listsHousehold goods1 2 3 4 5 4 7 9 9 Brown, KuriKey Stage 3 National Strategy© CROWN COPYRIGHT 200<strong>12</strong>3 4 Brown 6 5 8 4 10 Ono2Fly to the USA1£207 3 Out of this World 5 £218 7 Cheapest and Best2£270 4 £202 6 £249 8 Out of this WorldPAGE404
Key Stage 3 National StrategySPRINGBOARD 7PART 3 UNIT <strong>12</strong> ANSWERS<strong>Unit</strong> <strong>12</strong>AnswersUNIT<strong>12</strong>Star Challenge answersKey Stage 3 National Strategy© CROWN COPYRIGHT 2001STARSTARSTARCHALLENGESTARSTAR"CHALLENGE"CHALLENGE"CHALLENGE""CHALLENGE<strong>12</strong>345Car sales<strong>12</strong>34JulyAugustFeb, June, July, DecFebruaryMarch, April, SeptemberMarch, September150 8 No. The points between have no meaning.Tree planting<strong>12</strong>Adi 3 £5£4 4 £10Pie charts<strong>12</strong>(a) 5 (b) 20 (c) 40 (d) 590˚ 45<strong>12</strong>0˚ 6090˚ 45Yesterday’s weather around the world<strong>12</strong>34517˚27˚MadridRainCairoThe castle visit<strong>12</strong>10Hong KongDublin and New YorkBerlin and ParisBostonAthens£1.20 3 £14.50£5.00 4 £10.406789567All correct 1 starAll correct 1 star10 correct 2 stars8-9 correct 1 star9-10 correct 1 starAll correct 1 starPAGE405