- Page 2:
Welcome to the online abstract book
- Page 6:
Ane Alencar Poster Ecosystem degrad
- Page 12:
Deborah Clark Oral Carbon Budgets a
- Page 16:
Gannabathula Prasad OralMeso-scale
- Page 20:
John Roads Oral Hydrologic Cycle in
- Page 24:
Luciana Valente Oral River water as
- Page 28:
Mauricio Bolzan Poster Meso-scale p
- Page 32:
Plinio Alvala Oral Carbon Budgets a
- Page 36:
Samuel Almeida Poster C Sequestrati
- Page 40:
Vanusa Pachêco Poster Carbon Budge
- Page 44:
Eric Smith NASA/GSFC Poster Space-t
- Page 48:
Surface Water Dynamics in the Amazo
- Page 52:
Standardized remote sensing methodo
- Page 56:
Monitoring The Spatial And Temporal
- Page 60:
Vegetation Types of Amazon Basin fr
- Page 64:
EOS-WEBSTER - NEW Satellite Imagery
- Page 68:
Large Area Mapping in Rondônia usi
- Page 72:
Carbon emissions from Land Cover Ch
- Page 78:
The Contribution of Selective Loggi
- Page 82:
Space-time Controls on Carbon Seque
- Page 86:
IKONOS Imagery for Large-scale Bios
- Page 90:
Agricultural land use in 2000-2001
- Page 94:
Some Results from the 2000 P and X
- Page 98:
Estimate of net primary production
- Page 102:
Discriminating Land Cover Types and
- Page 106:
Satellite observations of inter-ann
- Page 110:
Oscar VegaInstituto de PesquisasEne
- Page 114:
On the local and global effects of
- Page 120:
Aerosols and Clouds in Amazonia: Dy
- Page 124:
mechanisms involving ice particles,
- Page 128:
Abstract submitted for presentation
- Page 132: Microscopic images of atmospheric a
- Page 136: Atmospheric Attenuation Of Total So
- Page 140: Effect of smoke aerosol particles f
- Page 144: Comparison of Rainwater composition
- Page 148: George VourlitisHudson SilvaCalifor
- Page 152: Sérgio de PauloTim BakerUniversida
- Page 156: Long-term data indicate a strong ne
- Page 160: Atmospheric boundary layer measurem
- Page 164: 10 . Richey, J. E., Melack, J. M.,
- Page 168: Carbon Release from Stems and Branc
- Page 172: Estimation of Amazon night-time CO
- Page 176: using block kriging. Data were over
- Page 180: FOREST CANOPY-TROPOSPHERE CO 2 AND
- Page 186: Seasonality of Stem Respiration at
- Page 192: The role of seasonal variations in
- Page 196: Oxygen isotope ratio of CO 2 in for
- Page 200: ESTIMATION OF LEAF AREA INDEX USING
- Page 204: An attempt to model Manaus k34, k14
- Page 210: LEAF AREA INDEX MEASUREMENTS AT CAX
- Page 214: Modeling Net Ecosystem Exchange fro
- Page 218: Estimating above ground biomass in
- Page 222: THE USE OF A FOOTPRINT MODEL TO ANA
- Page 226: MODELLING FLUXES FROM AMAZONIAN RAI
- Page 230: Submitted to: IISCLBA - 2 ND SCIENT
- Page 234:
ASSESSING THE CHANGE FROM PASTURE T
- Page 238:
Toward Mapping Spatial Distribution
- Page 242:
Carbon balance and seasonal pattern
- Page 246:
Climatic and edaphic control of reg
- Page 250:
Study of the mean wind speed profil
- Page 254:
An analytical approach for estimati
- Page 258:
Leland PierceLiane GuildLívia Vasc
- Page 262:
Respiration from a Tropical Forest
- Page 266:
The Net Carbon Flux Due to Deforest
- Page 270:
Autotrophic X heterotrophic respira
- Page 274:
Submitted to: II_ISC_LBA - 2 ND INT
- Page 278:
Fine root dynamics from radiocarbon
- Page 282:
SEASONAL CHANGES IN LEAF LITTER NUT
- Page 286:
Variability of Soil Microbial Bioma
- Page 290:
composite. We can also use several
- Page 294:
Soil microbial biomass and respirat
- Page 298:
Tree ring studies to estimate carbo
- Page 302:
Litter decomposition rate estimatio
- Page 306:
cardinot@amazon.com.britohver@yahoo
- Page 310:
VARIABILITY OF SOIL RESPIRATION OVE
- Page 314:
Fine litter fall and standing tree
- Page 318:
LATERAL VARIATIONS IN THE CHEMICAL
- Page 322:
Isotopic Signature of Nitrous Oxide
- Page 326:
Ecosystem degradation due to fire &
- Page 330:
AbstractMulti-temporal Analysis of
- Page 334:
ABSTRACT - Second International LBA
- Page 338:
Mapping Biomass Loss from Forest Fi
- Page 342:
Spatial and Temporal Drivers of Fir
- Page 346:
A new method to detect forest fire
- Page 350:
Forest Canopy Damage from Selective
- Page 354:
AcknowledgementsSupport of this res
- Page 358:
Carbon Storage in Soils from Degrad
- Page 362:
An improved soil water budget model
- Page 366:
PATTERNS OF TREE MORTALITY IN FORES
- Page 370:
RAIN WATER INTERCEPTION BY SELECTIV
- Page 374:
PREDICTING EDGE-DRIVEN CARBON EMISS
- Page 378:
Rafael FERREIRA daCOSTAMPEG Poster
- Page 382:
An experiment with the Eta/SSiB mod
- Page 386:
Amazonian forest die-back in the Ha
- Page 390:
Simulations of South American hydro
- Page 394:
Poster title: Global teleconnection
- Page 398:
Contrasting conditions of atmospher
- Page 402:
1) Drought in an E. Amazonian rain
- Page 406:
3) Drought in an E. Amazonian rain
- Page 410:
The influence of land surface winds
- Page 416:
Water use efficiency increases in r
- Page 420:
René Poccard-ChapuisCIRAD-Ecopol -
- Page 424:
1Session: Human Dimension, of Globa
- Page 428:
Population, Economy and Land Use in
- Page 432:
Poster Abstract: A Conceptual Model
- Page 436:
Carbon as an economic strategy to r
- Page 440:
THE ECONOMIC COSTS OF FIRE IN THE B
- Page 444:
MICROPEDOLOGY OF THE ARCHEOLOGICAL
- Page 448:
2 nd International LBA Scientific C
- Page 452:
Reliability of low-cost GPS data fo
- Page 456:
devastation has not yet reached a a
- Page 460:
Luz Adriana Cuartas-Pineda INPA Pos
- Page 464:
1Measurements and Modeling of Water
- Page 468:
Seasonality of water and heat fluxe
- Page 472:
Feasibility of Using Topex/Poseidon
- Page 476:
Modeling the effects of hydrogeolog
- Page 480:
Seasonal variations of soil moistur
- Page 484:
Estimating Actual Evapotranspiratio
- Page 488:
TDR triple-wire probes calibration
- Page 492:
Processes of streamflow generation
- Page 496:
CALIBRATION OF THE CAMPBELL CS-615
- Page 500:
Flooding Regime Characterization wi
- Page 504:
Aline ProcopioGEPA - Instituto deFi
- Page 508:
Luis Marcelo Mattos Zeri LMO/CPTEC/
- Page 512:
Scott DenningColorado StateUniversi
- Page 516:
Boundary-layer moisture regimes dur
- Page 520:
SCALING PROPERTIES OF EXTREME VALUE
- Page 524:
A Large Eddy Simulation (LES) of th
- Page 528:
1Deforestation Impact in Eastern Am
- Page 532:
THE UPPER LEVEL WIND DIVERGENCE THE
- Page 536:
Variability of the ones of extreme
- Page 540:
SOME CHARACTERISTICS OF THE TEMPORA
- Page 544:
Modeling the fine-scale turbulence
- Page 548:
Evidence of non-existence of a "spe
- Page 552:
The modification of the ABL structu
- Page 556:
The intercomparison of radiosonde s
- Page 560:
MODELLING OF THE ATMOSPHERIC TRANSP
- Page 564:
THE DEEP CONVECTION THROUGH THE CAP
- Page 568:
Thermal and Hydric Behavior of Soil
- Page 572:
EVALUATION OF SIMULATIONS OF Eta RE
- Page 576:
Coherent structures observed immedi
- Page 580:
THE DIURNAL MARCH OF THE CONVECTION
- Page 584:
MICROPHYSICAL CHARACTERISTICS OF A
- Page 588:
Dynamic and Synoptic Features of a
- Page 592:
Evidence of non-existence of a "spe
- Page 596:
Modeling the fine-scale turbulence
- Page 600:
ENVIROMENTAL CONDITIONS DURING A FR
- Page 604:
TEMPORAL EVOLUTION OF Z-R RELATIONS
- Page 608:
Rationalizing Burned Carbon with Ca
- Page 612:
Statistical Evaluation of the Wet S
- Page 616:
Atmospheric Responses to Land and W
- Page 620:
Janaina Braga Carmo CENA/ESALQ Post
- Page 624:
Co-limitation by nitrogen and phosp
- Page 628:
Nutrient dynamics through litterfal
- Page 632:
Effects of different pasture manage
- Page 636:
Phosphorus fractions in earthworm c
- Page 642:
Mechanisms of conservation and cycl
- Page 646:
Can traditional agroforestry practi
- Page 650:
Nitrogen cycling in termite mounds
- Page 654:
ALTERATIONS TO NITRATE AND AMONIUM
- Page 658:
Organic nutrients in throughfall an
- Page 662:
Columbrina glandulosa is stoing hig
- Page 666:
Modeling regional soil patterns bas
- Page 670:
Wood, soil-macrofauna and nutrients
- Page 674:
CHEMICAL COMPOSITION OF THE SOILWAT
- Page 678:
Assessment of biophysical and bioge
- Page 682:
The Quaternary Climate of AmazoniaP
- Page 686:
50,000 year record of vegetation an
- Page 690:
NEW EVIDENCE OF QUATERNARY LANDSCAP
- Page 694:
River water as a medium for transpo
- Page 698:
Organic and inorganic carbon dynami
- Page 702:
Control of stream water cations by
- Page 706:
Project:Title:Authors:LBA-CARBONSIN
- Page 712:
Transport of Particulate Carbon and
- Page 716:
Dynamic of Gran Sabana forest-savan
- Page 720:
Submitted to: II_ISC_LBA - 2 ND INT
- Page 724:
Influence of land use in aquatic me
- Page 728:
CHEMICAL COMPOSITION OF SOIL SOLUTI
- Page 732:
Water surface and river bottom long
- Page 736:
CHANGES TO INORGANIC NITROGEN IN SO
- Page 740:
Scenarios of land use change: what
- Page 744:
DEFORESTATION TRAJECTORIES IN A FRO
- Page 748:
community-based decisions for the r
- Page 752:
ABSTRACTWHO ARE THE AGENTS OF DEFOR
- Page 756:
CAUSAL MODELING OF AMAZONIAN DEFORE
- Page 760:
Deforestation Patterns and Househol
- Page 764:
Riverine Agriculture of the Peruvia
- Page 768:
Spatial diffusion of deforestation
- Page 772:
Land Use Patterns in the Brazilian
- Page 776:
Structure of Microbial Communities
- Page 780:
Priority Areas for Establishing Nat
- Page 784:
Trace gas evolution with landuse gr
- Page 788:
Impact of land cover and land use c
- Page 792:
Soil trace gas emissions influenced
- Page 796:
Emissions of CO 2 , CH 4 , N 2 O, a
- Page 800:
NO x and CO emissions from soil and
- Page 804:
Methane dynamics in undisturbed for
- Page 808:
ut soil temperature was not. Absenc
- Page 812:
Influence of Amazônia Land-use Cha
- Page 816:
ISOPRENOID FLUXES AND PHOTOSYNTHETI
- Page 820:
Concentration profiles of volatile
- Page 824:
Abstract submitted for presentation
- Page 828:
The meteorological conditions durin
- Page 832:
THE INFLUENCE OF FLOODING ON THE EX
- Page 836:
Vegetation Dynamics in a Changing E
- Page 840:
Moisture stress constrains carbon f
- Page 844:
The El Niño / Southern Oscillation
- Page 848:
BIOMASS DYNAMICS OF AMAZONIAN FORES
- Page 852:
Classifying Successional Forests Us
- Page 856:
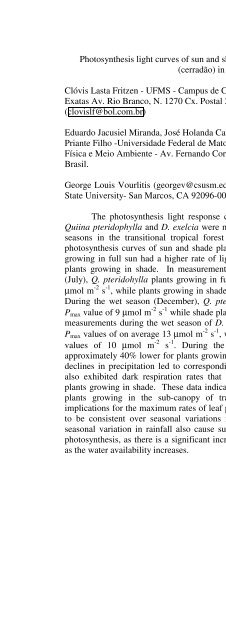
Light Response Curves of three plan
- Page 860:
THE MESOSCALE EDGE EFFECT IN CENTRA
- Page 864:
FLORÍSTICA DE UM SUB-BOSQUE DE FLO
- Page 868:
CO 2 AND ENERGY FLUXES IN AN AMAZON
- Page 872:
Título:Mapeando a inflamabilidade
- Page 876:
Forest Fragmentation, Biomass Colla
- Page 880:
Experiments with legume mulch appli
- Page 884:
Transpiration before and after Burn