Single Sourcing and Content Management - Technical ...
Single Sourcing and Content Management - Technical ...
Single Sourcing and Content Management - Technical ...

Create successful ePaper yourself
Turn your PDF publications into a flip-book with our unique Google optimized e-Paper software.
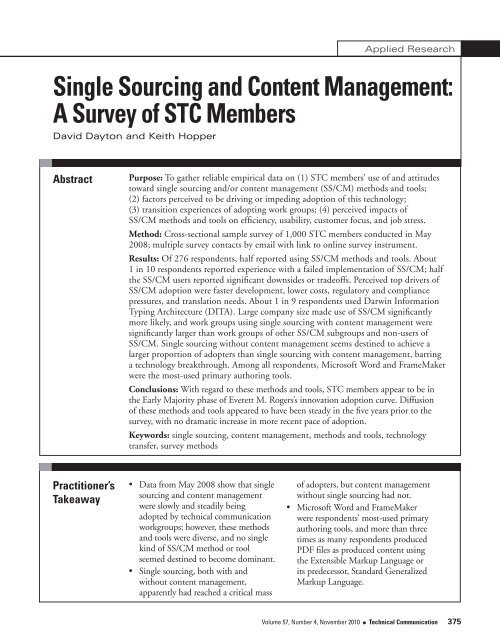
Applied Research<strong>Single</strong> <strong>Sourcing</strong> <strong>and</strong> <strong>Content</strong> <strong>Management</strong>(IRB) for the Protection of Human Participants atTowson University in Maryl<strong>and</strong>.Based on several formal interviews <strong>and</strong> someinformal conversations with technical communicatorsabout single sourcing <strong>and</strong> content management methods<strong>and</strong> tools, Dayton revised the survey <strong>and</strong> solicitedreviews of the new draft from three practitioners withexpertise in the subject matter <strong>and</strong> from an academicwith expertise in survey research. Dayton again revisedthe survey in response to those reviewers’ suggestions.Hopper then converted the survey into an interactiveWeb-delivered questionnaire using Zoomerang (acopy of the survey that does not collect data may beexplored freely at http://www.zoomerang.com/Survey/WEB22B38UWBJKZ).Moving the survey from a page-based format tomulti-screen Web forms proved challenging. Multiplebranching points in the sequence of questions createdfive primary paths through the survey: no SS/CM, SSonly, CM only, SSwCM, <strong>and</strong> academics. Respondentsnot using SS or CM were presented with 20 or 21questions depending on whether their work group hadconsidered switching to SS/CM methods <strong>and</strong> tools.Respondents in the three subgroups of SS/CM werepresented with 30 to 33 questions, depending on theiranswers to certain ones. The version of the survey foracademics contained 24 questions, but we ultimatelydecided to leave academics out of the sampling framefor reasons explained later.For all paths through the survey, question typesincluded choose one, choose all that apply, <strong>and</strong> openended. All fixed choice questions included a final answerchoice of “Other, please specify” followed by a spacefor typing an open-ended answer. The first completedraft of the Web-based survey was pilot tested byabout 30 participants, which included practitioners,graduate students, <strong>and</strong> academics. The reported timesfor completing the survey ranged from less than 8 to25 minutes. Testers who went through the path foracademics <strong>and</strong> the path for those not using SS or CMreported the fastest completion times <strong>and</strong> offered thefewest suggestions. Testers answering the questions forthose using SS/CM suggested some improvements inwording, formatting, <strong>and</strong> answer options, most of whichwe agreed with <strong>and</strong> made changes to address.Deployment of the SurveyThe version of the survey for academics was entirelydifferent from the four variations for practitioners.Following the pilot test, we reassessed the pros <strong>and</strong>cons of fielding two surveys at the same time. We wereparticularly concerned that the number of academicrespondents would be quite small unless we drew aseparate sample of only academic members. After theSTC Marketing Manager assured us that academicscould be filtered from the membership database beforedrawing a sample, we decided to limit the samplingframe to practitioners. (The sampling frame is the totalpopulation of people from whom the r<strong>and</strong>om sample isdrawn.)The sampling frame consisted of about 13,500STC members, about 3,000 fewer than the totalmembership at that time (May 2008). In addition toexcluding academics, students, <strong>and</strong> retirees, the STCMarketing Manager also excluded STC members whohad opted not to receive messages from third-partyvendors. From the sampling frame of about 13,500members, the STC Marketing Manager drew a r<strong>and</strong>omsample of 1,000 using an automated function for thatpurpose available in the STC office’s membershipdatabase application.Over 11 days, the Marketing Manager e-mailed tothe sample four messages that we composed. The firste-mail went out on a Thursday: a brief message fromSTC President Linda Oestreich describing the survey<strong>and</strong> encouraging participation. The second e-mailwas sent the following Tuesday, signed by us, invitingrecipients to take the survey <strong>and</strong> providing a link to theconsent form. (Researchers working for federally fundedinstitutions are required by law to obtain the informedconsent of anyone asked to participate in a researchstudy.) Respondents accessed the survey by clicking thelink at the bottom of the consent form. (Appendix Ccontains copies of the two e-mails mentioned above <strong>and</strong>the consent form.)The Internet server housing the survey wasconfigured to prohibit multiple submissions from thesame computer. When a respondent completed thesurvey by clicking the Submit button on the final screen,a confirmation page displayed our thank-you message<strong>and</strong> offered respondents the option of e-mailing the378 <strong>Technical</strong> Communication ● Volume 57, Number 4, November 2010
Applied Research<strong>Single</strong> <strong>Sourcing</strong> <strong>and</strong> <strong>Content</strong> <strong>Management</strong>Four of Five Were Regular Employees; Half Workedin High-techThe group profile of our 276 respondents in termsof employment status <strong>and</strong> industry seems typical ofthe STC membership before the current economicrecession: 81% were regular employees; 18% werecontractors, consultants, freelancers, or businessowners; <strong>and</strong> 2% were unemployed. Respondentsworked for a wide range of industries, though alittle more than half worked in industries commonlyclustered under the rubric “high-technology”:companies making or providing software, computer<strong>and</strong> networking hardware, software <strong>and</strong> IT services,<strong>and</strong> telecommunications products <strong>and</strong> services.Slightly More Than Half Worked in Large CompaniesWe asked respondents to categorize the size of thecompany they worked at. Table 1 shows that therange of company sizes was weighted slightly (55%)toward companies with more than 500 employees,<strong>and</strong> the largest category proportionately is 10,000or more employees, with 25%. (The Small BusinessAdministration most often uses 500 employees asthe maximum size company allowed to access itsprograms.) Table 1 includes Census Bureau data forthe entire U.S. economy in 2004 as comparative data.Table 1. Company Size Reported by Respondents Comparedwith 2004 U.S. Census DataCompany Size% of 276 STCrespondents% of U.S. CensusData 2004*1 to 4 7% 5%5 to 9 2% 6%10 to 19 2% 7%20 to 99 14% 18%100 to 499 21% 15%500 to 999 7% 5%1,000 to 9,999 22% 18%10,000 or more 25% 26%*Source: Statistics about Business Size (including Small Business) from theU.S. Census Bureau, Table 2a. Employment Size of Employer <strong>and</strong> NonemployerFirms, 2004. Accessed August 16, 2009, at http://www.census.gov/epcd/www/smallbus.htmlFigure 1. Use of SS/CM by 276 Survey RespondentsHalf Used SS Only, CM Only, or SS With CM—<strong>and</strong>Half Used No SS/CMOf the 276 respondents, 139 (50%) reported that theydid not use SS/CM methods <strong>and</strong> tools, <strong>and</strong> 137 (50%)reported that they did (see Figure 1). In the SS/CMgroup, SSwCM users were the most numerous (55, or20% of all respondents), followed by SS only (47,17%) <strong>and</strong> CM only (35, 13%).As Figure 2 shows, about two-thirds of SS/CMusers reported that their work groups produced morethan half their output using SS/CM methods <strong>and</strong> tools.One in five, however, reported that their work groupused SS/CM to produce 25% or less of their output, afinding consistent with the data collected on recentnessof SS/CM adoption <strong>and</strong> the average time reported forreaching certain benchmarks for proportion of totaloutput using SS/CM methods <strong>and</strong> tools. (Those resultsare reported in subsequent tables <strong>and</strong> figures.)Figure 2. Proportion of Total Information Product OutputUsing SS/CM380 <strong>Technical</strong> Communication ● Volume 57, Number 4, November 2010
Applied ResearchDayton <strong>and</strong> HopperAbout 1 in 4 Used XML <strong>and</strong>/or SGML; About 1 in 9Used DITAAll 276 respondents answered a question asking themto identify the types of information products theirwork groups produced. Seventy-six (28%) checked theanswer “content developed using XML or SGML.”Respondents using SS/CM (n = 137) were presentedwith another question asking them to indicate if theirwork group used XML <strong>and</strong>/or SGML. Figure 3 graphsthe results from that question, showing that abouthalf the SS/CM respondents produced content usingXML <strong>and</strong>/or SGML. Three out of four in that groupof SS/CM users indicated their work group’s systemused XML alone, while most of the others indicated asystem using both XML <strong>and</strong> SGML.Another question presented to SS/CM respondentsasked them to indicate which, if any, documentationst<strong>and</strong>ard their work group used. About 2 of 3 SS/CMrespondents (64%) reported that their work groupused no st<strong>and</strong>ard. About 1 in 5 (21%) indicated thatthey used DITA, <strong>and</strong> one person used both DITA <strong>and</strong>DocBook. The 30 DITA-using respondents, then, were11% of all survey respondents, or 1 in 9.About 1 in 10 Reported a Failed SS/CM ImplementationTwenty-four respondents (9% of N = 276) reportedthat they had been part of a work group whoseFigure 3. Use of XML <strong>and</strong> SGML by 137 SS/CM Respondentsattempt to implement an SS/CM system had failed.Seven indicated that a CM system was involved, <strong>and</strong>six wrote that it was the wrong tool for their workgroup, citing one or more reasons. Three respondentsindicated that an SS tool had failed, two saying thatthe SS tool had not performed to expectations <strong>and</strong> thethird saying that lack of management support led tofailure of the project. Fourteen respondents did notspecify which type of tool was involved in the failedproject, <strong>and</strong> for this subgroup no single reason for thefailure predominated. Poor fit, difficulty, <strong>and</strong> cost werethe main reasons cited for the failed implementations.Almost Half the SS/CM Work Groups Had Used TheirSystem for Two Years or LessThe survey asked those using SS/CM how long agotheir work group had started using their current SS/CMsystem. Figure 4 shows that 45% of the SS/CM users’work groups had been using their SS/CM system for lessthan two years, <strong>and</strong> 24% had been using their systemfor less than a year. When asked how long the workgroup had researched options before deciding on itsSS/CM system, 103 respondents provided an estimatein months. Setting aside an outlier (40 months), therange of answers was 0 to 24 months, with a medianof 4, a mean of 6.04, <strong>and</strong> a st<strong>and</strong>ard deviation of 6.03(see Table 2).The survey also asked SS/CMusers to estimate how long (inmonths) it took their work group toreach the point of producing 25%of their information products usingtheir SS/CM system. Estimates(n = 97 valid) ranged from 0 to28 months, with a median of 4months, a mean of 6.4, <strong>and</strong> ast<strong>and</strong>ard deviation of 6.25. Ofthe 137 respondents using SS/CM, 55% reported that theirwork group had completed theirSS/CM implementation; 45%reported that their group was stillworking to complete their SS/CMimplementation (however theydefined that milestone, which isVolume 57, Number 4, November 2010 ● <strong>Technical</strong> Communication 381
Applied Research<strong>Single</strong> <strong>Sourcing</strong> <strong>and</strong> <strong>Content</strong> <strong>Management</strong>mind, we observe that the data in Table 2 are consistentwith what we know about human nature: those lookingahead to completion of SS/CM implementation tendedto see the process taking somewhat longer than thoselooking back in time.Figure 4. How Long Ago Did Work Group Begin Using SS/CMSystem?not usually defined as 100% of information productionoutput, as shown in Figure 2). Table 2 reveals that theaverage time it takes a work group to implement anSS/CM system seems reasonable: most work groupsadopting SS/CM systems complete their implementationin well under a year. However, some work groupsexperience very long implementation times.Caution must be exercised in comparing estimatesby those working toward completion of SS/CMimplementation with the historical estimates bythose looking back at that completed milestone. Forthose in the “not done” group, we do not know howlong SS/CM projects had been underway when theyestimated how long it would be before their work groupcompleted its implementation. With that caveat inSS/CM Respondents Reported Many Activities toPrepare for TransitionThe survey asked SS/CM users what activities theirwork group engaged in to help them make thetransition to SS/CM, <strong>and</strong> 83% in the SS/CM groupprovided answers. Figure 5 shows that SS/CM workgroups engaged in a wide range of research <strong>and</strong>professional development activities to pave the way foradoption <strong>and</strong> implementation of SS/CM systems. Aswe would expect, about half of the work sites gatheredinformation from vendor Web sites. The next mostmentioned activity was trying out the product, which37% said their work group did. Only slightly fewer(31%) indicated that members of their work groupattended conferences <strong>and</strong> workshops to learn moreabout SS/CM systems. About 1 in 4 (23%) indicatedthat their work group hired a consultant to help themmake the transition.Top Drivers: Faster Development, Lower Costs,Regulatory <strong>and</strong> Compliance Pressures, TranslationNeedsOn one question, the 137 SS/CM users indicatedwhich listed business goals influenced the decision toadopt the SS/CM system their work group used. TheTable 2. Estimated Months to Research Options, to Reach 25% Production with SS/CM, <strong>and</strong> to Complete the ImplementationProcessMeasures of centraltendencyMonths duringwhich work groupresearched SS/CMoptionsn = 103 validMonths before workgroup produced 25%of its output withSS/CMn = 97 validMonths it took tocomplete SS/CMimplementation(historical)n = 56 validMonths it will taketo completeimplementation(projection)n = 49 validMedian 4 4 6 10.5Mean 6.1 6.4 7.9 10.7SD 5.96 6.25 7.07 7.95Range 0 to 24 0 to 28 0 to 28 0 to 24382 <strong>Technical</strong> Communication ● Volume 57, Number 4, November 2010
Applied ResearchDayton <strong>and</strong> Hopper* n = 114 due to item nonresponse, but percentages shown are based on n = 137, which is totalof SS/CM respondentsFigure 5. Transition to SS/CM Activities Reported by SS/CM Respondentsnext question asked them to select the business goalthat was the most important driver of the decision toadopt the SS/CM system. Figure 6 charts the resultsfrom these related questions. On the “choose all thatapply” question, the business goal most often selectedwas providing st<strong>and</strong>ardization <strong>and</strong> consistency (73%).Three other business goals were indicated as influentialby more than half of the SS/CMgroup: speeding up development(57%), lowering costs (56%), <strong>and</strong>providing more usable <strong>and</strong> usefulinformation products (52%).In identifying the single mostimportant business goal drivingthe decision to adopt the SS/CMsystem, about 1 in 5 respondentspicked one of the first threefactors listed above, with loweringcosts edging out st<strong>and</strong>ardization<strong>and</strong> development speed as themost-picked factor. About 1 in 8picked either lowering translationcosts specifically or providing moreusable <strong>and</strong> useful informationproducts as the most importantfactor; only 6% chose respondingto regulatory or compliance pressures as the singlemost important driver of adoption.SSwCM Respondents Reported Significantly LargerWork GroupsTable 3 shows that respondent work group sizes weresimilar for three groups: No SS or CM use; use of SSonly; <strong>and</strong> use of CM only. However,the work group size reported bySSwCM users was significantlydifferent.Figure 6. Business Goals Driving Decision to Implement SS/CM SystemSS/CM <strong>and</strong> Non-use Groups VariedSignificantly by Company SizeKnowing that larger work groupsizes predict a significantly greaterlikelihood of using SS/CM methods<strong>and</strong> tools, we would expect thesame to hold true, generally, forthe association between companysize <strong>and</strong> likelihood of using SS/CM. That is the case, though theassociation is not as strong as workgroup size. Chi square analysisrevealed that the proportions shownin Table 4 are significantly different,Volume 57, Number 4, November 2010 ● <strong>Technical</strong> Communication 383
Applied Research<strong>Single</strong> <strong>Sourcing</strong> <strong>and</strong> <strong>Content</strong> <strong>Management</strong>n=137Reduced overall work stressFacilitated focus on information usabilityMade work group more customer-centeredMade me feel more positive about my workImproved information product ease of useImproved cost-effectivenessImproved information product usefulnessSpeeded up developmentWorth the effortWill continue to be used by work groupStrongly Disagree (1) to Strongly Agree (5)1 2 3 4 5Figure 7. Mean Rating of SS/CM Users on 10 Likert-Type Statements AboutSS/CM Impactsunder consideration. DITA was mentioned in nineresponses; other tools mentioned more than one timewere Structured FrameMaker (5 times), MadCap Flare(4), SharePoint (3), RoboHelp (2), <strong>and</strong> XMetal (2).Table 6. Comments on Downsides of SS/CM Implementation:Count by CategoryCategory into which comment n = 72 % of 137was sortedAwkward production/slower23 17production/more work for writersDifficult or slow transition/learning 22 16curve/team member resistanceBugs <strong>and</strong> technical glitches 13 10Lack of ability to customize 5 4Expense 3 2Garbage in, garbage out 3 2<strong>Technical</strong> skills dem<strong>and</strong>s; loss ofprocess control; too early to tell1 each 13.04*3.08**3.143.353.413.453.463.59**** SS only users more strongly agreed that their system reduced stress than SSwCM users.(H = 7.73, DF = 3, p = .052)** SSwCM users more strongly agreed about better usability focus than users of SS only or CMonly. (H = 16.01, DF = 3, p = .001)*** SS only users more strongly agreed about gains in speed than other users; CM only usersagreed less strongly about gains in speed than other users. (H = 18.12, DF = 3, p = .000)3.654.07Half of the No-SS/CM Work GroupsHad Considered SS/CM, but FewPlanned to AdoptIn addition, about 1 in 3 reported thattheir work group had never consideredswitching to SS/CM, <strong>and</strong> about 1 in10 were not sure or gave ambiguousexplanations after checking “Other.”For 66 respondents (47%) in the no-SS/CM group who answered a followupquestion about factors drivingtheir work group to consider usingSS/CM, the most important factorswere speeding up development (71%of n = 66), providing st<strong>and</strong>ardization<strong>and</strong> consistency (68%), <strong>and</strong> cuttingcosts (61%). These results are similarto those from SS/CM respondents(see Figure 6).The 66 non-SS/CM respondentsreporting that their work groupshad considered SS/CM were askedto explain what their group hadconcluded about the feasibility of adopting SS/CM.About half these respondents mentioned as obstacles themoney, time, <strong>and</strong>/or resources required to move forwardwith a transition to SS/CM. About 1 in 5 indicated thattheir work group or management concluded that SS/CM was not practical for them or not needed. Another1 in 5 indicated that no decision had yet been madeabout the feasibility of switching to SS/CM.Respondents Reported Producing a Diverse Arrayof Information ProductsAll respondents were presented with a long list ofinformation products <strong>and</strong> checked all the ones theirwork group produced (see Table 8). Not surprisingly,PDF files <strong>and</strong> technical content documents were thetop categories, selected by 9 out of 10 respondents.About 3 out of 4 said their work groups producedMicrosoft Word files <strong>and</strong>/or content with screenshots. Two other types of products were selected byover half the respondents: HTML-based help content<strong>and</strong> instructional content. Far fewer respondentsindicated their work groups produced multimedia386 <strong>Technical</strong> Communication ● Volume 57, Number 4, November 2010
Applied ResearchDayton <strong>and</strong> HopperIf all varieties of SS/CM are considered togetheras the innovation, the answer about critical mass is aconfident yes: half of our respondents reported usingSS, CM, or SSwCM. In addition, as shown by thedata on how long groups had been using their SS/CMsystem (see Figure 4), the pace of adoption of all threecategories of SS/CM had picked up somewhat duringthe 2 years prior to the survey—from about mid-2006to mid-2008. The current recession began in December2007 (National Bureau of Economic Research, 2008).Undoubtedly, the recession has put a damper on thespread of SS/CM among technical communicationwork groups over the past 2 years. We think it is likely,however, that the recession may have had less impact onthe adoption of SS systems, which generally have a lowerprice tag, than on the more expensive SSwCM systems.If we regard each set of SS/CM methods <strong>and</strong> toolsas a distinct innovation competing with the others, thenour answer about critical mass, based on the Figure 1data, becomes maybe for SS only <strong>and</strong> for SSwCM:Those methods <strong>and</strong> tools appear to have reached acritical mass of adopters. However, the results suggestthat CM without single sourcing did not seem destinedfor widespread adoption in technical communication.In sum, our survey shows that as of mid-2008 STCmembers had moved into the Early Majority phase(Figure 8) for SS only <strong>and</strong> SSwCM, but CM by itselfwas still in the Early Adopter phase. Likewise, withregard to XML adoption, STC members were inthe Early Majority phase, but for DITA they werein the Early Adopter phase (see Figure 3 <strong>and</strong> relatedexplanatory text).Are Larger Companies More Likely to Use SS/CM?Yes—see Table 4—but the strength of the statisticallysignificant association is weaker than some wouldpredict. We found a stronger association betweenwork-group size <strong>and</strong> likelihood of using SS/CM.And, of course, we come back to the problem ofconflating all types of SS/CM methods <strong>and</strong> tools:The cost of adoption in time <strong>and</strong> money will varywidely depending on the specific solution adopted,adapted, <strong>and</strong>/or developed. Some SSwCM systems areexpensive, <strong>and</strong> only companies with deep pockets canafford them. On the other h<strong>and</strong>, a small work groupwith one or two technically savvy <strong>and</strong> resourcefulmembers could develop an SS-only or even an SSwCMsystem with relatively low-cost <strong>and</strong>/or open-sourcetools.Are Translation Requirements a Big Driver of SS/CMAdoption?Absolutely, yes: See Table 5. Our data support whatanyone would have assumed who has followed thistopic at STC conferences. However, translation is notthe top driver of SS/CM adoption, as demonstrated inFigure 6, which shows that three business goals werepicked about evenly as the most important driver ofthe decision to adopt an SS/CM system: Loweringcosts generally, speeding up development, <strong>and</strong>providing st<strong>and</strong>ardization or improving consistency.What Are the Biggest Surprises in the Survey Results?For us, the biggest surprise was that only 1 in 10respondents reported that they had been involved in awork group whose attempt to implement an SS/CMsystem had failed. On more than one occasion, one ofus (Dayton) has heard prominent consultants at STCconferences estimate failure rates for SS/CM projectsat 50% <strong>and</strong> higher. We think the data from our surveyprobably underestimates the actual failure rate forsuch projects, but we also suspect that these resultsmean that failure rates are commonly overestimated.This may be explained by different notions of whatconstitutes a failed project. Half of our survey’srespondents who reported no SS/CM use also reportedthat their work group had considered a switch toSS/CM but had no plans to move in that direction.This suggests that many work groups investigateSS/CM options, including contacting consultants,but end up deciding to stay with the methods <strong>and</strong>tools they have, often without trying to implement anSS/CM system. To a consultant, that may count as afailure to implement, but to insiders it may simply be asuccessful conclusion to a deliberative process focusedon feasibility.Another surprise was that 1 in 4 respondents inwork groups using SS/CM was considering a change inmethods <strong>and</strong> tools <strong>and</strong> that 1 in 2 reported significantdownsides to their current SS/CM methods <strong>and</strong> tools.We did not expect that high a level of dissatisfactionwith SS/CM methods <strong>and</strong> tools; on the other h<strong>and</strong>, weVolume 57, Number 4, November 2010 ● <strong>Technical</strong> Communication 389
Applied Research<strong>Single</strong> <strong>Sourcing</strong> <strong>and</strong> <strong>Content</strong> <strong>Management</strong>did not ask non-users of SS/CM a similar question aboutperceived downsides of their methods <strong>and</strong> tools.What Else in the Results Deserves to Be Highlighted?Microsoft Word <strong>and</strong> FrameMaker were by far the mostusedprimary authoring tools of the survey respondents,<strong>and</strong> more than three times as many respondents producedPDF files as produced content using XML or SGML.We also think that the data on the Likert-typeagreement-disagreement items are intriguing: SS-onlyrespondents were significantly more in agreement thattheir system had speeded up their work while reducingtheir work-related stress. SSwCM respondents, however,were significantly more in agreement that their systemhad made work groups more focused on informationusability issues. These results tempt us to speculate thatthe added complexity of implementing single sourcingthrough a content management system adversely impactsperceptions of overall efficiency <strong>and</strong> stressfulness whilebolstering perceptions that the work group is giving moreattention to the usability of its information products.Perhaps implementing SSwCM is more likely to compelwork groups to re-invent their information developmentprocesses, leading to more user-centered analysis <strong>and</strong>testing of their information products.Is It Likely That This Survey Underestimates Useof SS/CM by STC Members?For surveys of the general public, textbooks aboutsocial science research instruct that a low responserate, commonly specified as below 50% (Babbie, 2007,p. 262), warrants caution in assuming that data fromthe survey accurately represent the results that would beproduced if data could be gathered from all membersof the represented group. Our survey’s response rateof 28% must be viewed as a limitation of the study:Because we lack information about the nonrespondentsto the survey, we cannot know whether they, as a group,differ significantly from respondents in regard to thetopics covered by the survey. The discussion about howlikely it is that the survey’s results accurately representthe experiences <strong>and</strong> attitudes of STC members in 2008must be grounded in logical imputation.We do not think the results underestimateSTC members’ use of single sourcing <strong>and</strong> contentmanagement in the spring of 2008. Indeed, we think thatit seems just as likely that the survey overestimates SS <strong>and</strong>CM use by STC members. We make that argument inAppendix B, for those who may be interested in a review<strong>and</strong> discussion of research supporting the propositionthat low survey response rates do not automaticallymean questionable data quality. Our examination of theliterature on that topic has bolstered our confidence thatour survey presents a reasonably accurate snapshot ofSTC members’ experiences <strong>and</strong> opinions related to singlesourcing <strong>and</strong> content management.From the Survey Results, What Dare We Predict Aboutthe Future of SS/CM?The survey results make for a rather cloudy crystal ball.Nevertheless, adding them to what we know from halfa decade of following the information about SS/CMdisseminated in the publications <strong>and</strong> at the conferencesof technical communication practitioners <strong>and</strong> academics,we feel confident in making these general predictions: <strong>Single</strong> sourcing will slowly but steadily gain wideracceptance among technical communicationworkgroups. <strong>Single</strong> sourcing seems destined to reacha significantly larger proportion of adopters thansingle sourcing with content management—barringa technological breakthrough that makes SSwCMsystems significantly cheaper <strong>and</strong> easier to install, use,<strong>and</strong> maintain. Perhaps, though, one or more popularSS tools such as Adobe FrameMaker <strong>and</strong> MadCapFlare will evolve into true SSwCM solutions, alteringthe SS/CM marketplace quite dramatically. Pushing XML-enabled single sourcing to the tippingpoint may take the arrival, or the more effectivemarketing, of user-friendly <strong>and</strong> affordable plug-intools for Microsoft Word, which was by far the mostusedauthoring tool of STC members in May 2008. The number of eventual SS/CM adopters in technicalcommunication may be somewhat lower than SS/CMvendors <strong>and</strong> consultants anticipate. Already, Web 2.0<strong>and</strong> social media/networking methods <strong>and</strong> tools arestealing the spotlight from SS/CM topics at the leadingconferences attended by technical communicators.That last conjecture seems a suitably provocativenote to end on. St<strong>and</strong>ardized structure <strong>and</strong> control are atthe heart of the SS/CM paradigm, but those qualities areanathema to the Web 2.0/social networking paradigm.390 <strong>Technical</strong> Communication ● Volume 57, Number 4, November 2010
Applied ResearchDayton <strong>and</strong> HopperWhat’s going on here? Could it be that many companiesfind today that they need technical communicators toproduce a continuous stream of just-in-time, variouslystructured, often transient, multimedia content—asmuch or more than they need them to producehighly regulated <strong>and</strong> uniform topics in a databasewhose information, as well as its meta-information, iscomposed almost entirely of words?This question, in simpler forms, will becomethe focus of much discussion among technicalcommunicators. It represents only one of several obviousdirections for further research related to the incessantsearch for better, cheaper, <strong>and</strong> faster ways of creatinguseful <strong>and</strong> usable technical information products.ReferencesAment, K. (2003). <strong>Single</strong> sourcing: Building modulardocumentation. Norwich, NY: William AndrewPublishing.Babbie, E. R. (2007). The practice of social research, 11thed. Belmont, CA: Thomson Wadsworth.Clark, D. (2008). <strong>Content</strong> management <strong>and</strong> theseparation of presentation <strong>and</strong> content. <strong>Technical</strong>Communication Quarterly, 17, 35–60.Dillman, D. A. (2007). Mail <strong>and</strong> Internet surveys: Thetailored design method (2nd ed.). Hoboken, NJ: Wiley.Doyle, B. (2007). Selecting a content managementsystem. Intercom, 54(3): 9–13.Gladwell, M. (2000). The tipping point: How little thingscan make a big difference. Boston: Little, Brown.Hall, W. P. (2001). Maintenance procedures for a classof warships: Structured authoring <strong>and</strong> contentmanagement. <strong>Technical</strong> Communication, 48,235–247.Happonen, T., & Purho, V. (2003). A single sourcingcase study. Presentation (slides) at STC 50th annualconference (Dallas, TX, May 18–21). Retrievedfrom http://www.stc.org/edu/50thConf/dataShow.asp?ID=110McCarthy, J. E., & Hart-Davidson, W. (2009). Findingusability in workplace culture. Intercom, 56(6), 10–12.National Bureau of Economic Research. (2008,December 11). Determination of the December2007 peak in economic activity. Retrieved fromhttp://wwwdev.nber.org/dec2008.pdf.Petrie, G. (2007). Industrial-strength single-sourcing:Using topics to slay the monster project. Presentation(slides) at 54th annual conference of the Societyfor <strong>Technical</strong> Communication (Minneapolis, MN,May 13–16). Retrieved from http://www.stc.org/edu/54thConf/dataShow.asp?ID=27.Pettit Jones, C., Mitchko, J., & Overcash, M. (2004).Case study: Implementing a content managementsystem. In G. Hayhoe (ed.), Proceedings of the51st annual conference of the Society for <strong>Technical</strong>Communication (Baltimore, Maryl<strong>and</strong>, May 9–12).Arlington, VA: STC. Retrieved from http://www.stc.org/ConfProceed/2004/PDFs/0048.pdf.Pierce, K., & Martin, E. (2004). <strong>Content</strong> managementfrom the trenches. In G. Hayhoe (ed.), Proceedings ofthe 51st annual conference of the Society for <strong>Technical</strong>Communication (Baltimore, MD, May 9–12).Arlington, VA: STC. Retrieved from http://www.stc.org/ConfProceed/2004/PDFs/0049.pdf.Rockley, A. (2001). <strong>Content</strong> management for singlesourcing. In Proceedings of the 48th annual conferenceof the Society for <strong>Technical</strong> Communication (Chicago,IL, May 13–16). Arlington, VA: STC. Retrievedfrom http://www.stc.org/ConfProceed/2001/PDFs/STC48-000171.pdf.Rockley, A., Kostur, P., & Manning, S. (2002).Managing enterprise content: A unified contentstrategy. Indianapolis, IN: New Riders.Rogers, E. M. (1995). Diffusion of innovations, 4th ed.New York: Free Press.Volume 57, Number 4, November 2010 ● <strong>Technical</strong> Communication 391
Applied Research<strong>Single</strong> <strong>Sourcing</strong> <strong>and</strong> <strong>Content</strong> <strong>Management</strong>Welch, E. B., & Beard, I. (2002). <strong>Single</strong> sourcing: Ourfirst year. In G. Hayhoe (ed.), Proceedings of the49th annual conference of the Society for <strong>Technical</strong>Communication (Nashville, Tennessee, May 5–8).Arlington, VA: STC. Retrieved from http://www.stc.org/ConfProceed/2002/PDFs/STC49-00070.pdf.About the AuthorsDavid Dayton is an Associate Fellow of STC. Hehas worked in technical communication since 1989as a technical writer <strong>and</strong> editor, Web content designer<strong>and</strong> usability professional, <strong>and</strong> university teacher<strong>and</strong> researcher. He conducted this research while hewas a faculty member of the English Department atTowson University. He recently left academe to jointhe International Affairs <strong>and</strong> Trade team of the U.S.Government Accountability Office, where he works asa Communications Analyst. E-mail address: dr.david.dayton@gmail.comKeith B. Hopper has taught in the master’s program inInformation Design <strong>and</strong> Communication at SouthernPolytechnic State University since 2001. An associateprofessor there, he also teaches in the <strong>Technical</strong>Communication undergraduate program. Recently,he launched an innovative master’s degree programin Information <strong>and</strong> Instructional Design: http://iid.spsu.edu. He holds a PhD in Instructional Technologyfrom Georgia State University. E-mail address:khopper@spsu.eduDayton manuscript received 26 February 2010, revised 28August 2010, accepted 8 September 2010.Appendix A: An Annotated BibliographyBecause our survey was about methods <strong>and</strong> toolsthat have been much discussed in conferences <strong>and</strong>the literature of the field for over a decade, we didnot begin our report with an introductory literaturereview—the conventional way of justifying a new study<strong>and</strong> showing its relation to prior research <strong>and</strong> theory.Instead, we provide this brief annotated bibliography.We selected these sources as recent <strong>and</strong> useful startingpoints for delving into the abundant literature bytechnical communicators discussing single sourcing<strong>and</strong> content management.Dayton, D. (2006). A hybrid analytical frameworkto guide studies of innovative IT adoption by workgroups. <strong>Technical</strong> Communication Quarterly, 15,355–382.This article reports a case study of a mediumsizedcompany that carried out a user-centereddesign process, complete with empirical audienceresearch <strong>and</strong> usability tests, to put all its technicalreference, troubleshooting, training, <strong>and</strong> userassistance information into a single-source, databasedrivencontent management system. The case studyis interpreted through the lens of a hybrid analyticalframework that combines <strong>and</strong> aligns three distincttheoretical traditions that have been used to guidetechnology adoption <strong>and</strong> diffusion studies.Dayton, D. (2007). Prospectus for a multimodalstudy of single sourcing <strong>and</strong> content management.In IPCC 2007: Engineering the future of humancommunication. Proceedings of the 2007 IEEEInternational Professional CommunicationConference (IPCC) held in Seattle, Washington, Oct.1–3, 2007. Piscataway, NJ: IEEE.This proceedings paper describes the researchproject funded by STC in 2007, of which the surveyreported in our article is the major part. It containsa justification for the focus of the study based in atraditional review of the literature.Kastman Breuch, L. (2008). A work in process: Astudy of single-source documentation <strong>and</strong> documentreview processes of cardiac devices. <strong>Technical</strong>Communication, 55, 343–356.This article from the STC journal documents acase study with details on implementation <strong>and</strong> impactsthat offer a healthy practical counterpoint to the moreabstract <strong>and</strong> theoretical perspectives that dominate thechapters in the Pullman <strong>and</strong> Gu collection. KastmanBreuch is particularly interested to explore the impacts392 <strong>Technical</strong> Communication ● Volume 57, Number 4, November 2010
Applied ResearchDayton <strong>and</strong> Hopperof single sourcing (implemented through a contentmanagement system) on the document review process:“Both of these practices influence the roles <strong>and</strong> identitiesof technical writers as individual authors. What happenswhen we examine the impact of both practices—document review processes <strong>and</strong> single sourcing—together?” (p. 345).Pullman, G., & Gu, B. (Eds.). (2008). <strong>Content</strong>management: bridging the gap between theory <strong>and</strong>practice. Amityville, NY: Baywood Pub. Co.A collection of 11 articles originally published in aspecial issue of <strong>Technical</strong> Communication Quarterly, thisbook will appeal primarily to those seeking an in-depth,critical exploration of content management systems.The book’s editors define CM broadly, <strong>and</strong> none ofthe chapters specifically focus on single sourcing. Anonline copy of the book’s introduction is available atthe publisher’s Web site: http://www.baywood.com/intro/378-9.pdf.Rockley, A. (2001). The impact of single sourcing <strong>and</strong>technology. <strong>Technical</strong> Communication, 48, 189–193.This article in the STC’s journal was the first topropose a comprehensive scheme for defining typesof single sourcing. Rockley described four distinctlevels of single sourcing, with level 2 correspondingto what we have defined as single sourcing withoutcontent management. Level 3 corresponds to what wehave defined as content management: “Information isdrawn from a database, not from static, pre-built filesof information” (p. 191). Rockley equates level 4 withadvanced electronic performance support systems thatare not practical to implement in most user-assistancescenarios.Williams, J. D. (2003). The implications of singlesourcing for technical communicators. <strong>Technical</strong>Communication, 50, 321–327.This article by a practicing technical communicatorprovides an excellent starting point for readers new tothe topic of single sourcing. Williams provides concisebut comprehensive summaries of key articles <strong>and</strong> booksfrom 2000 to 2003 <strong>and</strong> provides a well-selected furtherreading list that includes articles from 1995 to 2002.Appendix B: New Thinking About SurveyResponse RatesResearchers have recently called into question whethera survey response rate of 60% to 70% should beconsidered, by itself, to ensure that the results are moretrustworthy than those from a survey with a muchlower response rate (Curtin, Presser, & Singer, 2000;Keeter et al., 2000; Merkle & Edelman, 2002). Groves,Presser, <strong>and</strong> Dipko (2004) sum up the challenge tothe conventional wisdom on response rates: “While alow survey response rate may indicate that the risk ofnonresponse error is high, we know little about whennonresponse causes such error <strong>and</strong> when nonresponseis ignorable” (p. 2).“Emerging research,” Radwin wrote (2009),“shows that despite all the h<strong>and</strong>-wringing about surveynonresponse, the actual effect of response rate on surveyaccuracy is generally small <strong>and</strong> inconsistent, <strong>and</strong> in anycase it is less consequential than many other serious butoften ignored sources of bias” (para. 4). Radwin citesa study by Visser, Krosnick, Marquette, <strong>and</strong> Curtin(1996) that compared the pre-election results of mailsurveys conducted from 1980 through 1994 with theresults of parallel telephone surveys conducted in thesame years. The average response rate of the mail surveyswas 25% while the telephone surveys reported estimatedresponse rates of 60% to 70%. Based on response ratealone, conventional wisdom would predict that thetelephone surveys were significantly more accurate thanthe mail surveys, but the opposite was the case. The mailsurveys consistently outperformed the telephone surveyson accuracy. Visser et al. concluded that “to view a highresponse rate as a necessary condition for accuracy is notnecessarily sensible, nor is the notion that a low responserate necessarily means low accuracy” (p. 216).We believe that what Visser et al. (1996) found tobe true of surveys of the electorate is even more likely tohold true for surveys such as ours whose sampling frameis confined to the members of a professional organization.Almost four decades ago, Leslie (1972) noted that “whensurveys are made of homogeneous populations (personshaving some strong group identity) concerning theirattitudes, opinions, perspectives, etc., toward issuesconcerning the group, significant response-rate biasVolume 57, Number 4, November 2010 ● <strong>Technical</strong> Communication 393
Applied Research<strong>Single</strong> <strong>Sourcing</strong> <strong>and</strong> <strong>Content</strong> <strong>Management</strong>is probably unlikely” (p. 323). In their recent metaanalysisof studies on nonresponse error in surveys,Groves <strong>and</strong> Peytcheva (2008) concluded that “theimpression that membership surveys tend to suffer fromunusually large nonresponse biases may be fallacious”(p. 179), even though relatively low response rates forsuch surveys have become a well-known problem.Rogelberg et al. (2003) stress the self-evidentpoint, often forgotten in discussions on this topic,that survey nonresponse is not the same as surveynoncompliance—the purposeful refusal to take a survey.If a sizable number of our e-mailed survey invitationsnever reached the intended recipients, because of spamblockers, for example, or filters created by recipientsto delete e-mails from certain senders, then the actualresponse rate would be higher—though by how muchis impossible to say. Similarly, it is impossible to knowhow many times the e-mails about the survey mayhave been deleted automatically by recipients who didnot make a conscious decision to refuse the invitationto take the survey. During May 2008, along with oursurvey invitation STC sent out multiple e-mails tomembers about the upcoming annual conference. Manymembers in the sample may have paid scant attentionto our initial e-mails about the survey because the firstidentified stc@stc.org as the sender. (We had the STCstaff member change the sender to ddayton@stc.org forthe two reminder e-mails.)We believe that most of our survey’s nonrespondentswere passive, not active nonrespondents. Based ontheir in-depth field study, Rogelberg et al. (2003)concluded that only about 15% of nonrespondentsto organizational surveys were active nonrespondents,<strong>and</strong> also concluded that passive nonrespondents wereidentical to respondents when the survey variables hadto do with attitudes toward the organization. Whileour survey was directed at members of an organization,the questions were not about the organization, <strong>and</strong>the type of organization is a special class—professionalmembership organizations. Thus, we cannot assume thatthe findings <strong>and</strong> reasoning reported by Rogelberg et al.(2003) apply to our nonrespondents; on the other h<strong>and</strong>,we think the question raised is one worth consideringin regard to our survey: Were most nonrespondentspassively passing up the chance to take our survey, orwere most of them actively rejecting the invitationbecause of some attitude related to the topic of the surveyor attributable to some other cause that might meanthat their answers on the survey would be significantlydifferent from the answers of those who responded?If failing to achieve a certain response rate isnot automatically an indicator of nonresponse biasin a sample survey, how then can we estimate thelikelihood that the survey results are biased becauseof missing data from the r<strong>and</strong>om sample? Rogelberg(2007) summed up the answer: “Bias exists whennonrespondent differences are related to st<strong>and</strong>ing onthe survey topic of interest such that respondents <strong>and</strong>nonrespondents differ on the actual survey variables ofinterest” (p. 318). Translating that into plain Englishfor the case in question, if a significant proportionof our survey’s nonrespondents were significantlydifferent from respondents in their experience withor attitudes toward single sourcing <strong>and</strong> contentmanagement, then their missing data represents asource of bias in our survey results. Thinking aboutwhy recipients of our e-mails about the survey wouldpurposely ignore or actively reject the invitation,we surmise that most such active nonrespondents,as opposed to the likely majority of passivenonrespondents, would have found the survey topicof little interest because they had no experience withsingle sourcing <strong>and</strong>/or content management systems.Even though we worded our survey invitations tostress our desire to collect information from all STCmembers, regardless of whether they used SS/CMmethods <strong>and</strong> tools, it seems likely that many recipientsof our messages who had no experience with suchmethods <strong>and</strong> tools would have felt disinclined to takethe time to fill out the survey. To the extent that ourconjecture about this is accurate, the survey resultswould overestimate the proportion of STC memberswhose work groups used SS/CM methods <strong>and</strong> tools inMay 2008.References for Appendix BCurtin, R., Presser, S., & Singer, E. (2000). The effectsof response rate changes on the index of consumersentiment. Public Opinion Quarterly, 64, 413–428.doi:10.1086/318638.394 <strong>Technical</strong> Communication ● Volume 57, Number 4, November 2010
Applied ResearchDayton <strong>and</strong> HopperGroves, R. M., Presser, S., & Dipko, S. (2004). The roleof topic interest in survey participation decisions.Public Opinion Quarterly, 68, 2–31. doi:10.1093/poq/nfh002.Groves, R. M., & Peytcheva, E. (2008). The impact ofnonresponse rates on nonresponse bias: A metaanalysis.Public Opinion Quarterly, 72, 167–189.doi:10.1093/poq/nfn011.Keeter, S., Miller, C., Kohut, A., Groves, R., & Presser,S. (2000). Consequences of reducing nonresponsein a national telephone survey. Public OpinionQuarterly, 64, 125–48.Leslie, L. L. (1972). Are high response rates essential tovalid surveys? Social Science Research, 1, 323–334.doi:10.1016/0049-089X(72)90080-4.Merkle, D., & Edelman, M. (2002). Nonresponse in exitpolls: A comprehensive analysis. In R. M. Groves,D. A. Dillman, J. L. Eltinge, & R. J. A. Little (Eds.),Survey nonresponse (pp. 243–258). New York: Wiley.Radwin, D. (2009). High response rates don’t ensuresurvey accuracy. The Chronicle of Higher Education,(October 5). Retrieved from http://chronicle.com/article/High-Response-Rates-Dont/48642/.Rogelberg, S. G. (2006). Underst<strong>and</strong>ing nonresponse<strong>and</strong> facilitating response to organizationalsurveys. In A. I. Kraut (ed.)., Getting action fromorganizational surveys: new concepts, methods, <strong>and</strong>applications (pp. 312–325). San Francisco, CA:Jossey-Bass.Rogelberg, S. G., Conway, J. M., Sederburg, M. E.,Spitzmüller, C., Aziz, S., & Knight, W. E. (2003).Profiling active <strong>and</strong> passive nonrespondentsto an organizational survey. Journal of AppliedPsychology, 88(6), 1104–1114. doi:10.1037/0021-9010.88.6.1104.Visser, P. S., Krosnick, J. A., Marquette, J., & Curtin,M. (1996). Mail surveys for election forecasting?An evaluation of the Columbus Dispatch poll. PublicOpinion Quarterly, 60, 181–227.Appendix C: Survey DocumentsLink to a Non-Working Archival Copy of the Surveyhttp://www.zoomerang.com/Survey/WEB22B38UWBJKZCopy of Survey Notification Message from STCPresident Linda OestreichSubject: Please participate in a research study of STCmembersThe STC is sponsoring research to discover therange of information development methods <strong>and</strong> toolsbeing used by STC members. We especially want toknow how many members are using single sourcing <strong>and</strong>content management methods <strong>and</strong> tools.Whether or not you use single sourcing <strong>and</strong>/orcontent management, we need your input. You areincluded in the small r<strong>and</strong>om sample of members whowill receive an e-mail containing the link to an onlinequestionnaire.The survey can be done anonymously, or youcan provide an e-mail address for follow-up contactor to receive an early view of the results. Most testersreported that they completed the survey in 10 to15 minutes.I am excited that Dr. David Dayton (PhD,<strong>Technical</strong> Communication) <strong>and</strong> Dr. Keith Hopper(PhD, Instructional Technology) have designed <strong>and</strong>tested the survey instrument <strong>and</strong> are ready to collect <strong>and</strong>analyze the data that you provide.Look for an e-mail with a link to the survey onTuesday, May 13.Dr. Dayton will give a report on the surveyresults at a session of the 2008 <strong>Technical</strong>Communication Summit, which will be held inPhiladelphia June 1-4.Copy of First E-mail Message Containing a Link to theSurveySubject: Please participate in a research study of STCmembersVolume 57, Number 4, November 2010 ● <strong>Technical</strong> Communication 395
Applied Research<strong>Single</strong> <strong>Sourcing</strong> <strong>and</strong> <strong>Content</strong> <strong>Management</strong>We professional technical communicators lackreliable data on the range of information developmenttools <strong>and</strong> technologies being used by practitioners.The STC is sponsoring research to collect thatinformation, with a focus on finding out what singlesourcing <strong>and</strong>/or content management methods <strong>and</strong> toolsare being used.Your name was among the small r<strong>and</strong>om sample ofmembers receiving this invitation to participate in anonline survey accessed at this page: [typed here was alink to the informed consent Web page reproduced afterthis message]The survey can be done anonymously, or you canprovide an e-mail address for possible follow-up contactor to receive an early view of results. The exact set ofquestions presented will depend on your answers to keyquestions, so the time required to fill out the surveywill vary. Most testers reported that they completed thesurvey in 10 to 15 minutes.Whether or not you use single sourcing <strong>and</strong>/or content management, we need your input. Byparticipating, you will help us construct a reliable profileof information development methods <strong>and</strong> tools used bySTC members.Because the r<strong>and</strong>om sample is a small fraction of thetotal STC membership, it is critical that we have yourdata in the survey results. It is equally critical that membersof the sample do not forward the survey link to others.If you have any problems with the link to the surveyor with the survey itself, please contact David Dayton atddayton@rcn.com.David Dayton: research project leadTowson University (Maryl<strong>and</strong>)Keith Hopper: survey deployment <strong>and</strong> statistical analysisSouthern Polytechnic State University (Georgia)Copy of informed consent Web page giving accessto the survey<strong>Single</strong> <strong>Sourcing</strong> <strong>and</strong> <strong>Content</strong> <strong>Management</strong> in<strong>Technical</strong> Communication: A Survey of STCMembersConsent FormBecause you were included in a small r<strong>and</strong>omsample of STC members, your information is vital toachieving the purpose of the survey even if you donot use single sourcing or content management.This consent form is required by federal regulations.By clicking the agreement link at the bottom of thisform, you acknowledge that your participation isvoluntary, that you may ab<strong>and</strong>on the survey at anypoint, <strong>and</strong> that your information is anonymous unlessyou provide contact information, in which case wepromise to h<strong>and</strong>le your information with the strictestconfidentiality.Time RequiredMost testers of the survey reported that it took them10–15 minutes to fill out the questionnaire that willappear after you click on the “I agree” link at thebottom of this form.Purpose of the StudyThis survey will collect information from a sampleof STC members about their use or non-use of singlesourcing <strong>and</strong> content management tools <strong>and</strong> methods–<strong>and</strong> their opinions about them. (In the survey, wedefine precisely what we mean by “single sourcing” <strong>and</strong>“content management.”)What You Will Do in the StudyYour only task is to fill in the Web survey itself.BenefitsRespondents who complete the survey will be offeredan early look at the preliminary data, which we willcontinue to analyze <strong>and</strong> will later report in conferencepresentations <strong>and</strong> published articles. As a technicalcommunicator, you may benefit in that the survey datawill provide a statistical snapshot of the informationdevelopment methods <strong>and</strong> tools that STC membersare using today <strong>and</strong> their opinions about some of thosemethods <strong>and</strong> tools.ConfidentialityThe information you provide will be h<strong>and</strong>ledconfidentially. If you choose not to identify yourselfto us, we will not try to find out who you are. You willhave the option of identifying yourself for follow-up396 <strong>Technical</strong> Communication ● Volume 57, Number 4, November 2010
Applied ResearchDayton <strong>and</strong> Hoppercontact by e-mail or to view the preliminary surveyresults.We will present the survey findings in terms ofgroup percentages, look for common themes in theopen-ended questions, <strong>and</strong> cite remarks where they areinteresting <strong>and</strong> appropriate. No individual respondentswill be identified.RisksWe do not believe there are any risks associated withparticipating in this survey.Voluntary Participation <strong>and</strong> Right to WithdrawYour participation in this study is completelyvoluntary, <strong>and</strong> you have the right to withdraw fromthe study at any time without penalty.How to Withdraw from the StudyIf you want to withdraw from the study, you may doso at any time simply by closing the browser in whichthis form or the questionnaire appears.Whom to Contact About this Study or Your Rights in theStudyPrincipal InvestigatorsDavid Dayton, ddayton@rcn.com, Towson University(Maryl<strong>and</strong>)Keith Hopper, khopper@spsu.edu, Southern PolytechnicState University (Georgia)Chairperson, Institutional Review Board for theProtection of Human Participants, Towson University(Maryl<strong>and</strong>): Patricia Alt, palt@towson.eduAgreementIf you agree, click here to start the survey. If youexperience a problem with the link above, please copy<strong>and</strong> paste the following URL into your browser: [fullWeb address to the survey was typed here]If you do not agree to participate in the survey,please close the browser now or go to the STC homepage.THIS PROJECT HAS BEEN REVIEWED BY THEINSTITUTIONAL REVIEW BOARD FOR THEPROTECTION OF HUMAN PARTICIPANTS ATTOWSON UNIVERSITY.Volume 57, Number 4, November 2010 ● <strong>Technical</strong> Communication 397