Annual Report - Sens
Annual Report - Sens
Annual Report - Sens

You also want an ePaper? Increase the reach of your titles
YUMPU automatically turns print PDFs into web optimized ePapers that Google loves.
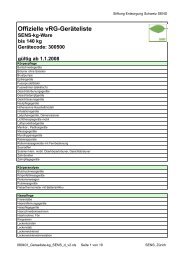
Starting point: distribution of the SENS<br />
collection points according to turnover<br />
The diagram illustrates the distribution of the SENS collection points<br />
according to turnover from collection point remunerations.<br />
200,000<br />
180,000<br />
160,000<br />
140,000<br />
120,000<br />
100,000<br />
80,000<br />
60,000<br />
40,000<br />
20,000<br />
0<br />
50 100 150 200 250<br />
Type of organisational structure<br />
and company<br />
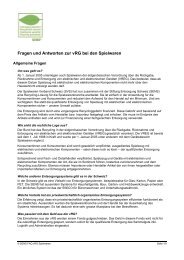
The diagram shows that there is an even balance between collection<br />
points operated by the private sector and collection points belonging<br />
to local communities / municipal authorities.<br />
Community and municipal<br />
collection points<br />
Private<br />
Supra-regional<br />
collection points<br />
Private, contracted with<br />
public disposal system<br />
Supra-regional and<br />
community<br />
0 7 14 21 28<br />
35<br />
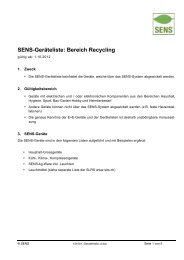
Assessing the approaches<br />
to remuneration<br />
Collection points<br />
The diagram shows that about 50 per cent of those asked considered<br />
the current SENS and SLRS approach to remuneration appropriate or<br />
merely adequate.<br />
18.87% appropriate<br />
33.96% just adequate<br />
17.92% just inadequate<br />
29.25% inadequate<br />
Share of SENS goods (volume)<br />
in the total volume<br />
The diagram shows that the share of SENS goods in the total<br />
volume of transported goods is between 2 and 15 per cent for most<br />
of the businesses surveyed.<br />
> 50%<br />
16 to 50%<br />
2 to 15%<br />
< 2%<br />
0 10 20 30 40<br />
50<br />
SENS <strong>Annual</strong> <strong>Report</strong> 2011 21