Monitor Uitvoeringsstrategie Plabeka
Monitor Uitvoeringsstrategie Plabeka - Metropoolregio Amsterdam
Monitor Uitvoeringsstrategie Plabeka - Metropoolregio Amsterdam

Create successful ePaper yourself
Turn your PDF publications into a flip-book with our unique Google optimized e-Paper software.
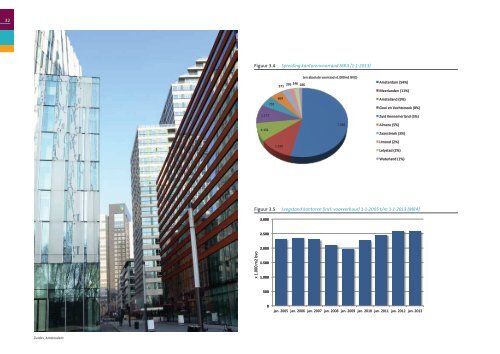
32Figuur 3.4 Spreiding kantorenvoorraad MRA (1-1-2013)1.177 1.151 732 (en absolute voorraad x1.000m2 BVO) 371 295 246 186 669 7.360 Amsterdam (54%) Meerlanden (11%) Amstelland (9%) Gooi en Vechtstreek (8%) Zuid Kennemerland (5%) Almere (5%) Zaanstreek (3%) 1.520 IJmond (2%) Lelystad (2%) Waterland (1%) Figuur 3.5Leegstand kantoren (incl. voorverhuur) 1-1-2005 t/m 1-1-2013 (MRA)3.000 2.500 x 1.000 m2 bvo 2.000 1.500 1.000 500 0 jan. 2005 jan. 2006 jan. 2007 jan. 2008 jan. 2009 jan. 2010 jan. 2011 jan. 2012 jan. 2013 Zuidas, Amsterdam