Servicio Público <strong>de</strong> Empleo <strong>Estatal</strong>COMUNIDADAUTÓNOMAProvinciaTABLA 34. CONTRATACIÓN SEGÚN TIPO DE DISCAPACIDADNo<strong>de</strong>claradaFísicasPsíquicas Sensoriales Del lenguajeTotal<strong>con</strong>tratos% sobretotal<strong>con</strong>tratosCATALUÑA 17.422 5.234 1.907 1.844 94 26.501 13,05Barcelona 13.037 3.828 1.362 1.374 67 19.668 9,69Girona 1.432 540 187 129 6 2.294 1,13Lleida 925 223 105 92 9 1.354 0,67Tarragona 2.028 643 253 249 12 3.185 1,57COMUN. VALENCIANA 5.539 8.409 1.834 1.945 178 17.905 8,82Alicante/Alacant 1.245 1.455 472 515 79 3.766 1,85Castellón/Castelló 590 914 210 146 10 1.870 0,92Valencia 3.704 6.040 1.152 1.284 89 12.269 6,04EXTREMADURA 1.834 3.775 889 1.023 27 7.548 3,72Badajoz 1.375 2.622 633 683 16 5.329 2,62Cáceres 459 1.153 256 340 11 2.219 1,09GALICIA 7.039 3.002 659 1.040 22 11.762 5,79A Coruña 3.288 1.350 261 367 5 5.271 2,60Lugo 495 289 79 119 3 985 0,49Ourense 316 299 104 79 7 805 0,40Pontevedra 2.940 1.064 215 475 7 4.701 2,32MADRID, COMUNIDAD DE 7.877 9.141 2.474 2.706 129 22.327 11,00Madrid 7.877 9.141 2.474 2.706 129 22.327 11,00MURCIA, REGIÓN DE 3.344 3.984 522 652 68 8.570 4,22Murcia 3.344 3.984 522 652 68 8.570 4,22NAVARRA, COM. FORAL 1.063 1.039 315 212 16 2.645 1,30Navarra 1.063 1.039 315 212 16 2.645 1,30PAÍS VASCO 6.421 3.542 1.159 984 58 12.164 5,99Araba/Álava 798 725 367 199 15 2.104 1,04Bizkaia 2.701 1.358 588 445 32 5.124 2,52Gipuzkoa 2.922 1.459 204 340 11 4.936 2,43RIOJA, LA 691 772 174 132 1 1.770 0,87La Rioja 691 772 174 132 1 1.770 0,87CEUTA 103 168 52 33 0 356 0,18Ceuta 103 168 52 33 0 356 0,18MELILLA 360 409 27 87 3 886 0,44Melilla 360 409 27 87 3 886 0,44Fuente: Sistema <strong>de</strong> Información <strong>de</strong> los Servicios Públicos <strong>de</strong> Empleo. Año 2014.<strong>2015</strong> – <strong>Informe</strong> <strong><strong>de</strong>l</strong> <strong>Mercado</strong> <strong>de</strong> <strong>Trabajo</strong> <strong>de</strong> <strong>las</strong> <strong>Personas</strong> <strong>con</strong> discapacidad. <strong>Estatal</strong> . Datos 2014 85
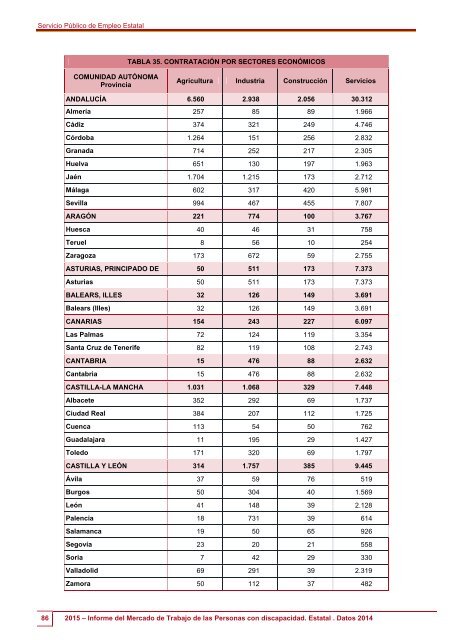
Servicio Público <strong>de</strong> Empleo <strong>Estatal</strong>TABLA 35. CONTRATACIÓN POR SECTORES ECONÓMICOSCOMUNIDAD AUTÓNOMAProvinciaAgricultura Industria Construcción ServiciosANDALUCÍA 6.560 2.938 2.056 30.312Almería 257 85 89 1.966Cádiz 374 321 249 4.746Córdoba 1.264 151 256 2.832Granada 714 252 217 2.305Huelva 651 130 197 1.963Jaén 1.704 1.215 173 2.712Málaga 602 317 420 5.981Sevilla 994 467 455 7.807ARAGÓN 221 774 100 3.767Huesca 40 46 31 758Teruel 8 56 10 254Zaragoza 173 672 59 2.755ASTURIAS, PRINCIPADO DE 50 511 173 7.373Asturias 50 511 173 7.373BALEARS, ILLES 32 126 149 3.691Balears (Illes) 32 126 149 3.691CANARIAS 154 243 227 6.097Las Palmas 72 124 119 3.354Santa Cruz <strong>de</strong> Tenerife 82 119 108 2.743CANTABRIA 15 476 88 2.632Cantabria 15 476 88 2.632CASTILLA-LA MANCHA 1.031 1.068 329 7.448Albacete 352 292 69 1.737Ciudad Real 384 207 112 1.725Cuenca 113 54 50 762Guadalajara 11 195 29 1.427Toledo 171 320 69 1.797CASTILLA Y LEÓN 314 1.757 385 9.445Ávila 37 59 76 519Burgos 50 304 40 1.569León 41 148 39 2.128Palencia 18 731 39 614Salamanca 19 50 65 926Segovia 23 20 21 558Soria 7 42 29 330Valladolid 69 291 39 2.319Zamora 50 112 37 48286 <strong>2015</strong> – <strong>Informe</strong> <strong><strong>de</strong>l</strong> <strong>Mercado</strong> <strong>de</strong> <strong>Trabajo</strong> <strong>de</strong> <strong>las</strong> <strong>Personas</strong> <strong>con</strong> discapacidad. <strong>Estatal</strong> . Datos 2014