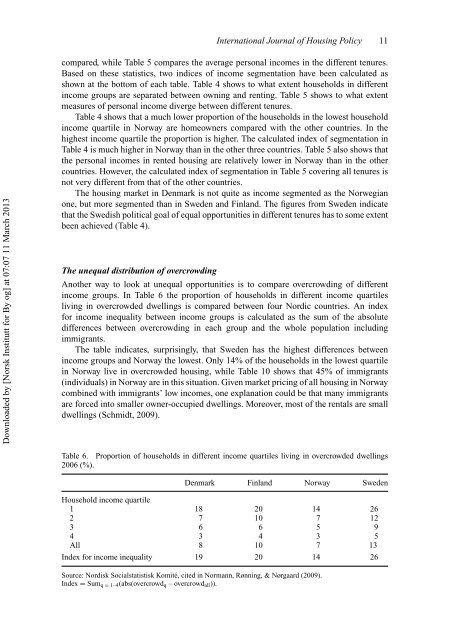
International Journal of Housing Policy 11Downloaded by [Norsk Institutt for By og] at 07:07 11 March 2013<strong>com</strong>pared, while Table 5 <strong>com</strong>pares the average personal in<strong>com</strong>es in the different tenures.Based on these statistics, two indices of in<strong>com</strong>e segmentation have been calculated asshown at the bottom of each table. Table 4 shows to what extent households in differentin<strong>com</strong>e groups are separated between owning and renting. Table 5 shows to what extentmeasures of personal in<strong>com</strong>e diverge between different tenures.Table 4 shows that a much lower proportion of the households in the lowest householdin<strong>com</strong>e quartile in Norway are homeowners <strong>com</strong>pared with the other countries. In thehighest in<strong>com</strong>e quartile the proportion is higher. The calculated index of segmentation inTable 4 is much higher in Norway than in the other three countries. Table 5 also shows thatthe personal in<strong>com</strong>es in rented housing are relatively lower in Norway than in the othercountries. However, the calculated index of segmentation in Table 5 covering all tenures isnot very different from that of the other countries.The housing market in Denmark is not quite as in<strong>com</strong>e segmented as the Norwegianone, but more segmented than in Sweden and Finland. The figures from Sweden indicatethat the Swedish political goal of equal opportunities in different tenures has to some extentbeen achieved (Table 4).The unequal distribution of overcrowdingAnother way to look at unequal opportunities is to <strong>com</strong>pare overcrowding of differentin<strong>com</strong>e groups. In Table 6 the proportion of households in different in<strong>com</strong>e quartilesliving in overcrowded dwellings is <strong>com</strong>pared between four Nordic countries. An indexfor in<strong>com</strong>e inequality between in<strong>com</strong>e groups is calculated as the sum of the absolutedifferences between overcrowding in each group and the whole population includingimmigrants.The table indicates, surprisingly, that Sweden has the highest differences betweenin<strong>com</strong>e groups and Norway the lowest. Only 14% of the households in the lowest quartilein Norway live in overcrowded housing, while Table 10 shows that 45% of immigrants(individuals) in Norway are in this situation. Given market pricing of all housing in Norway<strong>com</strong>bined with immigrants’ low in<strong>com</strong>es, one explanation could be that many immigrantsare forced into smaller owner-occupied dwellings. Moreover, most of the rentals are smalldwellings (Schmidt, 2009).Table 6. Proportion of households in different in<strong>com</strong>e quartiles living in overcrowded dwellings2006 (%).Denmark Finland Norway SwedenHousehold in<strong>com</strong>e quartile1 18 20 14 262 7 10 7 123 6 6 5 94 3 4 3 5All 8 10 7 13Index for in<strong>com</strong>e inequality 19 20 14 26Source: Nordisk Socialstatistisk Komité, cited in Normann, Rønning, & Nørgaard (2009).Index = Sum q = 1–4 (abs(overcrowd q – overcrowd all )).
12 H. Skifter Andersen et al.Downloaded by [Norsk Institutt for By og] at 07:07 11 March 2013Evaluation of immigrants’ access to housing in different tenuresImmigrants’ access to social/public housing is determined by the general rules for allocationof vacant dwellings and the extent to which local authorities have the right of disposal ofdwellings to allocate to low-in<strong>com</strong>e groups. In all countries, local authorities have anobligation to provide housing for new refugees, which most often results in settlement insocial/public housing.In Denmark and Sweden, access to social/public housing is in principle based on anopen allocation system with waiting lists. In recent years, however, access to social/publichousing in Denmark has be<strong>com</strong>e somewhat more difficult for immigrants due to the newrules of allocation that have been introduced in estates with many immigrants. In Finland,as in Norway, access is based on urgent housing needs, which favours the most vulnerableimmigrants but not the more successful.In Denmark, rent control in the private rented sector produces queues that do notfavour immigrants and tend to reduce their possibilities of accessing the sector, becauseimmigrants seldom know landlords personally and some landlords do not want to lettheir properties to immigrants (Skifter Andersen, 2008). In Norway, the small rental sectorincreases the <strong>com</strong>petition between house hunters who want to rent, which provides afertile environment for discrimination. Moreover, the market is dominated by small landlordsletting one or a few dwellings, who tend to avoid immigrants as tenants (Nordvik,1996; Søholt & Astrup, 2009a). However, private professional renting <strong>com</strong>panies seemto be increasing in Oslo. These landlords let a range of types of rentals which seem tobe more accessible for immigrants. Finland has a more professionalised private rentalsector, which puts weight on allocation by market mechanisms and should facilitate immigrants’access if they can pay the rent, and discrimination does not take place. InSweden it is permissible for municipalities to establish a central housing allocation service,which is open to immigrants, but the landlords are not obliged to use it, so herepersonal contacts with landlords are also important. Table 9 indicates that immigrantsin Sweden and Finland have much easier access to private renting than in Norway andDenmark.Cooperatives in Denmark differ very much from cooperatives in Sweden andNorway. Access to Danish cooperatives has been very difficult for immigrants, becauseallocation of dwellings has been controlled by the boards of the cooperatives, which insteadof immigrants have often chosen family or friends. In recent years prices have risen insome places to the market level, which in principle should make it easier for immigrants toget access if they can pay these prices. In Norway access to cooperatives is market based,<strong>com</strong>bined with seniority as members of the association. The applicants have to be formallyaccepted by the boards of the cooperatives, but there is not much room for discrimination. InSweden allocation is market based. In new construction, which earlier was given subsidies,waiting lists are used, with seniority as the allocation principle.Access to owner-occupied housing is market based in all the countries. There is notmuch research on discrimination against home buyers in the Nordic countries. Avoidingstrategies from sellers, neighbours and estate agents are however documented in Norwaybut seem to be less frequent than discrimination in the rental market (Søholt, 2007; Søholt& Astrup, 2009a). But immigrants could have difficulties in gaining loans or mortgagesfor housing. This depends very much on the kinds of finance and subsidies available in thevarious countries, which is discussed below.In Table 7 an evaluation is made of the ease with which immigrants access differenttenures in the countries. It takes into account the issues identified above concerning supply