Haplotype
å ¨æ
å ¨æ
- No tags were found...

Create successful ePaper yourself
Turn your PDF publications into a flip-book with our unique Google optimized e-Paper software.
研 究 報 告單 套 型 與 環 境 效 應 的 半 母 數 推 論 73遺 傳 關 聯 性 研 究 單 套 型 與 環 境 效 應 的 半 母 數 推 論鄭 榕 鈺 1 、 曾 信 嘉 2 *1 銘 傳 大 學 應 用 統 計 資 訊 系2 國 立 嘉 義 大 學 農 藝 學 系摘 要單 套 型 是 在 某 區 塊 內 特 定 幾 個 單 核 苷 酸多 型 性 (single nucleotide polymorphism,SNP) 基 因 所 訂 定 的 序 列 。 遺 傳 關 聯 性 研 究 時 常探 索 單 套 型 與 數 量 表 現 型 間 之 關 係 。 然 而 , 因為 兩 個 同 源 單 套 型 的 組 成 無 法 區 分 ( 混 淆 基 因型 ), 導 致 單 套 型 經 常 是 不 明 確 的 情 況 。 本 文 考慮 個 體 彼 此 無 關 的 世 代 研 究 , 蒐 集 到 可 能 會 遭遇 設 限 的 事 件 時 間 與 混 淆 基 因 型 的 資 料 , 以 半母 數 加 速 失 敗 時 間 模 式 (semiparametricaccelerated failure time model) 描 述 單 套 型與 環 境 變 數 對 失 敗 時 間 之 表 現 型 的 影 響 。 有關 秩 的 推 論 被 開 發 出 來 估 計 迴 歸 參 數 與 基 礎的 存 活 函 數 , 並 由 一 些 模 擬 研 究 來 評 估 所 建議 方 法 的 表 現 。關 鍵 詞 .. 世 代 研 究 、 加 速 失 敗 時 間 模 式 、 秩估 計 量 、 單 核 苷 酸 多 型 性 、 混 淆 基因 型 。Semiparametric Inference on <strong>Haplotype</strong>and Environmental Effects inGenetic Association StudiesJung-Yu Cheng 1 and Shinn-Jia Tzeng 2 *1 Department of Applied Statistics and InformationScience, Ming Chuan University, Taoyuan 33348,Taiwan ROC2 Department of Agronomy Science, NationalChiayi University, Chiayi 60004, Taiwan ROC* 通 信 作 者 , sjtzeng@mail.ncyu.edu.tw投 稿 日 期 :2009 年 4 月 22 日接 受 日 期 :2009 年 5 月 18 日作 物 、 環 境 與 生 物 資 訊 6:73-86 (2009)Crop, Environment & Bioinformatics 6:73-86 (2009)189 Chung-Cheng Rd., Wufeng, Taichung Hsien 41362,Taiwan ROCABSTRACTA haplotype is a specific sequence ofparticular single nucleotide polymorphism (SNP)alleles in a block. Genetic association studies oftenexplore the relation between haplotypes andquantitative phenotypes. However, haplotypesare usually ambiguous because the combinationof the two homologous haplotypes cannot bederived (unphased genotype). This paperconsiders cohort studies of unrelated individualswhich collect potentially censored time-to-eventdata along with unphased genotypes, and usesthe semiparametric accelerated failure time modelfor the effects of haplotypes and environmentalvariables on the failure-time phenotype.Rank-based inferences are developed to estimateregression parameters and the baseline survivalfunction. Some simulation studies are presentedto evaluate the performance of the proposedmethods.Key words: Cohort study, Accelerated failuretime model, Rank estimator, Singlenucleotide polymorphism, Unphasedgenotype.前 言隨 著 分 子 生 物 技 術 的 日 新 月 異 , 有 愈 來愈 多 的 研 究 探 索 數 量 性 狀 與 遺 傳 基 因 的 關 聯性 。 數 量 性 狀 經 常 是 由 多 個 基 因 甚 至 與 環 境因 子 共 同 造 成 的 結 果 , 有 關 數 量 性 狀 的 遺 傳研 究 , 必 須 瞭 解 個 體 間 遺 傳 變 異 (geneticvariation) 對 表 現 型 的 影 響 , 而 單 核 苷 酸 多 型性 (single nucleotide polymorphisms, SNPs)提 供 大 量 個 體 間 遺 傳 變 異 之 訊 息 。SNPs 是 指DNA 序 列 中 單 一 核 苷 酸 位 點 的 A、 T、 C或 G 發 生 變 化 ( 通 常 要 滿 足 群 體 中 至 少 有 1%發 生 變 化 的 情 況 ), 亦 即 基 因 序 列 中 某 特 定 的
74Crop, Environment & Bioinformatics, Vol. 6, June 2009位 點 出 現 兩 種 以 上 的 核 苷 酸 。SNP 資 料 整 合大 部 分 的 遺 傳 變 異 , 因 此 適 合 取 其 作 為 數 量性 狀 遺 傳 關 聯 性 研 究 的 基 礎 。單 套 型 (haplotype) 是 連 結 某 區 塊 (block)內 各 位 點 SNPs 所 排 成 的 序 列 , 由 於 單 套 型含 有 多 重 標 記 且 納 入 連 鎖 不 平 衡 (linkagedisequilibrium) 的 訊 息 , 故 能 提 供 研 究 遺 傳關 聯 性 較 強 的 檢 定 力 (Morris and Kaplan2002, Zaykin et al. 2002, Zeng and Lin2005)。 然 而 , 若 考 慮 的 個 體 為 雙 套 (diploid),經 常 會 遭 遇 到 同 源 的 二 個 單 套 型 組 成 無 法 明確 區 分 之 現 象 , 稱 此 為 混 淆 基 因 型 (unphasedgenotype)。 更 詳 細 地 說 , 若 A 與 B 分 別 為 兩基 因 座 上 的 主 對 偶 基 因 (major alleles),a 與 b為 其 對 應 的 副 對 偶 基 因 (minor alleles), 當 蒐集 到 基 因 型 為 AaBb, 一 種 情 況 可 能 是 A 與 B同 在 一 條 染 色 體 上 ( 單 套 型 ),a 與 b 則 同 在 另一 條 染 色 體 上 , 若 將 此 情 況 記 為 AB / ab , 另一 種 情 況 可 能 為 Ab / aB 。 兩 種 情 況 的 二 個 單套 型 組 成 不 同 且 經 常 無 法 確 定 實 際 是 何 種 情況 , 故 稱 AaBb 為 混 淆 基 因 型 。 因 此 , 在 從 事單 套 型 與 遺 傳 表 現 型 的 關 聯 性 研 究 時 , 經 常必 須 解 決 上 述 在 統 計 方 法 學 上 所 謂 缺 失(missing) 資 料 之 問 題 。近 年 來 , 有 許 多 以 單 套 型 為 主 的 設 計 研究 被 廣 泛 的 發 展 與 討 論 , 如 Chen and Li(2008) 推 估 病 例 - 對 照 設 計 的 單 套 型 效 應 ;Chen and Chatterjee (2006) 探 討 摺 疊 (nested)病 例 - 對 照 設 計 的 單 套 型 關 聯 性 分 析 ;Chenand Rodriguez (2007) 考 慮 配 對 (matched) 病例 - 對 照 設 計 單 套 型 效 應 的 條 件 概 似 函 數 估計 法 。 另 外 , 在 世 代 研 究 方 面 ,Lin (2004) 以Cox 成 比 例 風 險 模 式 (Cox proportionalhazards model; 簡 稱 為 CPH 模 式 ) 配 適 單 套型 對 疾 病 發 生 時 間 之 影 響 , 並 利 用 EM 演 算法 (expectation maximization algorithm) 解決 混 淆 基 因 型 問 題 ;Chen and Chatterjee(2006) 提 出 另 外 一 種 在 計 算 上 較 簡 便 的 方 式來 估 計 CPH 模 式 中 的 參 數 。 除 了 CPH 模式 , 另 一 常 用 來 處 理 存 活 資 料 的 統 計 模 型 為加 速 失 敗 時 間 模 式 (accelerated failure timemodel; 簡 稱 為 AFT 模 式 ), 此 模 式 是 以 取 過對 數 後 的 表 現 型 來 配 適 共 變 數 (covariate), 迴歸 係 數 與 一 般 線 型 迴 歸 解 釋 相 似 。本 文 以 半 母 數 AFT 模 式 (Wei 1992) 描 述單 套 型 與 環 境 因 子 對 會 有 右 設 限 失 敗 時 間 的表 現 型 之 影 響 , 先 應 用 Excoffier and Slatkin(1995) 所 建 議 的 EM 演 算 法 , 推 估 混 淆 基 因 型下 各 單 套 型 之 頻 率 , 以 此 機 率 發 展 迴 歸 參 數有 關 秩 的 推 論 (rank-based inference), 並 提出 表 現 型 累 積 風 險 函 數 的 Nelson-Aalen 估計 量 。 最 後 , 再 透 過 統 計 模 擬 來 評 估 所 建 議估 計 方 法 的 表 現 。一 、 統 計 方 法材 料 與 方 法假 設 樣 本 中 表 現 型 數 值 為 Ti ,i = 1, K,n, 經 常 是 以 記 錄 某 關 心 事 件 發 生 時間 所 獲 得 的 數 據 。 每 筆 Ti 有 時 會 因 右 設 限 時間 Ci 而 觀 察 不 完 全 , 因 此 僅 能 蒐 集 的 時 間 資料 為 Y = min( T, C )i i i 。 定 義 指 標 變 數Δ = I( T ≤ C )i i i , 若 Δ = 1i 表 示 有 觀 察 到 關 心 的事 件 , Δ = 0i 則 無 觀 察 到 。 假 設 SNP 序 列 是由 M 個 SNPs 構 成 , 每 個 SNP 常 見 情 況 只有 兩 種 , 即 核 苷 酸 為 A 或 T (C 或 G), 分 別以 0 或 1 代 表 其 中 一 種 情 況 。 因 此 , 整 個SNP 序 列 共 有 K = 2 M 種 單 套 型 之 情 形 , 將其 集 合 為 H = { h, K , h }1 K, 並 定 義 每 種 單 套 型頻 率 的 集 合 為 f = { f , K , f }1 K。 例 如 M = 2 ,H = { h, h , h, h}=1 2 3 4 {(0,0),(0,1),(1,0),(1,1)} ,f = { f , f , f , f }1 2 3 4 。 若 考 慮 個 體 i 同 源 的 二 個 單套 型 ( 雙 套 型 ;diplotype) 為 H = { h , h}, 其 中i r sh ∈ H , l = r,s, 但 實 際 觀 察 到 的 二 個 單 套 型l經 常 是 混 淆 的 , 即 混 淆 基 因 型 為 G = h + h ,i r s此 時 , 若 有 二 個 以 上 SNP 位 點 出 現 異 質 性(heterozygous), 即 無 法 由 Gi 來 確 定 Hi 。 如考 慮 M = 3 , G = (1,1, 2)i , 則 Hi 可 能 為((0,0,1),(1,1,1)) 或 ((1,0,1),(0,1,1))。 因 此 , 將 符 合G 的 所 有 可 能iH 集 合 為 SG ( )ii , 如S ((1,1, 2)) = {((0,0,1),(1,1,1)),((1, 0,1),(0,1,1))} 。
單 套 型 與 環 境 效 應 的 半 母 數 推 論 75在 研 究 中 , 是 以 半 母 數 AFT 模 式 來 配 適單 套 型 與 環 境 因 子 對 表 現 型 之 關 係 , 模 式 為logT = β′X + ε , i = 1, K,n (1)i 0 i i**若 令 T = logTii , 則 T = β′X + εi 0 i i, 此 模 式為 常 見 線 性 迴 歸 表 示 法 。 模 式 中 的 β0 為p ×1的 迴 歸 係 數 , X i 分 別 由 二 個 單 套 型Hi 的 函 數HXi , 環 境 因 子 Zi 與 兩 者 之 交H感 效 應 ϕ( X , Z )i i 所 組 成 的 共 變 數 向 量 ,HH即 X = [ X , Z , ϕ ( X , Z )]′i i i i i , 又 ε i 為 非 特 定(unspecified) 分 配 的 誤 差 項 , 以 至 於 模 式(1) 為 未 限 定 表 現 型 分 配 之 半 母 數 模 式 。 若*h 為 研 究 感 興 趣 的 單 套 型 且 H = ( h , h )i r s ,Lin and Zeng (2006) 介 紹 幾 個 常 用 的 遺傳 模 式 : 隱 性 模 式 (recessive model) 取H*X = I( h = h = h )i r s ; 顯 性 模 式 (dominant model)H* * *取 X = I( h = h ) + I( h = h ) − I( h = h = h )i r s r s ;累 加 性 模 式 (additive model) 取H* *X = I( h = h ) + I( h = h )i r s; 共 顯 性 模 式 (codominantH* * *model) 取 X = [ I( h = h ) + I( h = h ), I( h = h = h )]i r s r s,其 中 I () ⋅ 為 指 示 變 數 。 舉 例 說 , 若 考 慮 共 顯 性模 式 且 有 環 境 因 子 與 基 因 - 環 境 交 感 效 應 , 半母 數 AFT 模 式 可 表 示 為log T = β { I( h = h ) + I( h = h )} + β I( h = h = h )* * *i 01 r s 02 r s* *+ β′ Z + β′{ Ih ( = h) + Ih ( = h)}Z03 i 04 r s i*+ β′Ih ( = h= h)Z + ε 。05 r s i i同 樣 地 , 亦 可 將 其 他 的 遺 傳 模 式 加 入 環 境 因子 與 基 因 - 環 境 交 感 效 應 。若 令 e( β) = log Y − βX ′i i i與 R ( β; t) = I{ e( β ) ≥t},ii在 非 訊 息 設 限 下 ,Kalbfleisch and Prentice(2002) 與 Jin et al. (2003) 由 誤 差 形 成 秩 向 量(rank vector) 所 構 成 的 聯 合 機 率 , 提 出 模 式 (1)中 β0 的 估 計 式 :∑ n φi i ⎣ i ii=1nni= i i i=iU ( β) = Δ { β; e( β)} ⎡X − X( β; e( β )) ⎤φ⎦ (2)其 中 X ( β; t ) R ( β; t ) X R ( β ; t ),φ 為 事1 1先 選 定 的 權 重 函 數 , 常 用 的 有 φ ≡ 1 與−1φ ≡ n ∑ n R( β ; t)i=1 i , 此 時 估 計 式 分 別 稱 為= ∑ ∑log-rank (Mantel 1966) 與 Gehan (1965) 統 計量 。 為 求 簡 便 地 估 計 β0, 本 文 使 用 Gehan 權重 函 數 , 因 此 式 子 (2) 可 化 簡 為1( ) = −∑∑n nΔ ( − ) { ( ) ≤ ( )}G i i j i ji= 1 j=1U β n X X I e β e β (3)然 而 , 因 為 有 混 淆 基 因 型 的 問 題 , 不 能 完 全H確 定 X 或 X 向 量 中 的 數 值 , 因 此 無 法 使 用 式ii子 (3) 來 對 β0 進 行 估 計 , 以 下 介 紹 使 用 某 條 件H期 望 值 來 取 代 Xi , 進 而 發 展 β0 的 估 計 程 序 。在 估 計 β0 的 過 程 中 , 先 以 Excoffier andSlatkin (1995) 的 EM 演 算 法 估 計 單 套 型 頻H率 , 藉 由 這 些 機 率 求 取 Xi 的 條 件 期 望 值 , 再將 條 件 期 望 值 代 入 式 子 (3) 估 計 β0 。 假 設 滿 足哈 - 溫 平 衡 (Hardy-Weinberg equilibrium),以 Lin (2004) 機 率 的 表 示 法 為Pr{ H = ( h , h )} ≡ f = f fi r s rs r s, 其 中 fr 為 單 套 型 hr之 頻 率 , r = 1, K,K。 考 慮 給 定 觀 察 基 因 型 Gi 下的 雙 套 型 機 率 ψ = Pr{ H = ( h , h ) | G }irs i r s i 可 推 導得ψirs=I{( h , h ) ∈ S( G)}f fI h h S G f f (4){(′, ′) ∈ ( )}r s i r′ s′∑ r s i r sr′ , s′若 ψ irs 的 估 計 值 為 ψˆirs , 可 獲 得 單 套 型 機 率 的 估計 值 為ˆf rn K ψ ˆi= 1 s=1 irs= ∑ ∑n, r = 1, K,K (5)整 個 估 計 fr 的 過 程 : 先 選 定 一 組 起 始 值ˆ(0) ˆ(0)(1)( f , K, f )1K , 由 式 子 (4) 可 獲 得 ψˆ irs , 再 透 過 式(1) (1)子 (5) 更 新 得 ( fˆ, K, f ˆ )1K , 如 此 迭 代 至 估 計 值 收斂 為 止 。 在 獲 得 f ˆ = ( fˆ, K , fˆ)1 K 後 , 由 式 子 (4) 計 算Hψˆirs , 可 得 Xi 的 條 件 期 望 值 為 ˆ HHX = Eˆ ( )i fXi( r, s),如 顯 性 模 式ˆ HHX = ˆi ∑ X ψrs , i( r, s)irs ,H* * *X = Ih ( = h) + Ih ( = h) − Ih ( = h= h)i( r, s) r s r s 。 最後 , 將 Xi 以 ˆ ˆ H[ , , ( ˆ HX = X Z ϕ X , Z )]′i i i i i 取 代 並 代 入式 子 (3), 可 得 β0 的 估 計 式 為ˆ −1= ∑∑n nΔ ˆ − ˆ ˆ ≤ ˆG i i j i ji= 1 j=1U ( β) n ( X X ) I{ e( β) e ( β )} (6)
76Crop, Environment & Bioinformatics, Vol. 6, June 2009其 中 eˆ ( β) = log Y − βX ′ ˆi i i。 最 後 , 求 解 式 子 (6) 的根 可 獲 得 β0 的 估 計 量 為ˆβ0 。再 者 , 考 慮 基 礎 累 積 風 險 函 數 Λ () tε 的 估計 , 最 直 覺 方 式 是 使 用 Nelson-Aalen 估 計 量nˆ Ie ( ˆ ≤t)Δ()i iΛ t =εni=1Ie ( ˆ ≥ eˆ)∑∑j=1j其 中 eˆ= logY − βˆ ′ X ˆi i 0 i , i = 1, K,n, 為 殘 差 項(residual)。 然 而 , 在 以 Λ ˆε () t 估 計 Λ () tε 的過 程 中 , 是 使 用 ˆf 為 機 率 將 一 些 不 確 定 真H值 的 Xi 以 其 均 值 X ˆ Hi 來 取 代 , i = 1, K,n,以 至 於 ˆ ˆ Hˆ log [ , , ( ˆ He = Y − β′ × X Z ϕ X , Z )]′i i 0 i i i i為 區 間 a = log Y − βˆ′ × [0, Z , ϕ(0, Z )]′i i 0i i 與b = log Y − βˆ′ × [1, Z , ϕ(1, Z )]′i i 0i i 區 間 內 的 期 望 落 點HH( Xi 以 顯 性 模 式 為 例 , 則 Xi 的 數 值 僅 有 0 與1 兩 種 ), i = 1, K,n。 因 為 估 計 式 (6) 為 期 望 值為 0 的 計 分 函 數 (score function), 上 述 取 代方 式 用 在 β0 之 估 計 是 可 行 的 , 但 在 估 計 每 個點 的 Λ () tε 值 時 , 以 此 期 望 落 點 方 式 所 建 立 的估 計 函 數 Λ ˆε () t 在 某 些 情 況 下 將 會 出 現 偏 誤( 見 模 擬 研 究 與 結 果 )。 最 簡 單 的 解 決 方 式 是 在估 計 Λ () tε 值 時 , 從 樣 本 n 中 選 擇 能 真 正 確 定HXi 真 值 的 子 樣 本 Ω⊂{1, 2, K , n}, 同 樣 以 顯 性模 式 為 例 , 取 Ω= { k: XˆHk= 0 或 1} , 以 此 建 立Λ () tε 的 估 計 式 為Ie ( ˆ ≤t)Δk kΛ % () t =ε∈Ω Ie ( ˆ ≥ eˆ) 。∑ ∑k j kj∈Ω另 外 , 透 過 模 式 (1) 的 假 設 , 可 進 一步 獲 得 某 特 定 共 變 數 X 下 累 積 風 險 函 數Λ () tX 的 估 計 量 Λ ˆ () t =Λˆ(log t−βˆ′ X )X ε 0 或Λ % () t =Λ% (log t−βˆ′ X )Xε 0 ; 而 由 存 活 函 數 與 累 積 風險 函 數 之 關 係 S () t = Pr( ε > t) = exp{ −Λ ()} tεε, 可 得估 計 量 為 Sˆ() t = exp{ −Λ ˆ ()} tεε或 S% () t = exp{ −Λ% ()} t 。εε整 體 來 說 , 本 文 的 估 計 程 序 , 在 獲 得 ˆf 後 , β 0與 Λ () tε 的 估 計 不 用 經 由 迭 代 過 程 所 得 , 為 一種 簡 便 的 估 計 方 法 。二 、 模 擬 研 究本 節 考 慮 由 四 個 SNPs 所 構 成 的 序 列下 , 以 半 母 數 AFT 模 式 描 述 單 套 型 、 環 境 因i子 與 兩 者 間 交 感 效 應 對 表 現 型 性 狀 之 影 響 ,使 用 電 腦 模 擬 的 方 式 評 估 模 式 中 參 數 β0 與 存活 函 數 S ε() ⋅ 估 計 量 的 表 現 。 在 此 , 考 慮 Chenand Chatterjee (2006) 所 設 定 個 體 中 可 能 出現 單 套 型 與 其 頻 率 整 理 在 Table 1, 如 Chenand Chatterjee (2006) 所 述 可 將 “0” 視 為 野生 型 (wild-type) , 而 “1 ” 視 為 突 變 型(variant) 對 偶 基 因 。 考 慮 觀 察 的 個 體 為 混 淆的 雙 套 資 料 , 即 二 個 位 點 以 上 出 現 異 質 性 則無 法 明 確 區 分 二 個 單 套 型 的 型 態 , 但 研 究 感*興 趣 的 是 單 套 型 h 、 環 境 因 子 Z 與 兩 者 之 間交 感 效 應 對 表 現 型 之 影 響 。 設 定 顯 性 效 應 模式 為* * *log T = β { I( h = h ) + I( h = h ) − I( h = h = h )} + β Z01 r s r s02* * *+ β { I( h = h ) + I( h = h ) − I( h = h = h )} Z + ε 。03r s r s因 為 一 些 研 究 顯 示 估 計 量 在 稀 少 單 套 型 (rarehaplotype) 下 會 較 不 準 確 (Tishkoff et al.2000)。 因 此 這 裡 分 別 考 慮 兩 種 感 興 趣 的 單 套*型 h :“0001 ” 為 普 遍 單 套 型 (commonhaplotype) 的 情 況 而 “1010” 代 表 稀 少 單 套型 ; Z 為 機 率 0.5 的 伯 努 利 (Bernoulli) 分 配 ,其 數 值 為 0 與 1, 分 別 代 表 兩 種 不 同 環 境 ;ε選 擇 標 準 常 態 與 標 準 極 值 (standard extremevalue) 分 配 , 使 得 對 應 的 表 現 型 具 有 對 數 常 態與 韋 伯 兩 種 分 配 形 式 , 用 以 檢 驗 所 建 議 的 方法 對 不 同 表 現 型 分 配 是 否 具 有 穩 健 性 或 強 韌性 (robustness)。在 此 , 考 慮 本 文 的 估 計 方 法 在 四 種 參 數組 合 ( β , β , β , σ )01 02 03 下 的 模 擬 表 現 : 分 別 為Table 1. <strong>Haplotype</strong> frequencies for simulationstudies.<strong>Haplotype</strong>Frequency0001 0.2980000 0.2670101 0.1521010 0.1170100 0.0990010 0.0341100 0.032
單 套 型 與 環 境 效 應 的 半 母 數 推 論 77(0,0,0,0.4)、(0.8,1.4,0.4,0.6)、(1.2,-1.2,0.6,0.6)及 (2.0,1.0,0.8,0.6), 且 每 種 參 數 組 合 又 模 擬 生成 完 整 資 料 (complete data) 與 右 設 限 資 料(right-censored data) 兩 種 型 態 , 其 中 完 整 資料 分 別 取 樣 本 大 小 n 為 200 與 1,000, 用 以 觀察 增 加 樣 本 數 的 估 計 效 率 ; 右 設 限 資 料 取 n為 200, 右 設 限 變 數 C 設 定 為 (0, τ ) 的 均 勻 分配 , 所 選 的 τ 值 造 成 資 料 約 有 20% 與 40% 兩種 比 例 發 生 右 設 限 。 以 上 各 種 組 合 資 料 重 複模 擬 1,000 次 , 並 以 本 文 所 提 的 方 法 加 以 估計 , 將 迴 歸 係 數 估 計 量 β ˆ = ( ˆ β , ˆ β , ˆ β ) 的 偏 誤0 01 02 03與 標 準 差 整 理 成 Table 2 至 Table 5, 另 外 ,選 取 對 數 常 態 與 韋 伯 兩 種 表 現 型 , 在 n 為 200且 設 限 比 率 為 20% 的 四 種 參 數 組 合 , 將 ε 存活 函 數 估 計 量 S ˆε () t 與 S% () t 的 模 擬 結 果 繪 圖ε如 Fig. 1 至 Fig. 8。結 果首 先 , 探 討 普 遍 單 套 型 在 對 數 常 態 表 現型 下 的 參 數 估 計 結 果 。 觀 察 Table 2 設 限 比 率為 0% 的 完 整 資 料 , 在 樣 本 數 n 為 200 時 , 發現 各 參 數 估 計 量 ˆβ01 、 02ˆβ 與 ˆβ03 的 偏 誤 介 於-0.008 至 0.005 之 間 , 估 計 量 呈 現 出 接 近 不 偏的 特 性 。 當 n 增 加 為 1,000 時 , 01ˆβ 、 02ˆβ 與 ˆβ03的 偏 誤 介 於 -0.005 至 0.004 之 間 , 偏 誤 範 圍 略微 縮 小 , 而 計 算 樣 本 數 1,000 對 200 估 計 量 的相 對 效 率 (relative efficiency; 兩 估 計 量 變 異2數 sd 倒 數 之 比 值 ), 以 RE( n :1000 200) 表 示 ,其 值 介 於 4.914 至 5.444 之 間 , 說 明 了 增 加 樣本 數 所 提 升 的 估 計 效 率 。 接 著 , 探 討 右 設 限資 料 的 估 計 表 現 , 由 Table 2 設 限 比 率 20%的 模 擬 結 果 , 各 估 計 量 偏 誤 介 於 -0.012 至0.027 之 間 。 當 設 限 比 率 增 加 到 40% 時 , 偏 誤範 圍 稍 有 擴 大 , 介 於 -0.033 至 0.019 之 間 , 而兩 種 設 限 比 率 的 相 對 效 率 RE( cp : 40% 20%)介 於 0.283 至 0.974 之 間 。Table 3 呈 現 稀 少 單 套 型 在 對 數 常 態 表現 型 下 的 模 擬 結 果 , 由 n 為 200 的 完 整 資 料*Table 2. Simulation results for estimating the effects of haplotype ( h = 0001) , environment, andhaplotype-environment interaction with the phenotype be the log-normal distribution.SetupBias (sd) xn cp y β β β01 02 03 σ ˆβ ˆβ ˆβ010203200 0% 0.0 0.0 0.0 0.4 -0.002 (0.089) -0.001 (0.087) 0.000 (0.123)200 0% 0.8 1.4 0.4 0.6 -0.005 (0.133) -0.005 (0.135) 0.002 (0.184)200 0% 1.2 -1.2 0.6 0.6 -0.005 (0.133) -0.008 (0.140) 0.003 (0.184)200 0% 2.0 1.0 0.8 0.6 -0.004 (0.133) -0.003 (0.149) 0.005 (0.185)1000 0% 0.0 0.0 0.0 0.4 -0.000 (0.040) 0.001 (0.039) -0.001 (0.054)1000 0% 0.8 1.4 0.4 0.6 -0.003 (0.057) -0.001 (0.059) 0.004 (0.081)1000 0% 1.2 -1.2 0.6 0.6 0.000 (0.060) -0.001 (0.061) 0.000 (0.081)1000 0% 2.0 1.0 0.8 0.6 0.002 (0.060) -0.005 (0.065) 0.001 (0.082)200 20% 0.0 0.0 0.0 0.4 -0.002 (0.097) -0.001 (0.095) -0.002 (0.132)200 20% 0.8 1.4 0.4 0.6 -0.004 (0.136) -0.009 (0.141) 0.002 (0.198)200 20% 1.2 -1.2 0.6 0.6 0.005 (0.147) -0.011 (0.143) -0.004 (0.195)200 20% 2.0 1.0 0.8 0.6 0.002 (0.136) -0.012 (0.149) 0.027 (0.202)200 40% 0.0 0.0 0.0 0.4 -0.002 (0.105) 0.000 (0.104) -0.002 (0.146)200 40% 0.8 1.4 0.4 0.6 -0.002 (0.142) -0.011 (0.149) 0.006 (0.245)200 40% 1.2 -1.2 0.6 0.6 0.019 (0.176) -0.018 (0.149) -0.012 (0.222)200 40% 2.0 1.0 0.8 0.6 0.015 (0.148) -0.033 (0.151) 0.006 (0.380)x The empirical Monte-Carlo standard deviations of 1,000 estimators are shown in parentheses.y Censoring probability.
78Crop, Environment & Bioinformatics, Vol. 6, June 2009Table 3. Simulation results for estimating the effects of haplotype (h * = 1010), environment, andhaplotype-environment interaction with the phenotype be the log-normal distribution.SetupBias (sd) xn cp y β β β01 02 03 σ ˆβ ˆβ ˆβ010203200 0% 0.0 0.0 0.0 0.4 -0.000 (0.099) -0.001 (0.065) -0.002 (0.144)200 0% 0.8 1.4 0.4 0.6 0.000 (0.150) -0.001 (0.098) -0.001 (0.218)200 0% 1.2 -1.2 0.6 0.6 0.002 (0.150) -0.001 (0.098) 0.001 (0.219)200 0% 2.0 1.0 0.8 0.6 0.006 (0.151) -0.001 (0.098) 0.004 (0.220)1000 0% 0.0 0.0 0.0 0.4 -0.000 (0.046) 0.001 (0.029) 0.000 (0.062)1000 0% 0.8 1.4 0.4 0.6 0.000 (0.069) 0.001 (0.044) 0.003 (0.094)1000 0% 1.2 -1.2 0.6 0.6 0.001 (0.069) -0.001 (0.044) 0.005 (0.094)1000 0% 2.0 1.0 0.8 0.6 0.006 (0.069) 0.002 (0.044) 0.005 (0.097)200 20% 0.0 0.0 0.0 0.4 0.000 (0.106) -0.002 (0.072) 0.001 (0.151)200 20% 0.8 1.4 0.4 0.6 -0.001 (0.153) -0.003 (0.104) 0.015 (0.254)200 20% 1.2 -1.2 0.6 0.6 0.006 (0.178) -0.001 (0.103) 0.001 (0.245)200 20% 2.0 1.0 0.8 0.6 0.005 (0.165) -0.003 (0.103) -0.078 (0.283)200 40% 0.0 0.0 0.0 0.4 0.003 (0.118) -0.001 (0.080) -0.001 (0.167)200 40% 0.8 1.4 0.4 0.6 0.000 (0.164) -0.003 (0.115) -0.082 (0.272)200 40% 1.2 -1.2 0.6 0.6 -0.004 (0.233) -0.002 (0.113) 0.020 (0.304)200 40% 2.0 1.0 0.8 0.6 0.048 (0.206) 0.008 (0.105) — zx The empirical Monte-Carlo standard deviations of 1,000 estimators are shown in parentheses.y Censoring probability.z The effect of haplotype-environment interaction in the model is ignored.數 據 得 知 , 各 估 計 量 偏 誤 介 於 -0.002 至 0.006之 間 ; n 為 1,000 時 偏 誤 在 -0.001 至 0.006 之間 , 兩 者 範 圍 相 差 不 大 , 而 相 對 效 率RE( n :1000 200) 則 介 於 4.632 至 5.428 之 間 ,n為 1,000 的 估 計 效 率 約 為 200 的 五 倍 。 另 外 ,欲 比 較 完 整 資 料 分 別 在 普 遍 與 稀 少 單 套 型 的估 計 情 形 , 可 觀 察 Table 2 與 Table 3 的 數據 ,n 為 200 與 1,000 的 偏 誤 範 圍 相 差 不 大 ,*相 對 效 率 RE( h : 0001 1010) 在 n 為 200 時 介於 0.433 至 1.417 之 間 ; n 為 1,000 時 在0.458 至 1.465 之 間 , 且 不 論 n 為 200 或 是1,000, 01ˆβ 與 ˆβ03 在 普 遍 單 套 型 有 較 高 的 估 計效 率 , 而 ˆβ02 在 此 情 況 的 估 計 效 率 卻 較 小 。接 著 , 觀 察 設 限 比 率 20% 的 模 擬 結 果 , 若 與Table 2 模 擬 結 果 比 較 , 發 現 偏 誤 範 圍 有 增大 的 情 形 , 介 於 -0.078 至 0.015 之 間 , 最 嚴重 的 偏 誤 -0.078 產 生 在 參 數 組 合( β , β , β , σ ) = (2.0,1.0,0.8,0.6)01 02 03下 的 ˆβ03, 這 是因 為 β03 是 共 變 數 X = X × Z3 1 的 迴 歸 係 數 , 其* * *中 X = {( I h = h ) + I( h = h ) − I( h = h = h )}1 r s r s , 由於 模 擬 設 定 的 關 係 ( 低 頻 率 單 套 型 且 參 數效 應 大 ( β , β , β ) = (2.0,1.0,0.8)01 02 03) , 大 多 數X = 13 , 即 X = 11 且 Z = 1的 表 現 型 值 均 受 到 右設 限 而 無 法 完 整 觀 察 , 造 成 在 估 計 β03 時 有較 大 的 偏 差 , 甚 至 在 迭 代 過 程 無 法 收 斂 。 此現 象 在 設 限 比 率 40% 時 更 加 嚴 重 , 造 成 參 數組 合 ( β , β , β , σ ) = (2.0,1.0,0.8,0.6)01 02 03重 複 模 擬1,000 次 的ˆβ03 大 多 數 因 發 散 而 無 法 獲 得 ,因 此 這 裡 捨 棄 模 式 中 單 套 型 與 環 境 的 交感 效 應 , 僅 估 計 個 別 的 單 套 型 與 環 境 效應 。 當 設 限 比 率 為 40% 時 ( 參 數 組 合( β , β , β , σ ) = (2.0,1.0,0.8,0.6)01 02 03不 作 比 較 ), 偏 誤範 圍 擴 大 至 -0.082 至 0.020 之 間 , 而 相 對 效 應RE( cp : 40% 20%) 則 降 至 0.584 至 0.872 之 間 。*Table 4 為 韋 伯 表 現 型 在 h = 0001的 模 擬結 果 , 由 完 整 資 料 在 n 為 200 的 偏 誤 介 於-0.011 至 0.006; n 為 1,000 則 介 於 -0.010 至0.005, 若 與 Table 2 對 數 常 態 表 現 型 相 比 較 ,發 現 韋 伯 表 現 型 的 偏 誤 範 圍 略 微 擴 大 。 但 整體 來 看 , 各 種 參 數 估 計 量 的 偏 誤 值 皆 不 嚴
單 套 型 與 環 境 效 應 的 半 母 數 推 論 79重 , 故 仍 保 有 不 偏 性 , 此 結 果 也 說 明 了 本 文的 估 計 方 法 對 不 同 表 現 型 分 配 具 有 穩 健 性 或強 韌 性 。 另 外 , 計 算 對 數 常 態 對 韋 伯 表 現 型的 相 對 效 率 RE (dist.: log-normal Weibull) , 在n 為 200 時 , 其 值 介 於 1.182 至 1.465 之 間 ;n 為 1,000 則 介 於 1.216 至 1.434 之 間 , 對 數常 態 表 現 型 有 較 高 的 估 計 效 率 。 當 韋 伯 表 現型 的 設 限 比 率 為 20% 時 , 偏 誤 在 -0.015 至0.025 之 間 ; 設 限 比 率 為 40% 時 , 偏 誤 介 於-0.031 至 0.027 之 間 , 且 同 樣 有 設 限 比 率 增 加會 降 低 估 計 效 率 之 現 象 , 又 與 Table 2 相 同 參數 組 合 的 估 計 結 果 相 比 較 , 對 數 常 態 表 現 型在 有 右 設 限 情 況 下 依 然 具 有 較 高 的 估 計 效*率 。Table 5 呈 現 韋 伯 表 現 型 在 h = 1010 的 統計 模 擬 , 此 部 分 的 結 果 與 估 計 表 現 類 似 先 前的 結 論 , 在 此 省 略 不 再 詳 述 。接 著 , 探 討 存 活 函 數 估 計 量 S ˆε () t 與 S%() tε的 模 擬 表 現 ,Fig. 1 至 Fig. 8 的 實 線 是 就 設 定情 況 下 所 計 算 出 的 真 正 存 活 函 數 曲 線 , 而 虛線 則 是 重 複 1,000 次 所 獲 得 1,000 個 S ˆε () t 與S % () tε 估 計 值 平 均 所 繪 出 的 估 計 曲 線 及 95% 信賴 區 間 。Fig. 1 與 Fig. 2 分 別 考 慮 對 數 常 態 表現 型 在 無 單 套 型 效 應 ( β = 001 ) 與 單 套 型 效 應小 ( β = 0.801 ) 的 情 況 , 圖 形 顯 示 出 兩 估 計 量S ˆε () t 與 S % () tε 的 平 均 估 計 曲 線 與 真 正 存 活 函 數接 近 重 疊 , 只 在 曲 線 的 末 端 出 現 些 微 的 差距 。 這 是 因 為 資 料 有 20% 的 比 率 發 生 右 設限 , 使 得 Nelson-Aalen 估 計 量 原 本 就 無 法 對末 端 的 點 進 行 估 計 。 因 此 , 在 此 情 況 下 , S ˆ () tε與 S % () tε 具 有 不 偏 性 。 然 而 , 隨 著 單 套 型 效 應增 大 ( β = 1.201 與 2.0), 由 Fig. 3 與 Fig. 4 的 (a)圖 , 可 看 出 估 計 量 S ˆε () t 的 偏 誤 愈 形 明 顯 , 其原 因 如 先 前 所 述 , 會 造 成 S ˆε () t 低 估 前 端 點 存活 函 數 與 高 估 後 端 點 存 活 函 數 的 結 果 , 而 利用 子 樣 本 Ω 所 獲 得 的 S % () tε 則 不 會 產 生 如 此 偏誤 。Fig. 5 至 Fig. 8 為 韋 伯 表 現 型 的 結 果 , 此時 誤 差 項 ε 為 標 準 極 值 分 配 , 為 一 偏 斜 非 對稱 的 分 配 。 不 過 , 因 為 本 文 提 出 的 是 不 需 限定 誤 差 項 分 配 的 半 母 數 推 論 , 故 使 用 子 樣 本Ω 所 獲 得 的 S % () t 分 別 在 四 種 參 數 組 合 下 , 依εTable 4. Simulation results for estimating the effects of haplotype (h * = 1010), environment, andhaplotype-environment interaction with the phenotype be the Weibull distribution.SetupBias (sd) xn cp y β β β01 02 03 σ ˆβ ˆβ ˆβ010203200 0% 0.0 0.0 0.0 0.4 0.005 (0.106) 0.003 (0.096) -0.007 (0.143)200 0% 0.8 1.4 0.4 0.6 0.005 (0.159) 0.002 (0.149) -0.011 (0.217)200 0% 1.2 -1.2 0.6 0.6 0.005 (0.160) -0.000 (0.153) -0.009 (0.219)200 0% 2.0 1.0 0.8 0.6 0.006 (0.161) -0.004 (0.162) -0.007 (0.221)1000 0% 0.0 0.0 0.0 0.4 0.000 (0.045) -0.001 (0.043) 0.002 (0.064)1000 0% 0.8 1.4 0.4 0.6 0.000 (0.068) -0.004 (0.066) 0.003 (0.096)1000 0% 1.2 -1.2 0.6 0.6 0.001 (0.069) -0.007 (0.068) 0.004 (0.097)1000 0% 2.0 1.0 0.8 0.6 0.002 (0.069) -0.010 (0.072) 0.005 (0.098)200 20% 0.0 0.0 0.0 0.4 0.005 (0.119) 0.006 (0.110) -0.010 (0.163)200 20% 0.8 1.4 0.4 0.6 0.004 (0.168) -0.001 (0.160) -0.005 (0.249)200 20% 1.2 -1.2 0.6 0.6 0.016 (0.187) -0.004 (0.163) -0.015 (0.250)200 20% 2.0 1.0 0.8 0.6 0.012 (0.171) -0.014 (0.168) 0.025 (0.264)200 40% 0.0 0.0 0.0 0.4 0.005 (0.138) 0.007 (0.128) -0.010 (0.188)200 40% 0.8 1.4 0.4 0.6 0.007 (0.185) -0.002 (0.184) 0.005 (0.335)200 40% 1.2 -1.2 0.6 0.6 0.030 (0.249) -0.010 (0.182) -0.022 (0.312)200 40% 2.0 1.0 0.8 0.6 0.027 (0.196) -0.023 (0.176) -0.031 (0.418)x The empirical Monte-Carlo standard deviations of 1,000 estimators are shown in parentheses.y Censoring probability.
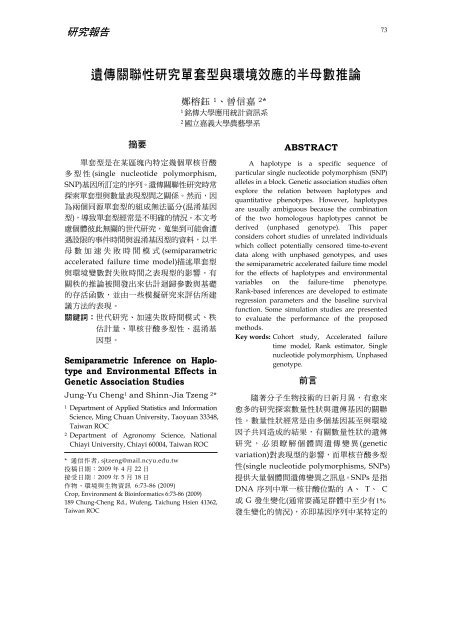
80Crop, Environment & Bioinformatics, Vol. 6, June 2009Table 5. Simulation results for estimating the effects of haplotype (h * = 1010),, environment, andhaplotype-environment interaction with the phenotype be the Weibull distribution.SetupBias (sd) xn cp y β β β01 02 03 σ ˆβ ˆβ ˆβ010203200 0% 0.0 0.0 0.0 0.4 -0.005 (0.119) -0.001 (0.076) 0.003 (0.163)200 0% 0.8 1.4 0.4 0.6 -0.007 (0.179) -0.002 (0.114) 0.007 (0.246)200 0% 1.2 -1.2 0.6 0.6 -0.006 (0.179) -0.002 (0.114) 0.009 (0.247)200 0% 2.0 1.0 0.8 0.6 -0.001 (0.180) -0.002 (0.114) 0.011 (0.249)1000 0% 0.0 0.0 0.0 0.4 0.001 (0.053) -0.000 (0.034) -0.002 (0.072)1000 0% 0.8 1.4 0.4 0.6 0.002 (0.079) 0.000 (0.051) -0.001 (0.108)1000 0% 1.2 -1.2 0.6 0.6 0.003 (0.080) -0.000 (0.051) 0.001 (0.109)1000 0% 2.0 1.0 0.8 0.6 0.008 (0.080) 0.000 (0.051) 0.003 (0.110)200 20% 0.0 0.0 0.0 0.4 -0.005 (0.134) 0.001 (0.085) 0.003 (0.184)200 20% 0.8 1.4 0.4 0.6 -0.007 (0.193) 0.001 (0.126) 0.027 (0.334)200 20% 1.2 -1.2 0.6 0.6 0.006 (0.244) -0.001 (0.123) -0.003 (0.317)200 20% 2.0 1.0 0.8 0.6 0.000 (0.208) 0.000 (0.119) 0.045 (0.429)200 40% 0.0 0.0 0.0 0.4 0.000 (0.156) 0.002 (0.099) -0.001 (0.217)200 40% 0.8 1.4 0.4 0.6 -0.003 (0.217) 0.009 (0.149) -0.022 (0.440)200 40% 1.2 -1.2 0.6 0.6 0.039 (0.383) -0.001 (0.143) -0.021 (0.472)200 40% 2.0 1.0 0.8 0.6 0.141 (0.335) 0.020 (0.127) — zx The empirical Monte-Carlo standard deviations of 1,000 estimators are shown in parentheses.y Censoring probability.z The effect of haplotype-environment interaction in the model is ignored.Fig. 1. Estimated survival function from simulated data with the phenotype be the log-normal*distribution, h = 0001 , n = 200 , cp = 20% , and ( β 01, β 02, β 03, σ ) = (0,0,0,0.4) . Solid linerepresents the true curve and dashed line represents the proposed estimate and 95%confident interval. (a) S ˆε () t ; (b) S % () t . ε
單 套 型 與 環 境 效 應 的 半 母 數 推 論 81Fig. 2. Estimated survival function from simulated data with the phenotype be the log-normal*distribution, h = 0001 , n = 200 , cp = 20% , and ( β 01, β 02, β 03, σ ) = (0.8,1.4,0.4,0.6) . Solidline represents the true curve and dashed line represents the proposed estimate and 95%confident interval. (a) S ˆε () t ; (b) S % () t .εFig. 3. Estimated survival function from simulated data with the phenotype be the log-normal*distribution, h = 0001 , n = 200 , cp = 20% , and ( β 01, β 02, β 03, σ ) = (1.2,-1.2,0.6,0.6). Solidline represents the true curve and dashed line represents the proposed estimate and 95%confident interval. (a) S ˆε () t ; (b) S % () t .ε
82Crop, Environment & Bioinformatics, Vol. 6, June 2009Fig. 4. Estimated survival function from simulated data with the phenotype be the log-normal*distribution, h = 0001 , n = 200 , cp = 20% , and ( β 01, β 02, β 03, σ ) = (2.0,1.0,0.8,0.6) . Solidline represents the true curve and dashed line represents the proposed estimate and 95%confident interval. (a) S ˆε () t ; (b) S % () t . εFig. 5. Estimated survival function from simulated data with the phenotype be the Weibull*distribution, h = 0001 , n = 200 , cp = 20% , and ( β 01, β 02, β 03, σ ) = (0,0,0,0.4) . Solid linerepresents the true curve and dashed line represents the proposed estimate and 95%confident interval. (a) S ˆε () t ; (b) S % () t . ε
單 套 型 與 環 境 效 應 的 半 母 數 推 論 83Fig. 6. Estimated survival function from simulated data with the phenotype be the Weibull*distribution, h = 0001, n = 200 , cp = 20% , and ( β , β , β , σ ) = (0.8,1.4,0.4,0.6)01 02 03. Solid linerepresents the true curve and dashed line represents the proposed estimate and 95%confident interval. (a) S ˆε () t ; (b) S % () t . εFig. 7. Estimated survival function from simulated data with the phenotype be the Weibull*distribution, h = 0001, n = 200 , cp = 20% , and ( β , β , β , σ ) =01 02 03 (1.2,-1.2,0.6,0.6). Solid linerepresents the true curve and dashed line represents the proposed estimate and 95%confident interval. (a) S ˆε () t ; (b) S % () t .ε
84Crop, Environment & Bioinformatics, Vol. 6, June 2009Fig. 8. Estimated survival function from simulated data with the phenotype be the Weibull*distribution, h = 0001 , n = 200 , cp = 20% , and ( β 01, β 02, β 03, σ ) = (2.0,1.0,0.8,0.6) . Solidline represents the true curve and dashed line represents the proposed estimate and 95%confident interval. (a) S ˆε () t ; (b) S % () t .ε然 保 有 不 偏 的 性 質 , 如 Fig. 5 至 Fig. 8 的 (b)圖 。 因 此 , S % () tε 如 同 ˆβ 對 變 更 表 現 型 分 配 ,0具 有 穩 健 或 強 韌 的 特 性 。 同 樣 地 , S ˆ () tε 在 單套 型 效 應 大 時 , 如 Fig. 7 與 Fig. 8 的 (a) 圖 ,仍 因 使 用 期 望 落 點 的 方 式 導 致 偏 誤 的 產 生 ,建 議 此 時 不 宜 採 用 。討 論本 文 探 討 數 量 性 狀 與 雙 套 混 淆 基 因 型 資料 的 關 聯 性 研 究 , 利 用 半 母 數 AFT 模 式 描 述單 套 型 , 環 境 變 數 與 交 感 效 應 對 數 量 性 狀 之影 響 。 由 模 擬 研 究 與 結 果 可 知 , 所 建 議 的 方法 在 完 整 資 料 迴 歸 係 數 估 計 上 有 不 錯 的 表現 , 而 對 右 設 限 資 料 的 參 數 估 計 時 , 隨 著 設限 比 率 的 增 加 , 會 擴 大 偏 誤 範 圍 與 降 低 估 計效 率 。 因 此 , 若 欲 分 析 的 數 量 性 狀 可 能 產 生右 設 限 , 建 議 提 高 樣 本 數 來 改 善 估 計 結 果 ,如 Lin (2004) 與 Chen and Chatterjee (2006)對 於 此 類 資 料 統 計 模 擬 所 取 的 樣 本 數 均 在1,000 以 上 , 由 於 右 設 限 資 料 的 參 數 估 計 比 較費 時 , 本 研 究 礙 於 電 腦 配 備 , 僅 能 提 供 樣 本數 200 在 全 部 組 合 的 模 擬 結 果 。 後 續 選 取 幾個 組 合 做 樣 本 數 1,000 的 參 數 估 計 , 驗 證 了 提高 樣 本 數 會 降 低 偏 誤 與 增 加 估 計 效 率 的 結果 。 此 類 研 究 之 所 以 需 要 如 此 龐 大 的 樣 本數 , 原 因 來 自 於 未 限 定 數 量 性 狀 的 分 配 形式 , 即 採 用 半 母 數 模 式 , 且 有 混 淆 基 因 型 的問 題 , 再 加 上 資 料 又 發 生 嚴 重 的 右 設 限 。 當然 , 若 是 質 量 性 狀 的 單 套 型 關 聯 性 研 究 , 則未 必 需 要 如 此 龐 大 的 樣 本 數 。 再 者 , 也 因 為混 淆 基 因 型 的 半 母 數 推 論 需 要 較 多 的 樣 本數 , 使 得 本 文 所 建 議 的 存 活 函 數 估 計 量S % () t , 不 會 有 選 到 過 少 的 樣 本 而 影 響 到 估 計ε表 現 等 問 題 。
單 套 型 與 環 境 效 應 的 半 母 數 推 論 85在 研 究 中 , 針 對 的 是 雙 套 具 混 淆 的 基 因型 資 料 , 發 展 單 套 型 對 數 量 性 狀 的 半 母 數AFT 模 式 , 然 而 , 若 蒐 集 的 資 料 可 清 楚 地 分辨 各 單 套 型 的 基 因 型 , 半 母 數 AFT 模 式 仍 然是 一 個 值 得 推 薦 且 具 吸 引 力 的 統 計 模 型 。 此H時 Xi 不 必 以 其 期 望 值 X ˆ Hi 取 代 , 使 得 整 個 參數 估 計 的 表 現 會 更 加 理 想 。 最 後 , 本 文 單 套型 頻 率 的 估 計 必 須 符 合 哈 - 溫 平 衡 之 假 設 , 若資 料 違 背 此 假 設 ,Lin and Zeng (2006) 建 議考 慮 以 下 兩 個 不 符 合 哈 - 溫 平 衡 的 模 型與f = (1 − ρ)ff+ δ ρ f,rs r s rs rfrs(1 − ρ + δ ρ)f frs r s= ,K21 − ρ + ρ ∑ fj=1 j其 中 δ = 1rr 與 δ = 0rs( r ≠ s), 參 數 ρ 為評 估 雙 套 型 與 單 套 型 之 間 , 相 關 性 或 一 致 性強 度 的 指 標 , 當 ρ = 0 時 , 兩 個 模 型 均 能 化 簡為 f = ffrs r s, 此 時 為 哈 - 溫 平 衡 的 狀 態 。 而 且 ,Lin and Zeng (2006) 證 明 { f , K , f }1 K 與 ρ 具 有可 分 辨 (identifiable) 的 性 質 , 可 透 過 混 淆 基 因型 Gi 的 分 配 唯 一 決 定 { f , K , f }1 K 與 ρ 之 數值 。 因 此 , 利 用 上 述 的 結 果 , 亦 能 將 本 文 的方 法 推 廣 到 不 符 合 哈 - 溫 平 衡 下 的 情 況引 用 文 獻Chen J, N Chatterjee (2006) <strong>Haplotype</strong>-basedassociation analysis in cohort and nestedcase-control studies. Biometrics 62: 28-35.Chen X, Z Li (2008) Inference of haplotype effectsin case-control studies using unphasedgenotype and environmental data. BiometricalJ. 50: 270-282.Chen J, C Rodriguez (2007) Conditional likelihoodmethods for haplotype-based associationanalysis using matched case-control data.Biometrics 63: 1099-1107.Excoffier L, M Slatkin (1995) Maximum-likelihoodestimation of molecular haplotype frequenciesin a diploid population. Mol. Biol. Evol. 12:921-927.Gehan EA (1965) A generalized Wilcoxon test forcomparing arbitrarily single-censored samples.Biometrika 52: 203-223.Jin Z, DY Lin, LJ Wei (2003) Rank-based inferencefor the accelerated failure time model.Biometrika 90: 341-353.Kalbfleish JD, RL Prentice (2002) The statisticalanalysis of failure time data. 2 nd ed., Wiley,New York. 231pp.Lin DY (2004) <strong>Haplotype</strong>-based associationanalysis in cohort studies of unrelatedindividuals. Genet. Epidemiol. 26: 255-264.Lin DY, D Zeng (2006) Likelihood-based inferenceon haplotype effects in genetic associationstudies. J. Amer. Statist. Assoc. 101: 89-104.Mantel N (1966) Evaluation of survival data andtwo new rank order statistics arising in itsconsiderations. Cancer Chemo. Rep. 50:163-170.Morris RW, NL Kaplan (2002) On the advantageof haplotype analysis in the presence ofmultiple disease susceptibility alleles. Genet.Epidemiol. 23: 221-233.Tishkoff SA, AJ Pakstis, G Ruano, KK Kidd (2000)The accuracy of statistical methods forestimation of haplotype frequencies: anexample from the CD4 locus. Amer. J. Hum.Genet. 67: 518-522.Wei LJ (1992) The accelerated failure time model:a useful alternative to the Cox regressionmodel in survival analysis. Statist. Med. 11:1871-1879.Zaykin DV, PH Westfall, SS Young, MA Karnoub,MJ Wagner, MG. Ehm (2002) Testingassociation of statistically inferred haplotypes
86Crop, Environment & Bioinformatics, Vol. 6, June 2009with discrete and continuous traits in samplesof unrelated individuals. Hum. Hered. 53:79-91.Zeng D, DY Lin (2005) Estimating haplotypediseaseassociations with pooled genotype data.Genet. Epidemiol. 28: 70-82.- 編 輯 : 楊 純 明