Wind Erosion in Western Queensland Australia
Modelling Land Susceptibility to Wind Erosion in Western ... - Ninti One Modelling Land Susceptibility to Wind Erosion in Western ... - Ninti One
Chapter 1 - IntroductionDowns. Wind erosion is infrequently observed outside this zone due to higher annual rainfalland vegetation cover, so that area is not considered in this study.There is a seasonal pattern in wind speeds across the study area. The highest wind speeds areassociated with southerly to south-easterly air flow (BoM, 2008). This flow is largely drivenby the movement of a baric ridge across central Australia during the winter months and anticyclonicflow around the high pressure system. Dust entrainment is associated with thepassage of cold fronts and trough lines across the study area (McGowan et al., 2000). Thefrontal systems originate in the Southern Ocean to the south-southwest of the Australiancontinent and travel north over the study area through the cols that develop betweensubsequent eastward tracking anticyclones. This synoptic setup generates strong pre-frontalnortherly winds through central Australia. Behind the fronts and/or trough lines, anticyclonicridging may generate moderate to strong south to south-easterly winds over the study areawhich are also responsible for dust entrainment (Sturman and Tapper, 2001).Rainfall seasonality varies from north to south across the study area (Figure 1.8). Thenorthern regions are influenced by the Australian Summer Monsoon, thunderstorm activityand the incursion of rainfall depressions from the east coast during the summer months. Thesouthern regions of the study area have a less pronounced summer rainfall peak and asecondary peak during winter. However, winter is generally the driest time of the year acrossthe study area.At inter-annual time scales rainfall variability across the study area is associated with the ElNiño/Southern Oscillation (ENSO) (Whetton, 1997). Pittock (1975) reported a positivecorrelation (r 2 = 0.4) between rainfall and the Southern Oscillation Index (SOI), an indicatorof the intensity of positive (La Niña) and negative (El Niño) ENSO phases, and rainfall ineastern Australia. The correlation between rainfall and the SOI varies seasonally, and isinfluenced by phase interactions of ENSO (3-7 year cycle) with the Pacific (inter-) DecadalOscillation (PDO, a 15-30 year cycle) (Crimp and Day, 2003). Consequently, episodes ofpasture degradation and recovery in the study area are linked to variations in Australianrainfall driven by ENSO-PDO interactions (McKeon et al., 2004).Land use in the study area is dominated by pastoral activity with sheep and cattle grazing ofrangelands. Sheep grazing is dominant to the east the Mitchell Grass Downs and Mulga22
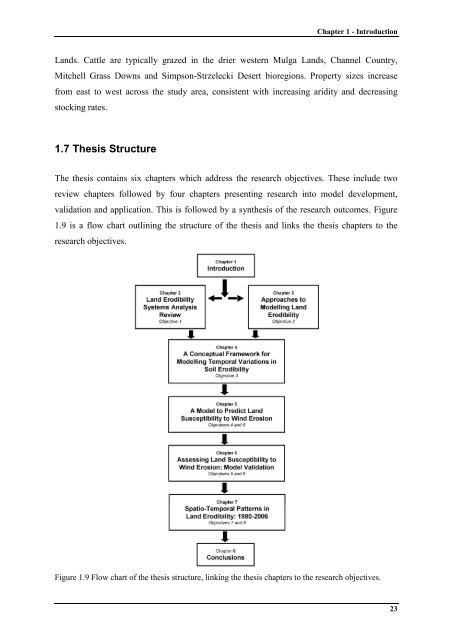
Chapter 1 - IntroductionLands. Cattle are typically grazed in the drier western Mulga Lands, Channel Country,Mitchell Grass Downs and Simpson-Strzelecki Desert bioregions. Property sizes increasefrom east to west across the study area, consistent with increasing aridity and decreasingstocking rates.1.7 Thesis StructureThe thesis contains six chapters which address the research objectives. These include tworeview chapters followed by four chapters presenting research into model development,validation and application. This is followed by a synthesis of the research outcomes. Figure1.9 is a flow chart outlining the structure of the thesis and links the thesis chapters to theresearch objectives.Figure 1.9 Flow chart of the thesis structure, linking the thesis chapters to the research objectives.23
- Page 1: Modelling Land Susceptibility toWin
- Page 4: AUSLEM was developed as a Geographi
- Page 8 and 9: who joined me on many trips, shared
- Page 10 and 11: Conference Presentations by the Aut
- Page 12 and 13: 2.2.5 Soil Moisture Effects........
- Page 14 and 15: Chapter 6: Assessing Land Susceptib
- Page 16 and 17: List of FiguresChapter 1: Introduct
- Page 18 and 19: Figure 2.11 Conceptual model of lan
- Page 20 and 21: hand column) presents trajectories
- Page 22 and 23: List of TablesChapter 1: Introducti
- Page 24 and 25: xxii
- Page 26 and 27: Chapter 1 - Introduction• The abi
- Page 28 and 29: Chapter 1 - Introductionchapter the
- Page 30 and 31: Chapter 1 - Introductionevents yr -
- Page 32 and 33: Chapter 1 - IntroductionFigure 1.2
- Page 34 and 35: Chapter 1 - Introductionsusceptibil
- Page 36 and 37: Chapter 1 - Introductiontemporal pa
- Page 38 and 39: Chapter 1 - Introduction1.5 Researc
- Page 40 and 41: Chapter 1 - IntroductionFigure 1.3
- Page 42 and 43: Chapter 1 - IntroductionMitchell Gr
- Page 44 and 45: Chapter 1 - IntroductionSimpson-Str
- Page 48 and 49: Chapter 1 - IntroductionChapter 2 p
- Page 50 and 51: Chapter 2 - Land Erodibility Contro
- Page 52 and 53: Chapter 2 - Land Erodibility Contro
- Page 54 and 55: Chapter 2 - Land Erodibility Contro
- Page 56 and 57: Chapter 2 - Land Erodibility Contro
- Page 58 and 59: Chapter 2 - Land Erodibility Contro
- Page 60 and 61: Chapter 2 - Land Erodibility Contro
- Page 62 and 63: Chapter 2 - Land Erodibility Contro
- Page 64 and 65: Chapter 2 - Land Erodibility Contro
- Page 66 and 67: Chapter 2 - Land Erodibility Contro
- Page 68 and 69: Chapter 2 - Land Erodibility Contro
- Page 70 and 71: Chapter 2 - Land Erodibility Contro
- Page 72 and 73: Chapter 2 - Land Erodibility Contro
- Page 74 and 75: Chapter 2 - Land Erodibility Contro
- Page 76 and 77: Chapter 2 - Land Erodibility Contro
- Page 78 and 79: Chapter 2 - Land Erodibility Contro
- Page 80 and 81: Chapter 2 - Land Erodibility Contro
- Page 82 and 83: Chapter 2 - Land Erodibility Contro
- Page 84 and 85: Chapter 2 - Land Erodibility Contro
- Page 86 and 87: Chapter 2 - Land Erodibility Contro
- Page 88 and 89: Chapter 2 - Land Erodibility Contro
- Page 90 and 91: Chapter 2 - Land Erodibility Contro
- Page 93 and 94: Chapter 3 - Modelling Land Erodibil
- Page 95 and 96: Chapter 3 - Modelling Land Erodibil
Chapter 1 - IntroductionLands. Cattle are typically grazed <strong>in</strong> the drier western Mulga Lands, Channel Country,Mitchell Grass Downs and Simpson-Strzelecki Desert bioregions. Property sizes <strong>in</strong>creasefrom east to west across the study area, consistent with <strong>in</strong>creas<strong>in</strong>g aridity and decreas<strong>in</strong>gstock<strong>in</strong>g rates.1.7 Thesis StructureThe thesis conta<strong>in</strong>s six chapters which address the research objectives. These <strong>in</strong>clude tworeview chapters followed by four chapters present<strong>in</strong>g research <strong>in</strong>to model development,validation and application. This is followed by a synthesis of the research outcomes. Figure1.9 is a flow chart outl<strong>in</strong><strong>in</strong>g the structure of the thesis and l<strong>in</strong>ks the thesis chapters to theresearch objectives.Figure 1.9 Flow chart of the thesis structure, l<strong>in</strong>k<strong>in</strong>g the thesis chapters to the research objectives.23


