Wind Erosion in Western Queensland Australia
Modelling Land Susceptibility to Wind Erosion in Western ... - Ninti One
Modelling Land Susceptibility to Wind Erosion in Western ... - Ninti One
You also want an ePaper? Increase the reach of your titles
YUMPU automatically turns print PDFs into web optimized ePapers that Google loves.
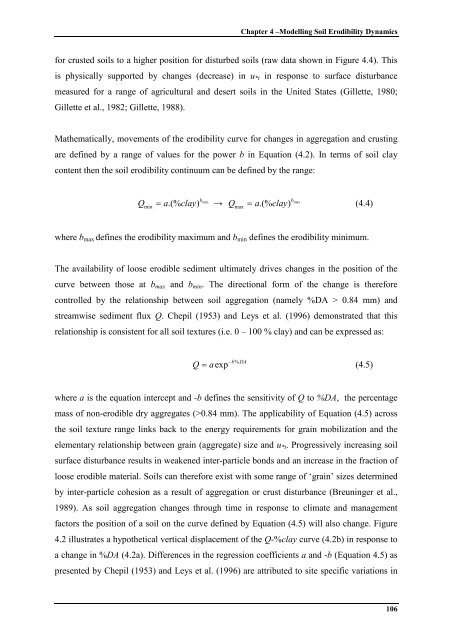
Chapter 4 –Modell<strong>in</strong>g Soil Erodibility Dynamicsfor crusted soils to a higher position for disturbed soils (raw data shown <strong>in</strong> Figure 4.4). Thisis physically supported by changes (decrease) <strong>in</strong> u *t <strong>in</strong> response to surface disturbancemeasured for a range of agricultural and desert soils <strong>in</strong> the United States (Gillette, 1980;Gillette et al., 1982; Gillette, 1988).Mathematically, movements of the erodibility curve for changes <strong>in</strong> aggregation and crust<strong>in</strong>gare def<strong>in</strong>ed by a range of values for the power b <strong>in</strong> Equation (4.2). In terms of soil claycontent then the soil erodibility cont<strong>in</strong>uum can be def<strong>in</strong>ed by the range:bm<strong>in</strong>bmaxQ = a.(%clay)→maxa.(%clay)m<strong>in</strong>Q = (4.4)where b max def<strong>in</strong>es the erodibility maximum and b m<strong>in</strong> def<strong>in</strong>es the erodibility m<strong>in</strong>imum.The availability of loose erodible sediment ultimately drives changes <strong>in</strong> the position of thecurve between those at b max and b m<strong>in</strong> . The directional form of the change is thereforecontrolled by the relationship between soil aggregation (namely %DA > 0.84 mm) andstreamwise sediment flux Q. Chepil (1953) and Leys et al. (1996) demonstrated that thisrelationship is consistent for all soil textures (i.e. 0 – 100 % clay) and can be expressed as:Qb%DA= aexp (4.5)where a is the equation <strong>in</strong>tercept and -b def<strong>in</strong>es the sensitivity of Q to %DA, the percentagemass of non-erodible dry aggregates (>0.84 mm). The applicability of Equation (4.5) acrossthe soil texture range l<strong>in</strong>ks back to the energy requirements for gra<strong>in</strong> mobilization and theelementary relationship between gra<strong>in</strong> (aggregate) size and u *t . Progressively <strong>in</strong>creas<strong>in</strong>g soilsurface disturbance results <strong>in</strong> weakened <strong>in</strong>ter-particle bonds and an <strong>in</strong>crease <strong>in</strong> the fraction ofloose erodible material. Soils can therefore exist with some range of ‘gra<strong>in</strong>’ sizes determ<strong>in</strong>edby <strong>in</strong>ter-particle cohesion as a result of aggregation or crust disturbance (Breun<strong>in</strong>ger et al.,1989). As soil aggregation changes through time <strong>in</strong> response to climate and managementfactors the position of a soil on the curve def<strong>in</strong>ed by Equation (4.5) will also change. Figure4.2 illustrates a hypothetical vertical displacement of the Q-%clay curve (4.2b) <strong>in</strong> response toa change <strong>in</strong> %DA (4.2a). Differences <strong>in</strong> the regression coefficients a and -b (Equation 4.5) aspresented by Chepil (1953) and Leys et al. (1996) are attributed to site specific variations <strong>in</strong>106


