for Carbon Management
Martin Whiteland - Eventlink.org
Martin Whiteland - Eventlink.org
- No tags were found...

Create successful ePaper yourself
Turn your PDF publications into a flip-book with our unique Google optimized e-Paper software.
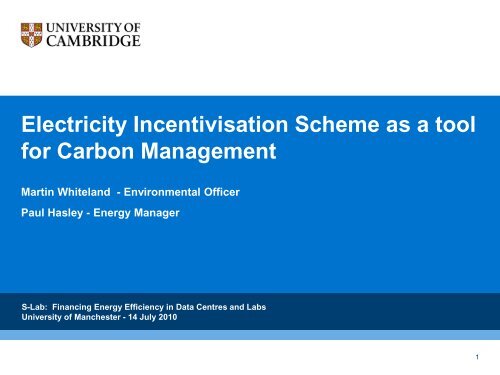
Electricity Incentivisation Scheme as a tool<strong>for</strong> <strong>Carbon</strong> <strong>Management</strong>Martin Whiteland - Environmental OfficerPaul Hasley - Energy ManagerS-Lab: Financing Energy Efficiency in Data Centres and LabsUniversity of Manchester - 14 July 20101
MWh/YearHistorical energy use in buildings250,000200,000150,000100,00050,00001990/19911991/19921992/19931993/19941994/19951995/19961996/19971997/19981998/19991999/20002000/20012001/20022002/20032003/20042004/20052005/20062006/20072007/20082008/2009YearElectricity Gas Oil2
Tonnes CO2(e)/YearCO 2 emissions from energy use in buildings800007000060000500004000030000200001000001990/19911991/19921992/19931993/19941994/19951995/19961996/19971997/19981998/19991999/20002000/20012001/20022002/20032003/20042004/20052005/20062006/20072007/20082008/2009YearElectricity Gas Oil3
£(million)Energy Costs16141210864201990/19911991/19921992/19931993/19941994/19951995/19961996/19971997/19981998/19991999/20002000/20012001/20022002/20032003/20042004/20052005/20062006/20072007/20082008/2009YearElectricity Gas Oil4
Tonnes CO2 per annumTop 30 Buildings – CO 2 Emissions800070006000500040003000200010000ChemistryPhysicsGurdon InstUniversity LibraryBiotechnolgy/SBIEngineeringArup BuildingCMSNew Biochem (Sanger)Combined FacilityPlant GrowthPathologyCAPEAnatomyWilliam GatesFitzwilliam MuseumBiochem (Hopkins)Vet School (Innes)Whittle LabOld MetallurgyBuildingElectricityGasGeneticsGreenwich HouseUniversity CentreEarth SciencesLawNano-scienceOld Press SiteBrain RepairZoologyJudge InstOld SchoolsMill Lane Lecture RoomsKenmare House5
2005 CO 2 Emissions (t/y) from English HEIs (Russell Group Highlighted)6
LSEOpen UniversityNottingham TrentLincolnNorthumbriaEast LondonWest of EnglandEssexAstonUEAKentSheffield HallamLeeds MetWolverhamptonLancasterSal<strong>for</strong>dSussexHert<strong>for</strong>dshireSurreyCentral LancashireManchester MetropolitanQueen MaryBirmingham CityHullBathLoughboroughYorkCranfieldLeicesterReadingWarwickSheffieldDurhamBrunelUCLExeterLeedsBristolNewcastleLiverpoolNottinghamKing's College LondonBirminghamOx<strong>for</strong>dCambridgeSouthamptonImperial CollegeManchesterComparison of 2005 CO2 Emissions (t/y) from Highest 48 English HEIs10000090000800007000060000500004000030000200001000007
Tonnes CO2 / £MEmissions related to Research and Total IncomeEmissions vs Research and Total Income60050040030020010001996/19971997/19981998/19991999/20002000/20012001/20022002/20032003/20042004/20052005/20062006/20072007/20082008/2009Emissions vs Reserach Grants & Contracts Emissions vs Total Income (little u)8
Electricity Incentivisation Scheme• Introduced with effect from 1 August 2008.• Each Department allocated a target <strong>for</strong> usage in 2008/09 based onmetered use of electricity in 2006/07 with a 3% uplift applied to allow <strong>for</strong>some growth. (Historical growth in electricity consumption 4% perannum averaged across the estate over the previous 10 years).• Usage in shared buildings split between all the occupants on a pro-ratabasis based on floor area.• Following the success of the scheme in 2008/09 further targets were set<strong>for</strong> 2009/10 and 2010/11. Targets <strong>for</strong> each year are based on theaverage of the target and the actual consumption <strong>for</strong> the previous year,plus an uplift of 2%. This is half the rate of growth historically.9
Implementation• Agreed by Resource <strong>Management</strong> Committee• Network of Departmental Energy Champions set up• Systems link website provides access to energy data per building• Meters on the web project to refine and enhance energy reporting• ComArticles e.g. University Newsletter• University already had a programme of installing sub-metering in orderto be able to measure usage per building• Sub-meters are read remotely and data is collected automatically10
Web Reports on Energy Usage11
Meters on the Web Project12
Results <strong>for</strong> 2008/2009• Financial Savings – total net savings of £0.82M• £0.67M would have been saved by achieving the target• Some Departments bettered the target and saved an additional £0.35M• Some Departments failed to achieve the target and were ‘fined’ £0.2M• CO 2 Savings of 3,852 tonnes• Achieving the target would have saved 3,166 tonnes CO 2• Across the estate emissions were 686 tonnes below target14
Biochemistry Case Study• Transfer Value £43,069.16• Department already had good culture of energy management andexcellent track record• Collaboration with Estates Energy Team has seen electricity usefall year on year in a wet science dept with increasing researchactivity• Department was still able to produce further savings to benefitfinancially from good practice• Funds have been ring fenced <strong>for</strong> further investment in energyconservation measures, such as purchase of A++ rated fridges16
Engineering Case Study• Transfer Value £(35,402.56)• A ‘fine’ of this size was sufficient to attract management attention• Departmental Sustainability and Energy Committees established toidentify and implement saving opportunities• Plans <strong>for</strong> increased capacity of ICT servers have been revised toinclude evaporative cooling instead of conventional DX chillers• Department plan to sub-meter individual research groups in orderto devolve costs even closer to end users18
Forecast <strong>for</strong> 2009/2010 Financial YearSchool / NSIAnnual Target MWh(average of target andactual + 2%)Actual to April 2010MWhForecastMWhFY 09/10Estimated TransferValueVarianceArts & Humanities 2,098 1,490 2,012 -£5,782 -5.5%Biological Sciences 33,877 24,892 33,329 -£1,316 -2.2%Clinical Medicine 14,633 10,545 14,310 -£26,891 -3.0%Humanities and Social Sciences 4,303 3,057 4,154 -£3,341 -4.6%Physical Sciences 29,093 20,950 28,010 -£70,830 -4.9%Technology 14,800 10,788 14,397 -£19,617 -3.6%Central Administration 2,649 1,932 2,570 -£292 -3.9%University Library 5,532 3,957 5,375 -£13,258 -3.8%Other 6,830 5,162 6,856 +£21,932 +0.5%Total 113,816 82,773 111,012 -£119,395 -3.3%20
Forecast <strong>for</strong> 2009/2010• All School/NSIs are 5.5% to 2.2% under target .• Targets <strong>for</strong> each quarter are based on the profile of actual usage <strong>for</strong> eachquarter in 2008/2009.• Transfer values are based on an estimated price of 8.4 p/kWh <strong>for</strong> electricity.• Transfer value is doubled in cases where usage has exceeded the target tofurther incentivise good per<strong>for</strong>mance.• Equalling the target would result in an avoided cost of £0.19m in the currentfinancial year compared to business as usual. Further savings of £0.12m arenow also <strong>for</strong>ecast to be delivered.• Scheme managed within existing resources. Net revenue benefit of £0.31m tothe University in 2009/10 that has not required any additional expenditure21
Summary of benefits / lessons learnt• Beginning of culture change; impact of energy usage has been broughtcloser to those using it• Psychology of ‘fines’ seems more significant than financial value• Departments at Cambridge have a lot of decision making power (e.g.separate ICT networks), electricity incentivisation has been good <strong>for</strong>influencing those numerous decision makers• Need to have accurate data, justifiable targets and resources to dealwith ‘queries’ (e.g. flak jacket!)22