Cash and Food Transfers in Swaziland - Save the Children
Cash and Food Transfers in Swaziland - Save the Children
Cash and Food Transfers in Swaziland - Save the Children
- No tags were found...

You also want an ePaper? Increase the reach of your titles
YUMPU automatically turns print PDFs into web optimized ePapers that Google loves.
<strong>Save</strong> <strong>the</strong> <strong>Children</strong><strong>Save</strong> <strong>the</strong> <strong>Children</strong> Swazil<strong>and</strong> (SC SWD)Lilunga Street, Msunduza Road, MBABANE, Swazil<strong>and</strong>P.O. Box 472MBABANETel: (+268) 404 2573 / 404 3277 / Direct L<strong>in</strong>e: (+268) 404 5181Fax: (+268) 404 4719E-mail: childsav@save<strong>the</strong>children.org.szWebsite: www.save<strong>the</strong>children.org.sz\sc drought evaluation cover 2008.p6542008/08/30, 11:17 AM
ContentsExecutive Summary .......................................................................................................................... 4Chapter 1 Introduction .................................................................................................................... 71.1 Project description ........................................................................................................................................ 71.2 Scope of evaluation........................................................................................................................................ 81.3 Evaluation methodology ............................................................................................................................... 9Chapter 2 Process Evaluation ....................................................................................................... 122.1 Design.............................................................................................................................................................. 122.1.1 Payment modalities .......................................................................................................................... 122.1.2 Payment levels ................................................................................................................................... 142.1.3 Supplementary payments............................................................................................................... 152.2 Target<strong>in</strong>g.......................................................................................................................................................... 162.2.1 Geographical coverage .................................................................................................................... 162.2.2 Household selection........................................................................................................................ 172.3 Delivery mechanisms .................................................................................................................................. 202.3.1 <strong>Cash</strong> ..................................................................................................................................................... 202.3.2 <strong>Food</strong> ..................................................................................................................................................... 232.3.3 ‘Customer care’ ................................................................................................................................ 242.4 Cost efficiency <strong>and</strong> cost-effectiveness................................................................................................... 252.5 Tra<strong>in</strong><strong>in</strong>g, mobilisation <strong>and</strong> sensitisation................................................................................................... 27Chapter 3 Impact Evaluation ........................................................................................................ 303.1 Use of cash <strong>and</strong> food transfers ................................................................................................................ 303.2 Household food security ........................................................................................................................... 323.3 Non-food goods <strong>and</strong> services .................................................................................................................. 333.4 Cop<strong>in</strong>g strategies.......................................................................................................................................... 363.5 Livelihoods, assets <strong>and</strong> sav<strong>in</strong>gs ................................................................................................................. 373.6 Impacts on children .................................................................................................................................... 393.6.1 <strong>Cash</strong> spend<strong>in</strong>g by <strong>and</strong> on children.............................................................................................. 403.6.2 Child nutrition .................................................................................................................................. 413.7 Impacts on women...................................................................................................................................... 423.8 Markets ........................................................................................................................................................... 43Chapter 4 Conclusions, Lessons Learned <strong>and</strong> Recommendations ........................................... 454.1 Conclusions................................................................................................................................................... 454.2 Lessons learned ............................................................................................................................................ 464.3 Recommendations for future cash programm<strong>in</strong>g............................................................................... 46References ................................................................................................................................................................... 48Annex Tables ................................................................................................................................................................... 49List of FiguresFigure 1 Trends <strong>in</strong> maize production <strong>in</strong> Swazil<strong>and</strong>, 1996/97 to 2006/07 ....................................................... 7Figure 2 Preferences for food or cash transfers, pre <strong>and</strong> post-<strong>in</strong>tervention ..............................................14Figure 3 Average cost of a half food ration <strong>in</strong> rural Swazil<strong>and</strong>, 2007/08 .......................................................15Figure 4 <strong>Food</strong> aid beneficiaries by food security <strong>and</strong> socioeconomic status, 2006...................................20Figure 5 Average queu<strong>in</strong>g times at Post Office or ATM to collect cash transfers .....................................21Figure 6 Proportion of recipients collect<strong>in</strong>g <strong>the</strong>ir cash transfers at Post Office or ATM ........................22Figure 7 Effects of food pipel<strong>in</strong>e disruption on spend<strong>in</strong>g on food (E/month) ............................................23Figure 8 How cash plus food recipients used <strong>the</strong>ir cash transfers ................................................................301SC Emergency Drought Response.p6512008/09/10, 11:56 AM
Figure 9 Average monthly household spend<strong>in</strong>g, November 2007 to April 2008 ......................................31Figure 10 Spend<strong>in</strong>g differentials between ‘cash plus food’ <strong>and</strong> ‘food only’ recipients .................................31Figure 11 Hunger reported by households receiv<strong>in</strong>g cash <strong>and</strong>/or food transfers, 2007/08 .....................33Figure 12 Monthly spend<strong>in</strong>g, cash transfer recipients, 2007/08 ........................................................................35Figure 13 Monthly spend<strong>in</strong>g, ‘food only’ recipients, 2007/08 .............................................................................35Figure 14 Cop<strong>in</strong>g strategies adopted by droughtaffected households, 2007/08 ..........................................36Figure 15 Changes <strong>in</strong> asset ownership, December 2007 to May 2008...........................................................38Figure 16 Spend<strong>in</strong>g of cash transfers by childheaded households ...................................................................41Figure 17 <strong>Children</strong> with adequate dietary diversity (% of households) ..........................................................42List of TablesTable 1 Monthly monitor<strong>in</strong>g matrix.......................................................................................................................10Table 2 Sample size <strong>and</strong> composition, f<strong>in</strong>al evaluation survey (May 2008) .................................................11Table 3 Household preferences for collect<strong>in</strong>g future cash transfers...........................................................23Table 4 Negative <strong>in</strong>cidents reported by cash recipients at paypo<strong>in</strong>ts .........................................................25Table 5 Costs of food <strong>and</strong> cash distribution (E/household/month) .............................................................26Table 6 Hunger reported by households before <strong>and</strong> after receiv<strong>in</strong>g assistance, 2007/08 ....................33Table 7 Reasons for changes <strong>in</strong> asset ownership ...............................................................................................39Table 8 <strong>Children</strong> <strong>and</strong> orphans who benefited from <strong>the</strong> EDR <strong>in</strong>tervention ...............................................40Table 9 Detailed breakdown of food <strong>and</strong> cash distribution costs (E/ household/month) .....................49Table 10 Use of food transfers ..................................................................................................................................50Table 11 Cop<strong>in</strong>g strategies ..........................................................................................................................................50Table 12 Asset ownership (households own<strong>in</strong>g, by transfers received) .......................................................51Table 13 Asset ownership (households own<strong>in</strong>g, by household headship) ...................................................51Table 14 Changes <strong>in</strong> asset ownership: Livestock ..................................................................................................52Table 15 Changes <strong>in</strong> asset ownership: Household goods ..................................................................................53Table 16 Changes <strong>in</strong> asset ownership: Farm implements ..................................................................................54Table 17 Changes <strong>in</strong> asset ownership, December 2007 to May 2008...........................................................55Table 18 <strong>Children</strong> with appropriate dietary diversity (% of households) .....................................................55List of BoxesBox 1 EDR retarget<strong>in</strong>g <strong>in</strong> one community ........................................................................................................19Box 2 EDR tra<strong>in</strong><strong>in</strong>g sessions, February 2008 ...................................................................................................29Box 3 Woman trader, Siphofaneni.......................................................................................................................372AcronymsAIDS Acquired Immune Deficiency SyndromeATM Automated Teller Mach<strong>in</strong>eCFSAM Crop <strong>and</strong> <strong>Food</strong> Supply Assessment MissionCHH Child–headed HouseholdCSO Central Statistical OfficeDFID Department for International DevelopmentE Emalangeni (Swazil<strong>and</strong>’s currency, pegged at parity to <strong>the</strong> South African R<strong>and</strong>)EDR Emergency Drought ResponseFAO <strong>Food</strong> <strong>and</strong> Agriculture OrganizationFDP F<strong>in</strong>al Distribution Po<strong>in</strong>tFGD Focus Group DiscussionFHH Female–headed HouseholdHDI Human Development IndexHHH Household HeadHIV Human Immunodeficiency Viruskcal kilocaloriekg kilogramM&E Monitor<strong>in</strong>g <strong>and</strong> EvaluationMHH Male–headed HouseholdMT Metric TonNDMA National Disaster Management AgencyNDTF National Disaster Task ForceSC Emergency Drought Response.p6522008/09/10, 11:56 AM
Table 1Monthly monitor<strong>in</strong>g matrixIndicator monitored Data collection methods Sample<strong>Cash</strong> <strong>and</strong> food distribution1. Monitor<strong>in</strong>g forms2. Inventory log books3. Supply log books4. Post Office records5. St<strong>and</strong>ard Bank recordsHousehold <strong>in</strong>come <strong>and</strong> Household Expenditure 210 households, r<strong>and</strong>omlyexpenditure Monitor<strong>in</strong>g Forms selected, stratified by area <strong>and</strong>modality:Household asset ownership Household Expenditure 70 Lowveld food only recipientsMonitor<strong>in</strong>g Forms 70 Lowveld cash + foodrecipients<strong>Children</strong>’s dietary <strong>in</strong>take Household Expenditure 70 Timber Highl<strong>and</strong>s cash +(dietary diversity, quantity <strong>and</strong> Monitor<strong>in</strong>g Forms food recipientsquality of food <strong>in</strong>take)Market prices <strong>and</strong> availability Price monitor<strong>in</strong>g forms 1 supermarket, 1 grocery shop,(key food <strong>and</strong> nonfood1 butchery, 2 market vendors,commodities <strong>and</strong> services)r<strong>and</strong>omly selected from eachof <strong>the</strong> 8 study areasSpecific operational reasons for monitor<strong>in</strong>g each <strong>in</strong>dicator were expla<strong>in</strong>ed <strong>in</strong> <strong>the</strong> ‘Monitor<strong>in</strong>g <strong>and</strong> EvaluationPlan’ (SC Swazil<strong>and</strong>/WFP, November 2007):<strong>Cash</strong> <strong>and</strong> food distribution: “If less than 90% of <strong>the</strong> expected households receive <strong>the</strong> food <strong>and</strong>/or cash<strong>the</strong>n <strong>the</strong> Field Officer must take appropriate action”Household <strong>in</strong>come <strong>and</strong> expenditure: To track <strong>the</strong> sources of <strong>in</strong>come <strong>and</strong> spend<strong>in</strong>g priorities ofparticipat<strong>in</strong>g households dur<strong>in</strong>g <strong>the</strong> project periodHousehold assets: “To determ<strong>in</strong>e whe<strong>the</strong>r <strong>the</strong> <strong>in</strong>tervention (food <strong>and</strong>/or cash distribution) affects <strong>the</strong>levels of key assets owned by <strong>the</strong> households”<strong>Children</strong>’s dietary <strong>in</strong>take: “To determ<strong>in</strong>e whe<strong>the</strong>r <strong>the</strong> <strong>in</strong>tervention (food <strong>and</strong>/or cash distribution)affects <strong>the</strong> nutritional adequacy of <strong>the</strong> diet fed to children under 36 months”Market prices: “To ascerta<strong>in</strong> whe<strong>the</strong>r <strong>the</strong> <strong>in</strong>creased availability of food <strong>and</strong>/or <strong>the</strong> <strong>in</strong>fusion of cash <strong>in</strong>to<strong>the</strong> communities affects <strong>the</strong> market prices of specific goods <strong>and</strong> services”.10Process monitor<strong>in</strong>g also <strong>in</strong>cluded <strong>in</strong>formation from St<strong>and</strong>ard Bank on <strong>the</strong> ma<strong>in</strong>tenance <strong>and</strong> use of bankaccounts. This <strong>in</strong>cluded numbers of accountholders us<strong>in</strong>g ATM facilities to access <strong>the</strong>ir cash, what proportionof cash transfer payments were withdrawn <strong>in</strong> full, whe<strong>the</strong>r deposits were made, how many transactionswere recorded each month. To respect customer confidentiality, this <strong>in</strong>formation was not attributable to<strong>in</strong>dividual accountholders.4. Focus group discussions<strong>Save</strong> <strong>the</strong> <strong>Children</strong>’s M&E team collected qualitative data to supplement <strong>and</strong> triangulate <strong>the</strong> quantitativemonitor<strong>in</strong>g data. Qualitative monitor<strong>in</strong>g <strong>in</strong>cluded focus group discussions (FGDs) every second monthwith men <strong>and</strong> women, <strong>and</strong> with cash recipients <strong>and</strong> non-recipients, <strong>in</strong> communities located <strong>in</strong> <strong>the</strong> projectareas. A first set of 24 focus groups was facilitated <strong>in</strong> January 2008. Topics discussed <strong>in</strong>cluded: EDR target<strong>in</strong>g<strong>and</strong> selection criteria; ease of cash <strong>and</strong> food collection; attitudes towards cash <strong>and</strong> food transfers; impacts of<strong>the</strong> project on children; impacts of <strong>the</strong> project at household <strong>and</strong> community levels; <strong>and</strong> decision mak<strong>in</strong>gSC Emergency Drought Response.p65102008/09/10, 11:56 AM
with<strong>in</strong> households on <strong>the</strong> use of cash <strong>and</strong> food transfers.A second set of 20 focus groups was facilitated <strong>in</strong> March2008. Topics discussed <strong>in</strong> this round <strong>in</strong>cluded:implementation of <strong>the</strong> project; impacts of cash <strong>and</strong> fooddistribution on gender <strong>and</strong> <strong>in</strong>ter-generational relations; usesof food; spend<strong>in</strong>g of cash transfers. A third <strong>and</strong> f<strong>in</strong>al set offocus group discussions was facilitated dur<strong>in</strong>g <strong>the</strong> f<strong>in</strong>alevaluation <strong>in</strong> May 2008, <strong>the</strong>se <strong>in</strong>cluded discussions <strong>in</strong> eachregion with Relief Committees, cash recipients us<strong>in</strong>g <strong>the</strong>Post Office, cash recipients us<strong>in</strong>g bank ATMs, <strong>and</strong> ‘foodonly’ recipients.5. F<strong>in</strong>al evaluation surveyThe f<strong>in</strong>al evaluation survey was conducted <strong>in</strong> May 2008, <strong>in</strong>both agro-ecological zones (Lowveld <strong>and</strong> Highveld),llivelihood zones (Lowveld Cattle <strong>and</strong> Maize, <strong>and</strong> TimberHighl<strong>and</strong>s) <strong>and</strong> regions (Lubombo <strong>and</strong> Shiselweni) where<strong>the</strong> EDR project was implemented, <strong>and</strong> <strong>in</strong> all 4 constituencies or T<strong>in</strong>khundlas (Siphofaneni <strong>and</strong> Sithobela <strong>in</strong>Lubombo; Gege <strong>and</strong> Maseyis<strong>in</strong>i <strong>in</strong> Shiselweni).A total of 1,784 households were <strong>in</strong>terviewed, 20.9% of <strong>the</strong> 7,650 households that received cash <strong>and</strong>/orfood transfers from <strong>the</strong> Emergency Drought Response <strong>in</strong>tervention. S<strong>in</strong>ce <strong>the</strong> primary focus of <strong>the</strong> evaluationwas to assess <strong>the</strong> impacts <strong>and</strong> effectiveness of EDR cash transfers, <strong>the</strong> sample was weighted towardshouseholds that received cash. Two-thirds of <strong>the</strong> sample were ‘cash plus food’ recipients (1,225/1,784=69%) – this was <strong>the</strong> ‘treatment group’. Slightly less than one-third of <strong>the</strong> sample were ‘food only’ recipients(491/1,784 =28%) – this was <strong>the</strong> ‘control group’. A small number of child-headed households were also<strong>in</strong>terviewed (68/1,784 =4%), because <strong>the</strong> EDR project had a specific objective of provid<strong>in</strong>g assistance tochild-headed households (Table 2). These households received cash <strong>and</strong> food transfers, but were analysedseparately because of <strong>the</strong>ir particular characteristics (for example, <strong>the</strong>y did not use ei<strong>the</strong>r <strong>the</strong> Post Officeor St<strong>and</strong>ard Bank ATMs, but were given <strong>the</strong>ir cash transfers directly).Table 2 Sample size <strong>and</strong> composition, f<strong>in</strong>al evaluation survey (May 2008)Region <strong>Cash</strong> + <strong>Food</strong> <strong>Food</strong> Only Child-headed TotalLubombo 743 (41.6%) 301 (16.9%) 26 (1.5%) 1,070 (60.0%)Shiselweni 482 (27.0%) 190 (10.7%) 42 (2.4%) 714 (40.0%)Total 1,225 (68.7%) 491 (27.5%) 68 (3.8%) 1,784 (100%)The overwhelm<strong>in</strong>g majority of respondents were female (1,497/1,784 =83.9%), with less than one <strong>in</strong> fiverespondents be<strong>in</strong>g male (287/1,784 =16.1%). This reflected <strong>the</strong> project design choice of nom<strong>in</strong>at<strong>in</strong>g womenas direct recipients of EDR cash <strong>and</strong> food transfers, whe<strong>the</strong>r or not <strong>the</strong>y were <strong>the</strong> household head.In terms of demographically vulnerable groups, our surveyed households <strong>in</strong>cluded 6,389 children under 15years old, 2,513 s<strong>in</strong>gle or double-parent orphans, 745 people over 60 years old, <strong>and</strong> 24 <strong>in</strong>dividuals receiv<strong>in</strong>ga disability grant. Extrapolat<strong>in</strong>g from our sample to all 7,650 beneficiary households, this implies that <strong>the</strong>direct beneficiaries of <strong>the</strong> EDR <strong>in</strong>cluded approximately 27,000 children, 11,000 orphans, 3,000 older persons,<strong>and</strong> 100 people with disabilities.11SC Emergency Drought Response.p65112008/09/10, 11:56 AM
Chapter 2Process EvaluationSeveral issues <strong>in</strong> <strong>the</strong> design <strong>and</strong> implementation of <strong>the</strong> EDR project are exam<strong>in</strong>ed <strong>in</strong> this chapter: designchoices (payment modalities, payment levels, supplementary payments), target<strong>in</strong>g (geographical coverage,household selection, gender), delivery mechanisms (cash, food), ‘customer care’ (transport, security, etc.),efficiency <strong>and</strong> cost-effectiveness.2.1 Design2.1.1 Payment modalities<strong>Food</strong> aid has become <strong>in</strong>stitutionalised <strong>in</strong> Swazil<strong>and</strong> <strong>in</strong> <strong>the</strong> last decade, as a response not only to food crisesbut also to chronic food <strong>in</strong>security, <strong>the</strong> logic be<strong>in</strong>g that food aid addresses directly <strong>the</strong> immediate nutritionalneeds of hungry people. <strong>Food</strong> assistance programmes are managed by <strong>the</strong> National Disaster Task Force(NDTF) <strong>and</strong> <strong>the</strong> World <strong>Food</strong> Programme (WFP), with several NGOs <strong>in</strong>volved <strong>in</strong> food aid distribution at <strong>the</strong>community level. With approximately one quarter of <strong>the</strong> national population receiv<strong>in</strong>g food aid every year<strong>in</strong> recent years (FAO/WFP, 2007:6), <strong>the</strong>re are fears that dependency on food aid has become endemic. Even<strong>the</strong> K<strong>in</strong>g shares this concern – <strong>in</strong> two speeches dur<strong>in</strong>g 2008 he argued that people are responsible for<strong>the</strong>mselves, <strong>and</strong> families should feed <strong>the</strong>mselves if <strong>the</strong>y can. <strong>Save</strong> <strong>the</strong> <strong>Children</strong>’s rationale for <strong>in</strong>troduc<strong>in</strong>gcash transfers was partly an attempt to explore an alternative modality to food aid <strong>in</strong> Swazil<strong>and</strong>.“<strong>Food</strong> distribution has been <strong>the</strong> st<strong>and</strong>ard response to humanitarian crises <strong>in</strong> recent years,<strong>and</strong> whilst it has demonstrated some success <strong>in</strong> meet<strong>in</strong>g immediate nutritional needs for many of<strong>the</strong> most vulnerable, it does little to meet longer term nutritional needs (e.g. micronutrients),protect or promote livelihoods <strong>and</strong> has limited <strong>the</strong> <strong>in</strong>volvement of affected households <strong>in</strong> identify<strong>in</strong>g<strong>the</strong>ir own solutions to <strong>the</strong> causes of <strong>the</strong>se crises” (SC Swazil<strong>and</strong>, January 2008: 7).Questions have also been raised about whe<strong>the</strong>r food distributions are <strong>the</strong> most appropriate response tochronic poverty <strong>and</strong> food <strong>in</strong>security. In most years Swazil<strong>and</strong> imports 50-60% of its national food consumptionrequirements, ma<strong>in</strong>ly from South Africa, <strong>and</strong> poor rural households are access<strong>in</strong>g more <strong>and</strong> more of <strong>the</strong>irfood through markets as food production per capita cont<strong>in</strong>ues to decl<strong>in</strong>e. A key factor <strong>in</strong> mak<strong>in</strong>g <strong>the</strong> casefor cash transfers is <strong>the</strong> capacity of markets to respond positively to dem<strong>and</strong> signals generated by cash<strong>in</strong>jections. Two sources provide positive <strong>in</strong>dications that markets <strong>and</strong> traders <strong>in</strong> Swazil<strong>and</strong> are <strong>in</strong> fact up tothis task. Firstly, data on food dem<strong>and</strong> <strong>and</strong> supply from <strong>the</strong> past several years reveals that commercialimports are responsive to fluctuations <strong>in</strong> dem<strong>and</strong> (e.g. <strong>in</strong>creased market dependence <strong>in</strong> drought years) <strong>and</strong>supply (e.g. decl<strong>in</strong><strong>in</strong>g trends <strong>in</strong> national maize production) (FAO/WFP 2007). Secondly, <strong>the</strong> market feasibilitystudy commissioned by <strong>Save</strong> <strong>the</strong> <strong>Children</strong> Swazil<strong>and</strong> <strong>in</strong>cluded <strong>in</strong>terviews with 235 local food traders, <strong>and</strong>found that <strong>the</strong>se traders do “have <strong>the</strong> capacity to scale up <strong>the</strong>ir tonnage ... <strong>in</strong> response to an <strong>in</strong>crease <strong>in</strong>effective dem<strong>and</strong>” (de Matteis, 2007: 28).More generally, <strong>the</strong> case for <strong>in</strong>troduc<strong>in</strong>g cash transfers <strong>in</strong> Swazil<strong>and</strong> builds on a grow<strong>in</strong>g evidence base fromseveral ‘social cash transfers’ <strong>and</strong> ‘emergency cash transfer’ programmes <strong>in</strong> countries across Sou<strong>the</strong>rnAfrica, which confirm <strong>the</strong> multiple benefits of provid<strong>in</strong>g cash to poor people, ei<strong>the</strong>r permanently as ‘predictablesocial transfers (eg social pensions) or as humanitarian relief . The balance of evidence concludes that cashtransfers are empower<strong>in</strong>g (cash gives choices <strong>and</strong> dignity), cash allows non–food needs to be met, cash iseffective <strong>in</strong> meet<strong>in</strong>g more diverse <strong>and</strong> long–term nutrition needs (e.g. it permits <strong>the</strong> purchase of micronutrients),cash protects <strong>and</strong> promotes livelihoods, cash is (usually) more cost-effective than food aid, cashgenerates positive multiplier effects on markets <strong>and</strong> local economies, <strong>and</strong> recipients generally prefer (someor all) cash to pure food aid.But <strong>the</strong>re are also concerns about <strong>in</strong>troduc<strong>in</strong>g cash transfers, especially <strong>in</strong> food crisis situations. The caseaga<strong>in</strong>st cash <strong>in</strong>cludes:1. possible <strong>in</strong>flationary effects, underm<strong>in</strong><strong>in</strong>g <strong>the</strong> value of cash transfers <strong>and</strong> reduc<strong>in</strong>g access to food;12SC Emergency Drought Response.p65122008/09/10, 11:56 AM
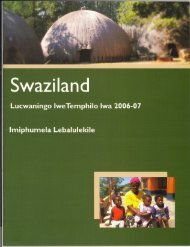
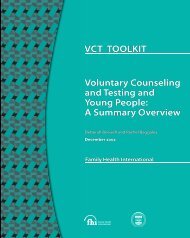
2. possible ‘misuse’ of cash by recipients for purposes that were not <strong>in</strong>tended <strong>and</strong> are considered tobe negative (eg. alcohol);3. possible ‘leakages’ or appropriation by elites <strong>and</strong> o<strong>the</strong>rs not <strong>in</strong>tended to benefit from <strong>the</strong> <strong>in</strong>tervention;4. possible <strong>in</strong>tra-household conflict (<strong>in</strong>clud<strong>in</strong>g gender-based violence) over <strong>the</strong> control <strong>and</strong> spend<strong>in</strong>g ofcash transfers.The FAO/WFP ‘Crop <strong>and</strong> <strong>Food</strong> Security Assessment Mission’ concluded <strong>in</strong> May 2007 that cash transferswould be an <strong>in</strong>appropriate response to <strong>the</strong> food crisis. “Given <strong>the</strong> reduced availability of maize <strong>and</strong> alreadyobserved price hikes cash transfers are presently not seen as a suitable mechanism for ensur<strong>in</strong>g householdfood security” (FAO/WFP, 2007:23). Given <strong>the</strong>se concerns, <strong>Save</strong> <strong>the</strong> <strong>Children</strong> Swazil<strong>and</strong> decided on a riskm<strong>in</strong>imis<strong>in</strong>gstrategy, <strong>and</strong> delivered cash transfers as part of a package that provided a full ration of food, buthalf <strong>in</strong> cash <strong>and</strong> half <strong>in</strong>-k<strong>in</strong>d. The primary aim of <strong>the</strong> EDR project was humanitarian: this <strong>in</strong>tervention was acontribution to <strong>the</strong> national emergency response. The secondary aim was to pilot <strong>the</strong> use of cash transfers<strong>in</strong> an emergency context <strong>in</strong> Swazil<strong>and</strong>. N<strong>in</strong>e hypo<strong>the</strong>ses about cash were put to <strong>the</strong> test:1. <strong>Cash</strong> improves nutrition, measured by more diverse diets.2. <strong>Cash</strong> allows purchase of essential non-food items.3. <strong>Cash</strong> is <strong>in</strong>vested <strong>in</strong> assets <strong>and</strong> livelihoods that raise <strong>in</strong>comes.4. Local markets are streng<strong>the</strong>ned by cash <strong>in</strong>jections, <strong>and</strong> <strong>in</strong>flation for core items does not rise as a result.5. Harmful cop<strong>in</strong>g strategies are avoided.6. Car<strong>in</strong>g practices for children improve.7. Women are empowered by receiv<strong>in</strong>g cash.8. <strong>Cash</strong> delivery systems are appropriate, timely, safe, well targeted <strong>and</strong> scaleable.9. Beneficiaries are more sympa<strong>the</strong>tic to cash transfers after <strong>the</strong> <strong>in</strong>tervention than before.Evidence concern<strong>in</strong>g <strong>the</strong> first eight of <strong>the</strong>se hypo<strong>the</strong>ses is presented later <strong>in</strong> this report. Here we consider<strong>the</strong> evidence on <strong>the</strong> n<strong>in</strong>th hypo<strong>the</strong>sis. The preproject market feasibility study found that: “In general,communities seem to prefer <strong>in</strong>k<strong>in</strong>d distributions of assistance (possibly because <strong>the</strong>se are <strong>the</strong> norm)” (deMatteis, 2007:4). This preference for food aid was re<strong>in</strong>forced by <strong>the</strong> basel<strong>in</strong>e survey: “Consultation withcommunities <strong>and</strong> feedback on people’s perception of food aid <strong>and</strong> cash evidenced a bias towards food aid,rooted <strong>in</strong> up to 15 years of food distributions.” (SC Swazil<strong>and</strong>, January 2008:8). One aim of <strong>the</strong> EDR<strong>in</strong>tervention was to challenge this bias <strong>and</strong> to ascerta<strong>in</strong> whe<strong>the</strong>r cash transfers would be accepted bypeople <strong>in</strong> need of emergency assistance.The market feasibility survey <strong>and</strong> <strong>the</strong> f<strong>in</strong>al evaluation survey both <strong>in</strong>cluded a question about beneficiarypreferences for cash <strong>and</strong>/or food transfers (“If <strong>the</strong>re is ano<strong>the</strong>r drought <strong>and</strong> you qualify for assistance,would you prefer to receive food only, cash only, or a mix of half food <strong>and</strong> half cash?”) In <strong>the</strong> pre-EDRsurvey, food aid was favoured by three <strong>in</strong> five respondents, with ‘cash only chosen by one <strong>in</strong> four <strong>and</strong> ‘cashplus food’ gett<strong>in</strong>g <strong>the</strong> fewest votes. In <strong>the</strong> post-EDR survey, a completely different pattern emerged. Anoverwhelm<strong>in</strong>g majority of respondents (91.3%) expressed a preference for transfers to be made <strong>in</strong> acomb<strong>in</strong>ation of half cash <strong>and</strong> half food, while ‘food only’ (6.3%) <strong>and</strong> ‘cash only’ (2.4%) gett<strong>in</strong>g very littlesupport (Figure 2).So food still ranked second, slightly ahead of cash, but its vote had collapsed from 60% to just 6%. This<strong>in</strong>dicates a decisive shift away from ‘food bias’ among recipients, not towards cash as a substitute for foodaid, but <strong>in</strong> favour of cash as a complement to food. Clearly, cash <strong>and</strong> food are perceived as meet<strong>in</strong>g different– but equally important – needs <strong>and</strong> priorities, <strong>and</strong> deliver<strong>in</strong>g both toge<strong>the</strong>r are preferred by recipients asprovid<strong>in</strong>g a comprehensive package of support. (“<strong>Cash</strong> is good for school fees, but food is needed tosurvive.“)13SC Emergency Drought Response.p65132008/09/10, 11:56 AM
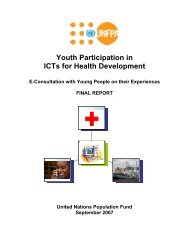
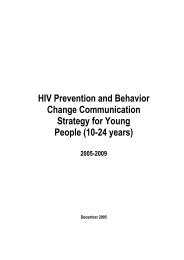
Figure 2Preferences for food or cash transfers, pre <strong>and</strong> post-<strong>in</strong>tervention<strong>Cash</strong> + <strong>Food</strong>17.0%<strong>Cash</strong> + <strong>Food</strong>91.3%<strong>Cash</strong> only23.3%<strong>Food</strong> only59.7%<strong>Food</strong>only6.3%<strong>Cash</strong> only2.4%Source: de Matteis (2007: 20) Source: F<strong>in</strong>al evaluation surveyIt should be added that this overwhelm<strong>in</strong>g endorsement of ‘cash plus food’ serves as a strong endorsementof <strong>the</strong> EDR <strong>in</strong>tervention, which evidently generated a very positive reaction. It should also be noted that thispattern of preferences was shared by respondents who had not received ‘cash plus food’. (Often respondentstailor <strong>the</strong>ir answers to endorse <strong>the</strong> <strong>in</strong>tervention be<strong>in</strong>g evaluated, <strong>in</strong> anticipation of future benefits.) Although<strong>the</strong> choice of ‘food only’ was higher among respondents who had received ‘food only’ transfers, at 11.8%versus 4.2% by ‘cash plus food’ recipients, <strong>the</strong> choice of ‘cash plus food’ was not much lower among ‘foodonly’ recipients, at 86.8% versus 93.0% by ‘cash plus food’ recipients. Intrigu<strong>in</strong>gly, however, <strong>the</strong> rejection of‘cash only’ transfers was shared almost equally, be<strong>in</strong>g preferred by only 2.8% of ‘cash plus food’ <strong>and</strong> by 1.4%of ‘food only’ recipients.2.1.2 Payment levelsThe EDR project <strong>in</strong>corporated many <strong>in</strong>novative design features. The ma<strong>in</strong> payment was a monthly cashtransfer that was <strong>in</strong>tended to be equivalent <strong>in</strong> value to a half ration of food for every household member(recall<strong>in</strong>g that <strong>the</strong> o<strong>the</strong>r half ration was provided <strong>in</strong>k<strong>in</strong>d), so <strong>the</strong> amount transferred was proportional tohousehold size. The average cost of a half food ration was estimated at E30 <strong>in</strong> October 2007, based on amarket survey conducted before <strong>the</strong> project started, <strong>and</strong> this set <strong>the</strong> per capita payment level, whichrema<strong>in</strong>ed constant throughout <strong>the</strong> project’s six months duration – payments were not adjusted <strong>in</strong> l<strong>in</strong>e withchanges <strong>in</strong> food prices. 3 So an average-sized family of six received E180 every month from November 2007to April 2008 <strong>in</strong>clusive, <strong>in</strong> addition to <strong>the</strong>ir half ration of food.Accord<strong>in</strong>g to <strong>Save</strong> <strong>the</strong> <strong>Children</strong>’s monthly market monitor<strong>in</strong>g, however, <strong>the</strong> retail prices of maize, beans <strong>and</strong>oil rose steeply between October <strong>and</strong> January, when <strong>the</strong> cost of a half ration peaked at E41, before fall<strong>in</strong>gback <strong>and</strong> stabilis<strong>in</strong>g at E37 between February <strong>and</strong> April (see <strong>the</strong> dotted l<strong>in</strong>e <strong>in</strong> Figure 3). However, this wasdistorted by one trader who charged double <strong>the</strong> normal price for maize. After he went out of bus<strong>in</strong>ess <strong>the</strong>cost of <strong>the</strong> half ration fell from E41 <strong>in</strong> January to E37 <strong>in</strong> February (SC Swazil<strong>and</strong>, February 2008: 6). In fact,this price monitor<strong>in</strong>g data suggests that <strong>the</strong> cost of a half ration on local markets averaged E37.91 over <strong>the</strong>project period, some 26% higher than <strong>the</strong> EDR cash transfer of E30. Remov<strong>in</strong>g this trader from <strong>the</strong> costcalculation produces a much flatter price trend (<strong>the</strong> solid l<strong>in</strong>e <strong>in</strong> Figure 3) <strong>and</strong> a cheaper food basket – <strong>the</strong>average cost of a half food ration was E36.35 – but still 21% higher than <strong>the</strong> per capita cash transfer.143 This is st<strong>and</strong>ard practice with social cash transfer programmes, but is at variance with recent <strong>in</strong>novations <strong>in</strong> Malawi, for <strong>in</strong>stance, where monthly payments were adjusted <strong>in</strong> l<strong>in</strong>e with fluctuations<strong>in</strong> food prices, to ma<strong>in</strong>ta<strong>in</strong> constant market access to a specified food basket (Devereux 2008).SC Emergency Drought Response.p65142008/09/10, 11:56 AM
Figure 3 Average cost of a half food ration <strong>in</strong> rural Swazil<strong>and</strong>, 2007/08424039.9641.2938363435.4035.4035.2836.5637.0237.0236.6636.66323030.0030.00Oct Nov Dec Jan Feb Mar AprSource: <strong>Save</strong> <strong>the</strong> <strong>Children</strong> Swazil<strong>and</strong>, price monitor<strong>in</strong>g data, 2007/08<strong>Save</strong> <strong>the</strong> <strong>Children</strong> offered four explanations about this underpayment <strong>and</strong> why <strong>the</strong>y did not correct it.1. Prices did not fluctuate sufficiently to justify recalibration of payments every month, but rema<strong>in</strong>edrelatively stable for <strong>the</strong> duration of <strong>the</strong> project period.2. The payment level was miscalculated – <strong>the</strong> cost of a half ration was underestimated – but this wasdistorted by <strong>the</strong> <strong>in</strong>clusion of <strong>the</strong> ‘rogue trader’ <strong>in</strong> <strong>the</strong> market monitor<strong>in</strong>g survey.3. Expla<strong>in</strong><strong>in</strong>g how payments were calculated was complex for recipients to underst<strong>and</strong>, <strong>and</strong> adjust<strong>in</strong>g <strong>the</strong>per capita food component every month would have added to <strong>the</strong> confusion.4. <strong>Cash</strong> recipients were able to absorb <strong>the</strong> higher food costs by draw<strong>in</strong>g on <strong>the</strong> o<strong>the</strong>r payments <strong>the</strong>yreceived – <strong>the</strong> lump-sum grants plus monthly supplements for transport <strong>and</strong> non-food items (SCSwazil<strong>and</strong>, March 2008: 5).It is true that food prices trends were fairly stable between November <strong>and</strong> May, <strong>and</strong> that <strong>the</strong> cost of a halffood ration rose by only about 1% month on month, once <strong>the</strong> rogue maize trader is removed from <strong>the</strong>equation. But under ei<strong>the</strong>r cost calculation <strong>the</strong> cash transfer payment was – consistently, every month – atleast 20% too low. The third rationale relates to <strong>the</strong> complexity of <strong>the</strong> cash payments calculation, which<strong>in</strong>cluded one component that was adjusted for household size, <strong>and</strong> two (discussed below) that were not.Expla<strong>in</strong><strong>in</strong>g to recipients how <strong>the</strong>ir entitlements were calculated certa<strong>in</strong>ly required a great deal of tra<strong>in</strong><strong>in</strong>g<strong>and</strong> sensitisation by project staff, <strong>and</strong> chang<strong>in</strong>g <strong>the</strong> payment every month would have required more tra<strong>in</strong><strong>in</strong>g.F<strong>in</strong>ally, it is true that <strong>the</strong> generous supplementary payments cushioned cash recipients aga<strong>in</strong>st food price<strong>in</strong>flation, <strong>and</strong> compensated for <strong>the</strong> underpayment on <strong>the</strong> food basket – but this was not <strong>the</strong> <strong>in</strong>tention, <strong>and</strong>cash recipients were never told that <strong>the</strong> nonfood payments should cross-subsidise food purchases.2.1.3 Supplementary paymentsA number of supplementary payments were made to cash recipients by <strong>the</strong> EDR project that were <strong>in</strong>novative<strong>and</strong> impacted positively on recipient households. These payments <strong>in</strong>cluded:an <strong>in</strong>itial lump-sum grant (E450)a modest monthly supplement for transport costs (E25/month)a modest monthly supplement for non-food items (E20/month)a f<strong>in</strong>al lump-sum grant (E380).15SC Emergency Drought Response.p65152008/09/10, 11:56 AM
Lump-sum grants: The EDR project provided two lump-sum grants to each ‘cash plus food’ household,to boost <strong>the</strong>ir livelihood base <strong>and</strong> protect <strong>the</strong>ir assets aga<strong>in</strong>st ‘distress sales’ for food. The first grant of E450was made <strong>in</strong> <strong>the</strong> first month of cash distributions (November 2007), <strong>and</strong> this amount was based on <strong>the</strong>costs of seed, fertiliser <strong>and</strong> plough<strong>in</strong>g services required for one hectare of l<strong>and</strong>. The <strong>in</strong>tention was to support<strong>in</strong>vestment <strong>in</strong> family farm<strong>in</strong>g, to ensure a good harvest <strong>in</strong> 2008 <strong>and</strong> m<strong>in</strong>imise <strong>the</strong> risk of protracted food<strong>in</strong>security. People were however free to use <strong>the</strong> money for o<strong>the</strong>r purposes, such as start<strong>in</strong>g or <strong>in</strong>vest<strong>in</strong>g <strong>in</strong>ongo<strong>in</strong>g small bus<strong>in</strong>esses. One woman from Shiselweni, for <strong>in</strong>stance, used her <strong>in</strong>itial lump-sum payment tostart a chicken farm<strong>in</strong>g bus<strong>in</strong>ess. A second lump–sum grant of E380 was paid <strong>in</strong> <strong>the</strong> last month of <strong>the</strong>project (April 2008), to support post–drought recovery <strong>and</strong> stabilise livelihood activities. It also served <strong>the</strong>purpose of assist<strong>in</strong>g cash recipients make <strong>the</strong> transition out of <strong>the</strong> project, s<strong>in</strong>ce <strong>the</strong>y would no longerreceive any monthly cash payments.Bus<strong>in</strong>ess ventures that were part-f<strong>in</strong>anced by EDR cash transfers should be monitored for a reasonabletime-frame beyond <strong>the</strong> EDR project itself, to determ<strong>in</strong>e <strong>the</strong>ir profitability <strong>and</strong> <strong>the</strong> susta<strong>in</strong>ability of <strong>the</strong> cashimpacts. On a related po<strong>in</strong>t about susta<strong>in</strong>able livelihood impacts, several community members <strong>in</strong>terviewedfor this evaluation <strong>in</strong>dicated that <strong>the</strong>y lack bus<strong>in</strong>ess skills <strong>and</strong>, given <strong>the</strong> <strong>in</strong>creas<strong>in</strong>gly precarious nature offarm<strong>in</strong>gbased livelihoods, <strong>the</strong>y would welcome support <strong>in</strong> <strong>the</strong> form of tra<strong>in</strong><strong>in</strong>g <strong>and</strong> micro-f<strong>in</strong>ance to assist<strong>the</strong>m to diversify <strong>the</strong>ir livelihoods <strong>and</strong> reduce <strong>the</strong>ir dependence on subsistence-oriented agriculture. Ifsuccessful, provid<strong>in</strong>g this package of support would have <strong>the</strong> dual advantage of promot<strong>in</strong>g livelihoods <strong>and</strong>reduc<strong>in</strong>g poverty, <strong>the</strong>reby reduc<strong>in</strong>g <strong>the</strong> need for food aid or cash transfers <strong>in</strong> future. 4Supplements for non-food expenses: The project provided E20 to each household every month, tomeet <strong>the</strong> costs of essential nonfood items (e.g. soap) that were not <strong>in</strong>tended to be purchased us<strong>in</strong>g <strong>the</strong> cashgrant. A fur<strong>the</strong>r payment of E25 per household was <strong>in</strong>troduced to cover <strong>the</strong> costs of transport to <strong>the</strong>ircash distribution po<strong>in</strong>ts (<strong>the</strong> nearest Post Office or bank branch) every month. Like <strong>the</strong> ma<strong>in</strong> monthly cashtransfers, <strong>the</strong> payment levels of E20 <strong>and</strong> E25 respectively were also determ<strong>in</strong>ed based on an analysis of localprices, but <strong>the</strong>y were not calibrated by household size (transport costs to collection po<strong>in</strong>ts, for <strong>in</strong>stance,are no different for large or small households). Our survey found that average monthly spend<strong>in</strong>g on transportto <strong>the</strong> Post Office or ATM was E12.35 each way, so <strong>the</strong> payment of E25 was adequate. The survey alsorevealed that ‘cash plus food’ recipients spent significantly more on transport than did ‘food only’ recipients(see Figure 10 below), because food aid was delivered directly to communities, so this supplementarypayment was justified.2.2 Target<strong>in</strong>gTarget<strong>in</strong>g – <strong>the</strong> process of establish<strong>in</strong>g eligibility criteria, identify<strong>in</strong>g eligible households <strong>and</strong> exclud<strong>in</strong>g <strong>the</strong><strong>in</strong>eligible – is one of <strong>the</strong> biggest challenges fac<strong>in</strong>g social assistance programmes. Target<strong>in</strong>g for <strong>the</strong> EmergencyDrought Response project was implemented as part of <strong>the</strong> national consortium, <strong>and</strong> occurred at two levels:geographical coverage, <strong>and</strong> household selection.2.2.1 Geographical coverageThe first level of target<strong>in</strong>g was geographical. The EDR targeted food <strong>in</strong>secure households <strong>in</strong> two regions:Lubombo <strong>in</strong> <strong>the</strong> ‘Lowveld Cattle <strong>and</strong> Maize’ livelihood zone, <strong>and</strong> Shiselweni <strong>in</strong> <strong>the</strong> ‘Timber Highl<strong>and</strong>s’ livelihoodzone. Selection of <strong>the</strong>se regions was <strong>in</strong>formed by <strong>the</strong> Swazil<strong>and</strong> Vulnerability Assessment Committee (‘SwaziVAC’), which is widely used to identify areas <strong>and</strong> numbers of people <strong>in</strong> needof support.The ‘Lowveld Cattle <strong>and</strong> Maize’ zone has been characterised as drought–prone<strong>and</strong> food aid dependent. People <strong>in</strong> Lubombo Region are both chronically food<strong>in</strong>secure <strong>and</strong> acutely vulnerable to shocks.“The Lowveld Livelihood zone: About 70% of <strong>the</strong>ir food comes fromfood aid. On <strong>the</strong> o<strong>the</strong>r h<strong>and</strong> <strong>the</strong>re is no opportunity for exp<strong>and</strong>-ability <strong>in</strong><strong>in</strong>come sources. The very poor <strong>in</strong> this zone have both expenditure (E1690)<strong>and</strong> food deficits (42%) while <strong>the</strong> poor are faced with an expenditure deficit164 This model has been adopted by <strong>the</strong> ‘Productive Safety Net Programme’ <strong>in</strong> Ethiopia, where cash or food transfers that provide ‘livelihoodprotection’ are complemented by ‘Household Extension Packages’ that generate secondary <strong>in</strong>comes for farmers <strong>and</strong> aim at ‘livelihoodpromotion’.SC Emergency Drought Response.p65162008/09/10, 11:56 AM
(E1786). Agricultural production contributes very little <strong>in</strong> terms of food sources (about 6%), <strong>the</strong>y areexpected to rely more on purchases <strong>and</strong> will be affected by <strong>the</strong> rise <strong>in</strong> <strong>the</strong> price of maize. However, <strong>the</strong> foodaid masks this reality as even <strong>the</strong> middle <strong>in</strong>come group receives food aid (as of <strong>the</strong> basel<strong>in</strong>e year)” (SwaziVAC, 2007: 13).Unusually, <strong>the</strong> Highveld was affected almost as severely as <strong>the</strong> Lowveld by drought <strong>in</strong> 2006/07, receiv<strong>in</strong>gonly half (51%) of its longrun average ra<strong>in</strong>fall (FAO/WFP, 2007:8). However, food production <strong>in</strong> <strong>the</strong> ‘TimberHighl<strong>and</strong>s Livelihood Zone’ makes a relatively small contribution to household consumption, <strong>and</strong> livelihoodsare dom<strong>in</strong>ated by low wage seasonal employment on timber plantations.Generally, rural families <strong>in</strong> <strong>the</strong> highl<strong>and</strong>s are considered to be less vulnerableto drought-triggered harvest failure, because <strong>the</strong>ir <strong>in</strong>comes are more diversified.The Swazil<strong>and</strong> Vulnerability Assessment Committee reached precisely thisconclusion <strong>in</strong> its Rapid Assessment Report of May 2007:“The Timber Highl<strong>and</strong>s Livelihood zone:Agricultural labour (about 40%) <strong>and</strong> own production (about 20%) form <strong>the</strong>ma<strong>in</strong> sources of food for <strong>the</strong> very poor. Although <strong>the</strong> season is very poor<strong>the</strong>re is not likely to be an effect (deficit) as <strong>the</strong>ir sources of <strong>in</strong>come are notrelated to production” (Swazi VAC, 2007 12).Shortly after <strong>the</strong> Swazi VAC published this assessment, however, devastat<strong>in</strong>gforest fires underm<strong>in</strong>ed off-farm employment opportunities <strong>in</strong> <strong>the</strong> Highl<strong>and</strong>s,<strong>and</strong> <strong>the</strong> Timber Highl<strong>and</strong>s zone was reclassified as highly vulnerable <strong>and</strong> a priority for receiv<strong>in</strong>g emergencyassistance.In terms of coverage, <strong>the</strong> EDR reached a small proportion of households declared <strong>in</strong> need of humanitarianassistance <strong>in</strong> 2007/08. The target group was 7,500 households (45,000 people) <strong>in</strong> <strong>the</strong> two regions of Lubombo<strong>and</strong> Shiselweni, while <strong>the</strong> national emergency response programme targeted 450,000 people. So <strong>the</strong> EDRtook responsibility for 10% of <strong>the</strong> humanitarian caseload. In fact <strong>the</strong> f<strong>in</strong>al number of cash recipients was6,223 households (37,300 people), for reasons expla<strong>in</strong>ed below, which amounted to 8.3% of total beneficiariesnationwide. This could be seen as an enormous under-coverage or exclusion error (had <strong>the</strong> EDR been ast<strong>and</strong>-alone pilot project, for <strong>in</strong>stance), but <strong>the</strong> EDR was an <strong>in</strong>tegral part of <strong>the</strong> national humanitarian response,so <strong>the</strong> food security needs of <strong>the</strong> rema<strong>in</strong><strong>in</strong>g 91.7% of vulnerable <strong>in</strong>dividuals who did not receive cashtransfers were addressed by <strong>the</strong> Government of Swazil<strong>and</strong> (NDMA) <strong>and</strong> World <strong>Food</strong> Programme (WFP)food aid programmes.2.2.2 Household selectionThe VAC analysis identifies vulnerable areas but it does not go fur<strong>the</strong>r, to identify specific households <strong>and</strong><strong>in</strong>dividuals who should be prioritised for receiv<strong>in</strong>g relief assistance. The EDR project used a form ofcommunity-based target<strong>in</strong>g to select beneficiaries, follow<strong>in</strong>g target<strong>in</strong>g guidel<strong>in</strong>es developed by <strong>the</strong> <strong>Food</strong>Security Consortium <strong>and</strong> WFP. Community Relief Committees, compris<strong>in</strong>g <strong>in</strong>dividuals identified bycommunities to assist <strong>in</strong> coord<strong>in</strong>at<strong>in</strong>g relief activities (<strong>and</strong> are often beneficiaries <strong>the</strong>mselves) used <strong>the</strong>participatory technique of proportional pil<strong>in</strong>g to classify all households <strong>in</strong> <strong>the</strong>ir community <strong>in</strong>to three wealthcategories.Pile 1: Most vulnerable – people with no harvest, no employment <strong>and</strong> no means of survival; elderly,female <strong>and</strong> childheaded households; HIV <strong>and</strong> AIDSaffected people with no means of livelihood(chronically food <strong>in</strong>secure);Pile 2: Middle wealth group, but affected by <strong>the</strong> drought (temporarily food <strong>in</strong>secure);Pile 3: Welloff group (food secure, even <strong>in</strong> <strong>the</strong> drought year).In general, <strong>the</strong> criteria used were <strong>the</strong> same for ‘food only’ recipients. Accord<strong>in</strong>g to community consultations,<strong>the</strong> type of people classified <strong>in</strong> Pile 1 were generic vulnerable groups (‘children who have no parentssupport<strong>in</strong>g <strong>the</strong>m’, ‘elderly people look<strong>in</strong>g after orphans’, etc.) ra<strong>the</strong>r than households specifically affected bydrought or forest fire. This is a common outcome from community-based target<strong>in</strong>g: chronically vulnerablehouseholds tend to be selected ra<strong>the</strong>r than households left temporarily vulnerable by a livelihood shock.This may be an accurate reflection of <strong>the</strong> distribution of severe poverty <strong>and</strong> food <strong>in</strong>security with<strong>in</strong>communities, but it raises questions about which sources of vulnerability should be targeted by a droughtrelief <strong>in</strong>tervention.17SC Emergency Drought Response.p65172008/09/10, 11:56 AM
In Shiselweni region, households from Pile 1 only were selected for <strong>in</strong>clusion <strong>in</strong> <strong>the</strong> EDR project, while <strong>in</strong>Lubombo region households from both Pile 1 <strong>and</strong> Pile 2 were selected <strong>and</strong> registered, follow<strong>in</strong>g a decisionby <strong>the</strong> national consortium. The reason<strong>in</strong>g was that Shiselweni is generally better off <strong>and</strong> rarely needsemergency relief, whereas Lubombo is chronically vulnerable <strong>and</strong> dependent on food aid. None<strong>the</strong>less, thisis obviously a ra<strong>the</strong>r arbitrary decision rule – <strong>the</strong> assumption be<strong>in</strong>g that ‘Pile 2’ households <strong>in</strong> Lubombo areroughly equivalent <strong>in</strong> terms of <strong>in</strong>comes <strong>and</strong> assets as ‘Pile 1’ households <strong>in</strong> Shiselweni – <strong>and</strong> it highlights alimitation of participatory techniques like community-based wealth rank<strong>in</strong>g <strong>and</strong> proportional pil<strong>in</strong>g: <strong>the</strong>impossibility of compar<strong>in</strong>g across communities. Even if <strong>the</strong> decision to <strong>in</strong>clude ‘Pile 2’ households <strong>in</strong> Lubombois <strong>in</strong>tuitively justified by knowledge about relative levels of vulnerability between <strong>the</strong> two regions, this doesnot provide a methodology for <strong>the</strong> identification of vulnerable households. A more accurate <strong>and</strong> credibleapproach would <strong>in</strong>clude some way of benchmark<strong>in</strong>g <strong>the</strong> wealth rank<strong>in</strong>g, for <strong>in</strong>stance, us<strong>in</strong>g a ‘proxy meanstest’ that identifies 4-5 robust local <strong>in</strong>dicators of poverty or well-be<strong>in</strong>g, <strong>and</strong> supplement<strong>in</strong>g <strong>the</strong> wealthrank<strong>in</strong>g with this rapid assessment target<strong>in</strong>g tool.Our consultations with communities revealed that most people understood <strong>the</strong> criteria used for target<strong>in</strong>g,but <strong>the</strong>re was evidence of dissatisfaction <strong>and</strong> resentment about <strong>the</strong> target<strong>in</strong>g process <strong>and</strong> its outcomes bypeople who were not selected <strong>and</strong> did not receive cash or food transfers.A number of stakeholders <strong>in</strong>terviewed felt that <strong>the</strong> criteria for identification of beneficiaries were nei<strong>the</strong>rsufficiently specific nor clear. Strictly speak<strong>in</strong>g, target<strong>in</strong>g ‘drought-affected households’ excluded almostnoone <strong>in</strong> farm<strong>in</strong>g communities, <strong>and</strong> even relatively wealthy farmers asserted <strong>the</strong>ir right to compensation forcrop <strong>and</strong> livestock losses. (“We did not get anyth<strong>in</strong>g from our fields.”) In extremely food <strong>in</strong>secure communities,especially <strong>in</strong> Lubombo region, broadbased wealth rank<strong>in</strong>g resulted <strong>in</strong> very long lists of potential beneficiaries.Relief Committees members, be<strong>in</strong>g residents of <strong>the</strong> same communities where <strong>the</strong>y were implement<strong>in</strong>gtarget<strong>in</strong>g, faced social pressure to register as many people as possible, so <strong>the</strong>y often <strong>in</strong>cluded borderl<strong>in</strong>e orundeserv<strong>in</strong>g households <strong>in</strong> Pile 1. (One project staff member told us: “It’s good to have Relief Committeesbut you have to correct <strong>the</strong>ir wrong decisions <strong>and</strong> protect <strong>the</strong>m aga<strong>in</strong>st <strong>the</strong>ir communities.”) This practiceis allegedly more prevalent <strong>in</strong> Lubombo because of <strong>the</strong> many years of widespread distribution of food aid,which accord<strong>in</strong>g to some stakeholders has created a ‘dependency syndrome’ or ‘entitlement culture’ – allhouseholds feel <strong>the</strong>y should be registered to receive food aid or cash transfers. <strong>Food</strong> aid even becamepoliticised, <strong>in</strong> <strong>the</strong> sense that people believed it came from <strong>the</strong> K<strong>in</strong>g to support his drought-affected subjects<strong>and</strong> as such everyone should benefit.<strong>Save</strong> <strong>the</strong> <strong>Children</strong> implemented a rigorous verification <strong>and</strong> re-registration exercise <strong>in</strong> 10% of projectcommunities. This procedure identified large numbers of target<strong>in</strong>g errors. Most of <strong>the</strong>se were <strong>in</strong>clusionerrors: many households that were <strong>in</strong>itially classified as ‘Group 1’ (poorest’) were reclassified as ‘Group 2’(middle) or even ‘Group 3’ (better off) <strong>in</strong> <strong>the</strong> re-target<strong>in</strong>g exercise. Some ‘Group 2’ households were alsomoved to ‘Group 3’. Very few ‘Group 3’ households were reclassified as ‘Group 2’ or ‘Group 1’. The netresult was that <strong>the</strong> number of households eligible for food <strong>and</strong>/or cash assistance was reduced <strong>in</strong> almostevery community where <strong>the</strong> verification exercise was conducted. In one community alone, <strong>the</strong> verificationprocess reduced <strong>the</strong> number of households <strong>in</strong> ‘Group 1’ <strong>and</strong> ‘Group 2’ by 23% (see Box 1).18SC Emergency Drought Response.p65182008/09/10, 11:56 AM
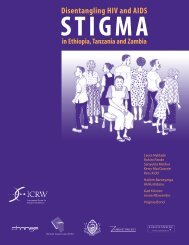
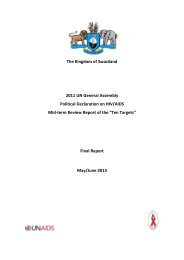
Box 1EDR retarget<strong>in</strong>g <strong>in</strong> one community<strong>Save</strong> <strong>the</strong> <strong>Children</strong>’s target<strong>in</strong>g verification exercise <strong>in</strong> one community of 368 households resulted <strong>in</strong> one<strong>in</strong> five households (76/368 =20.7%) be<strong>in</strong>g reclassified from poorer to wealthier categories, <strong>and</strong> <strong>the</strong>reforebe<strong>in</strong>g removed from <strong>the</strong> list of EDR project beneficiaries. Also, a recount of resident household membersidentified a total of 129 <strong>in</strong>dividuals as not be<strong>in</strong>g members of <strong>the</strong>se households as orig<strong>in</strong>ally claimed; thisamounted to a 7.4% over registration of beneficiaries (who were reduced from 2,007 to 1,878).HouseholdsBeneficiaries1st target Re-target 1st count Re-countGroup 1 158 (-13) 145 469 (-116) 353Group 2 170 (-63) 107 1,240 (-13) 1,227Group 3 40 (+76) 116 298 (0) 298Total 368 (+0) 368 2,007 (-129) 1,878Reasons recorded for reclassify<strong>in</strong>g 76 households from poorer to wealthier groups <strong>in</strong>cluded: Employed (eg teacher, driver, farm worker, m<strong>in</strong>er) [n=47] Supported by relatives (eg son, daughter, bro<strong>the</strong>r) [n=9] Owns property (eg livestock, motor car, tractor) [n=8] Has a public or private pension (eg teacher, widow) [n=7] Has own bus<strong>in</strong>ess (eg bakery, shop, commercial farm) [n=5]S<strong>in</strong>ce only one <strong>in</strong> ten communities were verified, <strong>the</strong>re appears to have been a substantial over-registrationof households (i.e. <strong>in</strong>clusion error) across <strong>the</strong> project area as a whole. The verification exercise found thattarget<strong>in</strong>g efficiency was 50-60% <strong>in</strong> Lubombo <strong>and</strong> a little higher <strong>in</strong> Shiselweni. In Lubombo, reclassification ofwealth groups 1 & 2 led to <strong>the</strong> removal of 890 people from <strong>the</strong> orig<strong>in</strong>al list of beneficiaries before <strong>the</strong>project started <strong>and</strong> ano<strong>the</strong>r 200 after <strong>the</strong> project started. Those removed <strong>in</strong>cluded salaried teachers, deadpeople, households that were ‘double dipp<strong>in</strong>g’ (hav<strong>in</strong>g more than one person registered), even a Member ofParliament.The removal of wealthy <strong>and</strong> powerful households from beneficiary lists created conflict between communitymembers <strong>and</strong> Relief Committees. After <strong>the</strong> project started, <strong>Save</strong> <strong>the</strong> <strong>Children</strong> staff also faced accusations ofdiscrim<strong>in</strong>at<strong>in</strong>g aga<strong>in</strong>st excluded households. (“Why are you giv<strong>in</strong>g <strong>the</strong> same people food <strong>and</strong> cash aga<strong>in</strong> <strong>and</strong>noth<strong>in</strong>g for us? Why give <strong>the</strong>m food <strong>and</strong> cash? Why not give some people food <strong>and</strong> give <strong>the</strong> cash to o<strong>the</strong>rs?”)In this context of raised expectations <strong>and</strong> resentment about exclusion, <strong>Save</strong> <strong>the</strong> <strong>Children</strong> should becommended for implement<strong>in</strong>g a rigorous re-target<strong>in</strong>g exercise, which o<strong>the</strong>r agencies distribut<strong>in</strong>g food aiddid not do.Ano<strong>the</strong>r source of error related to <strong>the</strong> number of <strong>in</strong>dividual household members registered for <strong>the</strong> EDRproject. S<strong>in</strong>ce payments of cash <strong>and</strong> food were made proportional to household size, <strong>the</strong>re was an obvious<strong>in</strong>centive to over-report or exaggerate household membership. <strong>Save</strong> <strong>the</strong> <strong>Children</strong> also verified beneficiarynumbers by re-count<strong>in</strong>g household members. This verification procedure identified significant levels ofoverreport<strong>in</strong>g of <strong>in</strong>dividuals, <strong>and</strong> hence of over-registration of beneficiary numbers.The problems experienced with target<strong>in</strong>g were not unique to cash transfers, <strong>and</strong> <strong>in</strong> a sense <strong>the</strong> EDR cashtransfer <strong>in</strong>tervention ‘<strong>in</strong>herited’ many of <strong>the</strong> challenges that Swazil<strong>and</strong> faces <strong>in</strong> target<strong>in</strong>g food aid. It is wellknown that many people who receive food aid don’t deserve or need it, yet <strong>the</strong> NDMA faces constantpressure from politicians to extend food distributions towards universal coverage, especially <strong>in</strong> electionyears. A survey by <strong>the</strong> Swazi VAC <strong>in</strong> 2006 found that <strong>the</strong>re was no correlation between <strong>the</strong> probability ofreceiv<strong>in</strong>g food aid <strong>and</strong> <strong>the</strong> recipient’s food security status, or wealth (Figure 4). Apart from a slight biastowards <strong>the</strong> poorest <strong>and</strong> most food <strong>in</strong>secure group, it appears that food aid was disbursed almost atr<strong>and</strong>om to <strong>the</strong> rural population.19SC Emergency Drought Response.p65192008/09/10, 11:56 AM
Figure 4 <strong>Food</strong> aid beneficiaries by food security <strong>and</strong> socioeconomic status, 2006100%80%60%40%0%<strong>Food</strong> Secure<strong>Food</strong> Aid Beneficiaries<strong>Food</strong> Insecure0%Poorest Poor Middle Best OffSource: Swazi VAC (2006)202.3 Delivery mechanismsThe EDR project delivered cash <strong>and</strong> food transfers through three mechanisms: direct distribution (all food,<strong>and</strong> cash for child-headed households), <strong>the</strong> Post Office (cash), <strong>and</strong> bank ATMs (cash). Note that a technicalevaluation of <strong>the</strong> role of bank accounts <strong>in</strong> deliver<strong>in</strong>g cash transfers was undertaken by F<strong>in</strong>Mark Trust (Beswick,2008), so those aspects are not exam<strong>in</strong>ed <strong>in</strong> depth here.2.3.1 <strong>Cash</strong>A key secondary objective of <strong>the</strong> EDR was to explore <strong>the</strong> potential for <strong>in</strong>tegration of emergency cashdelivery systems with<strong>in</strong> longer-term government social transfer programmes. With this <strong>in</strong> m<strong>in</strong>d, <strong>Save</strong> <strong>the</strong><strong>Children</strong> negotiated a contract with St<strong>and</strong>ard Bank to manage <strong>the</strong> EDR cash transfer operations. St<strong>and</strong>ardBank was already well established <strong>in</strong> Swazil<strong>and</strong> with a fairly wide network of branches, <strong>and</strong> it was bidd<strong>in</strong>g tomanage delivery of <strong>the</strong> government’s Old Age Grants. Ano<strong>the</strong>r attraction was that EDR cash recipientswould be given bank accounts <strong>and</strong> ATM cards, which fur<strong>the</strong>r enhanced <strong>the</strong> long-term sp<strong>in</strong>-off benefits –benefits that are not normally associated with manual cash delivery systems.St<strong>and</strong>ard Bank subcontracted <strong>the</strong> Post Office to h<strong>and</strong>le <strong>the</strong> actual disbursement of cash, until ATM cardswere <strong>in</strong>troduced <strong>in</strong> March when cash recipients had a choice between queu<strong>in</strong>g at <strong>the</strong> Post Office or us<strong>in</strong>gan ATM. Bank accounts were opened at St<strong>and</strong>ard Bank for 6,076 people, so that <strong>the</strong>y could access <strong>the</strong>ircash transfers at a bank or Post Office. This raised a legal obstacle – open<strong>in</strong>g a bank account requirespresent<strong>in</strong>g a national identity card – which many rural citizens (especially older persons) do not have. <strong>Save</strong><strong>the</strong> <strong>Children</strong> worked with <strong>the</strong> M<strong>in</strong>istry of Justice to help approximately 4,000 cash recipients get identitycards. This can be regarded as a useful secondary impact of <strong>the</strong> EDR project. Recipients paid for <strong>the</strong> costsof <strong>the</strong>ir identity cards, <strong>in</strong>clud<strong>in</strong>g transport for two visits (registration <strong>and</strong> collection) to <strong>the</strong> M<strong>in</strong>istry ofJustice.Anyone who did not have an identity card <strong>and</strong> chose not to get one could not open a bank account. Theywere <strong>the</strong>refore not registered for <strong>the</strong> cash transfer <strong>and</strong> received full food rations <strong>in</strong>stead. A third group of147 households was child-headed; be<strong>in</strong>g legal m<strong>in</strong>ors <strong>the</strong>y could not open bank accounts <strong>and</strong> <strong>the</strong>y received<strong>the</strong>ir cash <strong>and</strong> food transfers through direct distribution.St<strong>and</strong>ard Bank waived <strong>the</strong>ir m<strong>in</strong>imum balance requirement (E50) to allow project beneficiaries to open <strong>and</strong>ma<strong>in</strong>ta<strong>in</strong> bank accounts even if <strong>the</strong>y withdrew <strong>the</strong> entire cash payment every month. The beneficiaries werethus provided with a free bank account <strong>and</strong> an ATM card – ano<strong>the</strong>r useful secondary benefit of <strong>the</strong> project.From November to February all cash disbursements were made at Post Office branches, us<strong>in</strong>g swipe-cards<strong>and</strong> po<strong>in</strong>t-of-sale devices provided by St<strong>and</strong>ard Bank. On each monthly pay-day, hundreds of beneficiariesSC Emergency Drought Response.p65202008/09/10, 11:56 AM
queued outside <strong>the</strong>ir designated Post Office <strong>in</strong> a queue arranged alphabetically by surname. Especially <strong>in</strong> <strong>the</strong>early months of <strong>the</strong> project when <strong>the</strong> procedures were still unfamiliar to both Post Office staff <strong>and</strong>beneficiaries, this resulted <strong>in</strong> lengthy delays, with most people hav<strong>in</strong>g to wait several hours before receiv<strong>in</strong>g<strong>the</strong>ir cash.After <strong>the</strong> ATM cards were <strong>in</strong>troduced queu<strong>in</strong>g times fell dramatically, from 4.4 hours on average <strong>in</strong> Februaryto 1.9 hours <strong>in</strong> April (Figure 5). The ma<strong>in</strong> reason was a rapid uptake of <strong>the</strong> ATM option, with close to half ofall recipients choos<strong>in</strong>g to collect <strong>the</strong>ir cash transfers from <strong>the</strong>ir nearest ATM, which halved <strong>the</strong> length of <strong>the</strong>queues <strong>and</strong> eased congestion at <strong>the</strong> Post Office.Figure 5 Average queu<strong>in</strong>g times at Post Office or ATM to collect cash transfers54.8Hours4323.93.2Lubombo2.61.81Shiselweni0.80Feb Mar AprInitial concerns that recipients would be unwill<strong>in</strong>g or unable to switch to ATMs, due to Illiteracy <strong>and</strong>unfamiliarity with banks <strong>and</strong> ATM procedures, proved to be unfounded. In <strong>the</strong> first month (February) only3.5% of ‘cash plus food’ recipients withdrew <strong>the</strong>ir cash from an ATM, but this was ma<strong>in</strong>ly because of delays<strong>in</strong> distribut<strong>in</strong>g <strong>the</strong> ATM cards – due to a system failure, 4,000 PIN numbers were lost <strong>and</strong> St<strong>and</strong>ard Bankhad to repr<strong>in</strong>t all <strong>the</strong> cards. In <strong>the</strong> next month (March) <strong>the</strong> proportion us<strong>in</strong>g ATMs jumped to 42%, <strong>and</strong> by<strong>the</strong> third month (April) this had <strong>in</strong>creased to 55% (Figure 6), suggest<strong>in</strong>g rapidly <strong>in</strong>creas<strong>in</strong>g acceptance ofthis technology. Adoption was facilitated by tra<strong>in</strong><strong>in</strong>g <strong>in</strong> ATM use <strong>and</strong> personal support at ATMs on paydaysby a SC ‘po<strong>in</strong>t person’.People who switched from <strong>the</strong> Post Office to <strong>the</strong> bank gave several reasons for choos<strong>in</strong>g this option. Firstly,queues <strong>and</strong> transaction times were shorter, so <strong>the</strong> opportunity costs <strong>in</strong> terms of time spent collect<strong>in</strong>g cashwere reduced. (One young woman <strong>in</strong> <strong>the</strong> ATM queue told us: “I don’t underst<strong>and</strong> why everyone does notsave time <strong>and</strong> use <strong>the</strong> ATM <strong>in</strong>stead of <strong>the</strong> Post Office.”) Secondly, cash could be withdrawn at any time,unlike <strong>the</strong> Post Office which paid out only on a specific day each month. This flexibility is a feature of ‘push’delivery systems, which give recipients choice over when <strong>the</strong>y choose to access <strong>the</strong>ir transfers, <strong>in</strong> contrastto <strong>in</strong>flexible ‘pull’ systems which require recipients to congregate at a designated location on a specific date.Thirdly, use of <strong>the</strong> ATM allowed cash transfer recipients to leave some money <strong>in</strong> <strong>the</strong>ir account, so it offereda sav<strong>in</strong>gs facility. In our f<strong>in</strong>al evaluation survey, 32% of households that had bank accounts opened for <strong>the</strong>mby <strong>the</strong> EDR project reported that <strong>the</strong>y had left some of <strong>the</strong> cash transfers <strong>in</strong> <strong>the</strong>ir accounts as sav<strong>in</strong>gs, butdisaggregat<strong>in</strong>g by region reveals that <strong>the</strong> proportion was much higher <strong>in</strong> Shiselweni (62%) than <strong>in</strong> Lubombo(14%). This was not an option with <strong>the</strong> Post Office, where all cash had to be withdrawn on <strong>the</strong> pay-day itself.More broadly, <strong>the</strong> ATM gave account-holders ‘bank<strong>in</strong>g literacy’ <strong>and</strong> a possible entry-po<strong>in</strong>t <strong>in</strong>to o<strong>the</strong>r f<strong>in</strong>ancialservices.21SC Emergency Drought Response.p65212008/09/10, 11:56 AM
Figure 6 Proportion of recipients collect<strong>in</strong>g <strong>the</strong>ir cash transfers at Post Office or ATM100%95.6%97.3%Lubombo80%68.5%64.3%Shiselweni73.3%60%47.6%52.4%40%31.5%26.7%35.7%20%0%4.4%2.7%PO ATM PO ATMPOFeb Mar AprATMOne dubious advantage of <strong>the</strong> ATM was that no proof of identity was required, only a PIN code <strong>and</strong> an ATMcard. Some older people <strong>and</strong> people who were ill sent a relative or friend to withdraw <strong>the</strong>ir cash on <strong>the</strong>irbehalf. This was not recommended by ei<strong>the</strong>r <strong>Save</strong> <strong>the</strong> <strong>Children</strong> or St<strong>and</strong>ard Bank staff. In one <strong>in</strong>cidentreported from Shiselweni, a gr<strong>and</strong>son who knew his gr<strong>and</strong>mo<strong>the</strong>r’s PIN code stole her card <strong>and</strong> withdrewall her money for his own use. (This was anecdotal; <strong>the</strong>re was no evidence of systematic abuse of this k<strong>in</strong>d.)People who chose to rema<strong>in</strong> with <strong>the</strong> Post Office mentioned several reasons for not choos<strong>in</strong>g <strong>the</strong> ATMoption. First was fear of los<strong>in</strong>g <strong>the</strong>ir card <strong>and</strong>/or PIN code <strong>and</strong> be<strong>in</strong>g unable to access <strong>the</strong>ir funds. Secondly,many illiterate recipients (36.8% of beneficiaries <strong>in</strong> our survey had never attended school) admitted that<strong>the</strong>y found <strong>the</strong> ATM technology <strong>in</strong>timidat<strong>in</strong>g <strong>and</strong> preferred be<strong>in</strong>g assisted by Post Office tellers. Somebelieved if <strong>the</strong>y made a mistake on <strong>the</strong> keypad, or if <strong>the</strong>y took too long, <strong>the</strong>ir card would be swallowed <strong>and</strong>never returned to <strong>the</strong>m. (It is true that <strong>the</strong> ATM reta<strong>in</strong>ed <strong>the</strong> card after one m<strong>in</strong>ute.) Illiteracy might expla<strong>in</strong>regional differences <strong>in</strong> ATM use. In Lubombo where 46% of ‘cash plus food’ recipients had never attendedschool, only 36% used <strong>the</strong> ATM <strong>in</strong> April. In Shiselweni, where a much lower 28% had never attended school,<strong>the</strong> ATM adoption rate was a much higher 73% <strong>in</strong> April (Figure 6).Ano<strong>the</strong>r factor that might expla<strong>in</strong> a reluctance to switch to <strong>the</strong> ATM is bank charges. St<strong>and</strong>ard Bank charged<strong>Save</strong> <strong>the</strong> <strong>Children</strong> E20 for each transaction, to cover its costs. The bank allowed each account-holder onefree transaction every month, but charged E35 for every subsequent transaction. This relates to one f<strong>in</strong>alissue – attitudes <strong>and</strong> perceptions. Accord<strong>in</strong>g to several key <strong>in</strong>formants, poor people <strong>in</strong> Swazil<strong>and</strong> generallyhave a higher level of trust <strong>in</strong> <strong>the</strong> Post Office than <strong>in</strong> banks. They were also more familiar with <strong>the</strong> PostOffice. Many cash recipients were us<strong>in</strong>g <strong>the</strong> Post Office for various purposes before <strong>the</strong> EDR <strong>in</strong>tervention,such as receiv<strong>in</strong>g remittances, pay<strong>in</strong>g school fees <strong>and</strong> electricity bills. Banks are seen as commercial bus<strong>in</strong>essesthat take people’s money, but <strong>the</strong> Post Office is seen as a government service that gives people benefits.None<strong>the</strong>less, attitudes <strong>and</strong> perceptions can change. <strong>Cash</strong> recipients <strong>in</strong> <strong>the</strong> f<strong>in</strong>al evaluation survey wereasked whe<strong>the</strong>r <strong>the</strong>y would prefer (<strong>in</strong> future emergencies) to collect <strong>the</strong>ir money from an ATM or from <strong>the</strong>Post Office. Overall, 58% of respondents <strong>in</strong>dicated that <strong>the</strong>y preferred <strong>the</strong> ATM, <strong>and</strong> only 39% expressed apreference for <strong>the</strong> Post Office (Table 3). The vote <strong>in</strong> favour of ATMs was higher <strong>in</strong> Shiselweni region, at closeto 80% for both male <strong>and</strong> female-headed households. Households <strong>in</strong> Shiselweni are closer to Nhlanganotown <strong>and</strong> South Africa where many f<strong>in</strong>d work <strong>and</strong> <strong>in</strong>come, while many o<strong>the</strong>rs depend on employmentfrom local timber <strong>and</strong> forestry plantations. These factors mean that Shiselweni households are more <strong>in</strong>tegrated<strong>in</strong>to <strong>the</strong> cash economy, <strong>and</strong> could expla<strong>in</strong> why <strong>the</strong>y have a greater <strong>in</strong>cl<strong>in</strong>ation to use bank<strong>in</strong>g services forsav<strong>in</strong>gs <strong>and</strong> o<strong>the</strong>r f<strong>in</strong>ancial transactions. Among households that opened bank accounts dur<strong>in</strong>g <strong>the</strong> EDRproject, 73% of respondents <strong>in</strong> Shiselweni <strong>and</strong> 50% <strong>in</strong> Lubombo reported that <strong>the</strong>y <strong>in</strong>tend to cont<strong>in</strong>ueus<strong>in</strong>g <strong>the</strong>ir bank account <strong>and</strong> ATM facilities after <strong>the</strong> project ends.22SC Emergency Drought Response.p65222008/09/10, 11:56 AM
Table 3 Household preferences for collect<strong>in</strong>g future cash transfersRegion Household type ATM/Bank Post Office Not sure TotalLubombo Male-headed 51.5% 46.5% 1.9% 100%Female-headed 34.6% 63.6% 1.8% 100%Child-headed 100.0% 0% 0% 100%Total Lowveld 45.4% 52.7% 1.9% 100%Shiselweni Male-headed 77.7% 18.8% 3.6% 100%Female-headed 79.2% 17.3% 3.5% 100%Total Highl<strong>and</strong>s 78.5% 18.0% 3.5% 100%Total 58.4% 39.1% 2.5% 100%2.3.2 <strong>Food</strong>For both ‘food only’ <strong>and</strong> ‘cash plus food’ recipients, food transfers were delivered by direct distribution at‘f<strong>in</strong>al distribution po<strong>in</strong>ts’ (FDPs) <strong>in</strong> each rural community. (Some cash recipients, especially older people <strong>and</strong>people with disabilities, felt that <strong>the</strong> cash should have been delivered <strong>the</strong> same way, ra<strong>the</strong>r than hav<strong>in</strong>g totravel long distances <strong>and</strong> queu<strong>in</strong>g for hours.) There were two food aid pipel<strong>in</strong>es – one operated by government(NDMA) <strong>and</strong> one operated by <strong>in</strong>ternational donors (WFP). The EDR can <strong>the</strong>refore be seen as a partnershipbetween government (NDMA), donors (WFP) <strong>and</strong> an NGO (<strong>Save</strong> <strong>the</strong> <strong>Children</strong>). WFP delivered a doubleration every second month. On <strong>the</strong> o<strong>the</strong>r h<strong>and</strong>, <strong>the</strong> food pipel<strong>in</strong>e was disrupted more than once dur<strong>in</strong>g <strong>the</strong>humanitarian relief programme, most severely dur<strong>in</strong>g <strong>the</strong> last two months of <strong>the</strong> cash transfer project(March <strong>and</strong> April), when no food aid was distributed <strong>in</strong> Swazil<strong>and</strong> at all. For <strong>the</strong>se two months, ‘cash plusfood’ recipients received only <strong>the</strong>ir normal cash transfer, equivalent to a half ration of food, while ‘food only’recipients received noth<strong>in</strong>g.These breaks <strong>in</strong> <strong>the</strong> food aid pipel<strong>in</strong>e complicate our assessment of <strong>the</strong> impacts of <strong>the</strong> EDR project, <strong>and</strong>especially of <strong>the</strong> cash transfer component, s<strong>in</strong>ce <strong>the</strong> cash <strong>and</strong> food toge<strong>the</strong>r make up a full relief package. In<strong>the</strong> early months of <strong>the</strong> project, both sets of recipients spent decl<strong>in</strong><strong>in</strong>g amounts on food, as food transfersreduced <strong>the</strong> need for market purchases. With pipel<strong>in</strong>e breaks <strong>in</strong> <strong>the</strong> early months of 2008, this trendreversed <strong>and</strong> spend<strong>in</strong>g on food started to <strong>in</strong>crease. In March, when no food was distributed, ‘food only’recipients were spend<strong>in</strong>g almost as much on food purchases as ‘cash plus food’ recipients (Figure 7).Figure 7 Effects of food pipel<strong>in</strong>e disruption on spend<strong>in</strong>g on food (E/month)300250200<strong>Cash</strong> + <strong>Food</strong>Recipients15010050<strong>Food</strong> OnlyRecipients0Nov Dec Jan Feb Mar23SC Emergency Drought Response.p65232008/09/10, 11:56 AM
24<strong>Save</strong> <strong>the</strong> <strong>Children</strong> could perhaps be criticised for fail<strong>in</strong>g to <strong>in</strong>crease cash transfers to compensate recipientsfor <strong>the</strong> lack of food aid <strong>in</strong> March <strong>and</strong> April. This was certa<strong>in</strong>ly one option: s<strong>in</strong>ce <strong>Save</strong> <strong>the</strong> <strong>Children</strong> hadassumed responsibility for <strong>the</strong> food security of 37,000 drought-affected people, disburs<strong>in</strong>g a full ration <strong>in</strong><strong>the</strong> form of cash would have assured <strong>the</strong>m of protection aga<strong>in</strong>st hunger throughout <strong>the</strong> pre-harvest months.On <strong>the</strong> o<strong>the</strong>r h<strong>and</strong>, this would ignore <strong>the</strong> wider context of <strong>the</strong> humanitarian <strong>in</strong>tervention. The fact that <strong>the</strong>EDR targeted a relatively small group with<strong>in</strong> a much larger food aid programme already raised questionsabout discrim<strong>in</strong>atory treatment between cash <strong>and</strong> food recipients. Increas<strong>in</strong>g cash transfers to a m<strong>in</strong>oritywhen food aid failed to be delivered to <strong>the</strong> majority would have exacerbated tensions with<strong>in</strong> communities<strong>and</strong> possibly provoked hostility towards <strong>Save</strong> <strong>the</strong> <strong>Children</strong>. As one staff member told us: “Doubl<strong>in</strong>g onehousehold’s cash ration while <strong>the</strong>ir neighbour’s food ration is cut to noth<strong>in</strong>g would seem unfair <strong>and</strong>unjustifiable.”In any event, <strong>the</strong> underly<strong>in</strong>g problem was <strong>in</strong>adequate communication <strong>and</strong> coord<strong>in</strong>ation between differentstakeholders <strong>in</strong> <strong>the</strong> relief programme. NDMA constantly assured o<strong>the</strong>r members of <strong>the</strong> <strong>Food</strong> SecurityConsortium that food would be arriv<strong>in</strong>g at any time, <strong>and</strong> on this basis <strong>Save</strong> <strong>the</strong> <strong>Children</strong> decided not toadjust its cash payments when food failed to arrive. The policy implication is related not to cash transfersbut to relief management – clear <strong>and</strong> transparent communications <strong>and</strong> jo<strong>in</strong>t plann<strong>in</strong>g are prerequisites, if<strong>the</strong> humanitarian objective of meet<strong>in</strong>g <strong>the</strong> subsistence needs of vulnerable <strong>in</strong>dividuals timeously is to beprioritised <strong>and</strong> achieved.2.3.3 ‘Customer care’It is <strong>in</strong>creas<strong>in</strong>gly accepted that recipients of social grants should be treated with respect <strong>and</strong> that everyeffort should be made to maximise <strong>the</strong> accessibility <strong>and</strong> flexibility of registration <strong>and</strong> grant collectionprocedures. Perhaps ‘beneficiaries’ should even be relabelled as ‘customers’ or ‘clients’ or at least as‘participants’, to re<strong>in</strong>force this enhanced status <strong>and</strong> concern for <strong>the</strong> <strong>in</strong>dividual’s dignity <strong>and</strong> self-respect. Wehave already seen how <strong>the</strong> EDR project successfully reduced queu<strong>in</strong>g times <strong>and</strong> provided project participantswith identity documents, bank accounts <strong>and</strong> ATM cards to allow cash recipients to access <strong>and</strong> manage <strong>the</strong>irtransfers at <strong>the</strong>ir own convenience. Here we consider some related aspects of ‘customer care’ around <strong>the</strong>delivery of cash transfers – transport to <strong>and</strong> from paypo<strong>in</strong>ts, security at paypo<strong>in</strong>ts, <strong>and</strong> <strong>the</strong> environment atpaypo<strong>in</strong>ts.Transport<strong>Cash</strong> recipients made <strong>the</strong>ir own way from <strong>the</strong>ir homes to paypo<strong>in</strong>ts <strong>and</strong> home aga<strong>in</strong> afterwards. Because<strong>the</strong> cash was disbursed through Post Offices <strong>and</strong> St<strong>and</strong>ard Bank branches or ATM po<strong>in</strong>ts, distances to <strong>the</strong>nearest paypo<strong>in</strong>t were quite far for some – up to 30 kilometres <strong>in</strong> a few cases. (By contrast, food rationswere delivered directly to rural communities.) Because of <strong>the</strong>se distances, only 10% of people were residentwith<strong>in</strong> walk<strong>in</strong>g distance of <strong>the</strong>ir pay-po<strong>in</strong>t; 88% used public transport (bus or taxi); <strong>and</strong> a small m<strong>in</strong>ority used<strong>the</strong>ir own vehicle (bicycle or ox-cart). In <strong>the</strong> early months of <strong>the</strong> project some people were reportedly leftstr<strong>and</strong>ed due to lack of transport after queu<strong>in</strong>g all day at <strong>the</strong> Post Office, but taxi-drivers quickly realisedthat <strong>the</strong>re was good bus<strong>in</strong>ess to be done on paydays, <strong>and</strong> taxi-ranks formed outside Post Offices <strong>and</strong> banksto ferry cash recipients back home.Average spend<strong>in</strong>g by cash recipients on public transport to paypo<strong>in</strong>ts was E12.35 return. Public transportcosts <strong>in</strong>creased dur<strong>in</strong>g <strong>the</strong> project period, accord<strong>in</strong>g to some respondents by as much as 40-50%. Therewas consensus that this <strong>in</strong>crease was due to rapidly ris<strong>in</strong>g food prices <strong>in</strong> <strong>the</strong> country as a whole, <strong>and</strong> wasnot an <strong>in</strong>flationary effect related to <strong>the</strong> cash transfers. As noted above, <strong>Save</strong> <strong>the</strong> <strong>Children</strong> provided asupplementary payment of E25 to cash recipients to cover transport costs, which ensured that <strong>the</strong> netvalue of <strong>the</strong> monthly cash transfer was not reduced by <strong>the</strong> transactions costs <strong>in</strong>curred <strong>in</strong> collect<strong>in</strong>g it.SecurityAppropriate security precautions were taken to ensure that EDR project participants could collect <strong>the</strong>ircash safely. There were no reported <strong>in</strong>cidents of <strong>the</strong>ft or robbery at Post Offices, banks or ATMs dur<strong>in</strong>g <strong>the</strong>EDR project period. <strong>Save</strong> <strong>the</strong> <strong>Children</strong> <strong>in</strong>formed <strong>the</strong> Royal Swazil<strong>and</strong> Police when <strong>and</strong> where cash paymentswere happen<strong>in</strong>g, <strong>and</strong> <strong>the</strong> police provided security at pay-po<strong>in</strong>ts free of charge. Our personal observation ofa pay-day <strong>in</strong> Siphofaneni confirmed that an armed policeman patrolled <strong>the</strong> environment around <strong>the</strong> PostOffice all morn<strong>in</strong>g. At <strong>the</strong> St<strong>and</strong>ard Bank ATM across <strong>the</strong> street, a security guard armed with a rifle stoodguard at <strong>the</strong> ATM while EDR cash recipients queued to withdraw <strong>the</strong>ir cash.SC Emergency Drought Response.p65242008/09/10, 11:56 AM
Pay-po<strong>in</strong>t environmentAccord<strong>in</strong>g to one key <strong>in</strong>formant, one old woman collapsed of heatstroke while queu<strong>in</strong>g outside SiphofaneniPost Office early <strong>in</strong> <strong>the</strong> project (this report could not be verified), so <strong>Save</strong> <strong>the</strong> <strong>Children</strong> hired a largemarquee tent to provide shelter from <strong>the</strong> sun. A water-tank was also provided to assist people suffer<strong>in</strong>gfrom heat stress.A few negative <strong>in</strong>cidents were reported by cash recipients as happen<strong>in</strong>g to <strong>the</strong>m while <strong>the</strong>y were collect<strong>in</strong>g<strong>the</strong>ir cash (see Table 4). These ranged from <strong>the</strong>ft of cash transfers (18 cases or 1.2% of recipients), todrunkenness on pay-days (admitted by 15 or 1.2% of cash recipients), to verbal abuse by St<strong>and</strong>ard Bank,Post Office or <strong>Save</strong> <strong>the</strong> <strong>Children</strong> staff (9 cases or 0.7%). The most commonly reported unpleasant eventwas ‘conflict or fight<strong>in</strong>g’ at pay-po<strong>in</strong>ts (31 cases or 2.4% of cash recipients). None<strong>the</strong>less, <strong>the</strong> numbers areso small for all <strong>the</strong>se negative <strong>in</strong>cidents that <strong>the</strong>y can be considered as anecdotal or episodic ra<strong>the</strong>r thansystematic. Most of <strong>the</strong>m – with <strong>the</strong> exception of bad treatment of cash recipients by staff – are alsobeyond <strong>the</strong> control of project staff. Most reported <strong>the</strong>fts, for <strong>in</strong>stance, occurred after cash recipients left<strong>the</strong> Post Office or bank, as <strong>the</strong>y were head<strong>in</strong>g home.Table 4 Negative <strong>in</strong>cidents reported by cash recipients at paypo<strong>in</strong>tsIncident Lubombo Shiselweni CHH TotalTheft of cash transfers 12 (1.6%) 2 (0.4%) 2 (2.9%) 16 (1.2%)Theft of o<strong>the</strong>r property 2 (0.3%) 2 (0.4%) 2 (2.9%) 6 (0.5%)Drunkenness 13 (1.7%) 2 (0.4%) 0 (0.0%) 15 (1.2%)Verbal abuse by SC staff 2 (0.3%) 1 (0.2%) 0 (0.0%) 3 (0.2%)Verbal abuse by PO staff 3 (0.4%) 1 (0.2%) 0 (0.0%) 4 (0.3%)Verbal abuse by Bank staff 1 (0.1%) 1 (0.2%) 0 (0.0%) 2 (0.1%)Physical abuse 4 (0.5%) 1 (0.2%) 1 (1.5%) 6 (0.5%)Sexual abuse 1 (0.1%) 1 (0.2%) 0 (0.0%) 2 (0.2%)Conflict or fight<strong>in</strong>g 22 (3.0%) 9 (1.9%) 0 (0.0%) 31 (2.4%)Total households 743 (100%) 482 (100%) 68 (100%) 1,293 (100%)2.4 Cost-efficiency <strong>and</strong> cost-effectivenessAn assumption often made about social transfers is that deliver<strong>in</strong>g cash is considerably cheaper than deliver<strong>in</strong>gfood, ma<strong>in</strong>ly because <strong>the</strong> costs of shipp<strong>in</strong>g, storage <strong>and</strong> transport are very high for food aid but are negligiblefor cash transfers. In reality, however, cash transfers have <strong>the</strong>ir own associated costs that can challenge thisassumption. Because <strong>the</strong> Emergency Drought Response project (unusually) distributed both cash <strong>and</strong> food,a direct cost comparison is possible. Detailed cost data are available, <strong>and</strong> are presented <strong>in</strong> this section.The ma<strong>in</strong> direct costs of <strong>the</strong> EDR project were <strong>the</strong> transfers <strong>the</strong>mselves. The average monthly cost perhousehold of <strong>the</strong> food transfers (maize, pulses, oil) came to E344.50, based on an actual average householdsize of 6.5 <strong>in</strong>dividuals <strong>and</strong> food costs provided by NDMA. The average monthly cost per household of <strong>the</strong>cash transfers came to E468.37, based on <strong>the</strong> local price of a full food ration (Table 5). This means that <strong>the</strong>assistance provided directly to each cash recipient household cost E123.87 more than <strong>the</strong> assistance providedto food recipient households – to be precise, 36% more.The costs of manag<strong>in</strong>g <strong>and</strong> deliver<strong>in</strong>g <strong>the</strong>se transfers amounted to E39.33 for food <strong>and</strong> E29.55 for cash perhousehold per month. For food <strong>the</strong> ma<strong>in</strong> costs were: field <strong>and</strong> support staff (E16.19), transport (E12.50)<strong>and</strong> delivery expenses (E8.64). For cash <strong>the</strong> ma<strong>in</strong> costs were bank charges (E20.04) <strong>and</strong> tra<strong>in</strong><strong>in</strong>g (E4.58).Staff costs were much lower than for food (E3.21) <strong>and</strong> transport costs were negligible (E0.88) (Table 5). Aspredicted, cash transfers did cost less to adm<strong>in</strong>ister than food. However, add<strong>in</strong>g all <strong>the</strong>se costs to <strong>the</strong> directtransfer costs means that overall, <strong>the</strong> additional cost of distribut<strong>in</strong>g cash amounted to E114.09 per householdper month, or 29.7% more than <strong>the</strong> cost of distribut<strong>in</strong>g food <strong>in</strong>-k<strong>in</strong>d.25SC Emergency Drought Response.p65252008/09/10, 11:56 AM
26Table 5 Costs of food <strong>and</strong> cash distribution (E/household/month)Costs <strong>Food</strong> <strong>Cash</strong> Difference(<strong>Food</strong>–<strong>Cash</strong>)Direct CostsBank charges 0.042 0.04 20.00Delivery charges 8.64 0.00 8.64<strong>Food</strong> CostsMaize 182.00 0.00 182.00Pulses 104.00 0.00 104.00Oil 58.50 0.00 58.50<strong>Cash</strong> Payment 0.00 468.37 468.37Support CostsVehicle costsCar Hire 5.00 0.00 5.00Fuel & Ma<strong>in</strong>tenance 7.50 0.88 6.62HR CostsField StaffField Coord<strong>in</strong>ator 2.25 0.00 2.25Field Officers 7.00 2.33 4.67Drivers 1.49 0.50 0.99Support StaffF<strong>in</strong>ance staff 0.00 0.38 0.38Logistics staff 1.91 0.00 1.91Warehouse officers 0.28 0.00 0.28Loaders 2.17 0.00 2.17Security Guards 1.09 0.00 1.09Adm<strong>in</strong>istration CostsPr<strong>in</strong>t<strong>in</strong>g costsRation cards 0.14 0.00 0.14Waybills etc 0.90 0.00 0.90Communications 0.92 0.23 0.69Oneoff costs (spread over <strong>the</strong> lifeof <strong>the</strong> project)Registration costs 0.00 0.61 0.61Tra<strong>in</strong><strong>in</strong>g costs 0.00 4.58 4.58Totals 383.83 497.92 114.09Source: Data provided by <strong>Save</strong> <strong>the</strong> <strong>Children</strong> Swazil<strong>and</strong>A reasonable conclusion to draw from this analysis is that distribut<strong>in</strong>g cash transfers is more expensive th<strong>and</strong>istribut<strong>in</strong>g food aid. The ma<strong>in</strong> reason for this is not <strong>the</strong> actual delivery costs but economies of scale <strong>in</strong>commodity costs – import<strong>in</strong>g food <strong>in</strong> bulk at wholesale prices is cheaper than giv<strong>in</strong>g people cash to buy <strong>the</strong>equivalent food at retail prices <strong>in</strong> local markets. Two important qualifiers should be taken <strong>in</strong>to consideration,however.Firstly, <strong>the</strong> actual transfers to recipients accounted for over 90% of total project costs, but this proportion– known as <strong>the</strong> ‘alpharatio’ – was higher for cash (94.1%) than for food (89.8%). This means that cash wasmore cost-efficient than food. The proportion of total costs that went to project management was only5.9% <strong>in</strong> <strong>the</strong> case of cash, but it was 10.2% <strong>in</strong> <strong>the</strong> case of food.SC Emergency Drought Response.p65262008/09/10, 11:56 AM
Secondly, <strong>the</strong> <strong>in</strong>tention of <strong>the</strong> EDR project was to provide <strong>the</strong> equivalent <strong>in</strong> cash of a half food ration, so amore appropriate comparison of costs would hold transfer costs constant (i.e. assume both food <strong>and</strong> cashcost E344.50 per household per month) <strong>and</strong> compare only management <strong>and</strong> delivery costs. On this basis,too, cash transfers appear to be more cost-efficient than food aid: at E39.33 per household per month,deliver<strong>in</strong>g food transfers cost 33% more than deliver<strong>in</strong>g <strong>the</strong> cash equivalent, at E29.55.In short, <strong>the</strong> only reason why food was cheaper to transfer than cash was because import<strong>in</strong>g food aid <strong>in</strong>bulk was considerably cheaper than buy<strong>in</strong>g <strong>the</strong> same food at retail prices on local markets. This pricedifferential is not a factor that is normally considered when compar<strong>in</strong>g food <strong>and</strong> cash transfers, but it was<strong>the</strong> critical determ<strong>in</strong>ant <strong>in</strong> <strong>the</strong> Swazil<strong>and</strong> EDR project.This analysis is <strong>the</strong>refore <strong>in</strong>conclusive on <strong>the</strong> question of cost-efficiency. <strong>Food</strong> is clearly <strong>the</strong> more efficienttransfer if <strong>the</strong>re is a significant price differential between imported food aid <strong>and</strong> food purchased locally us<strong>in</strong>gcash transfers, but cash is more efficient <strong>in</strong> terms of management <strong>and</strong> delivery, because <strong>the</strong> h<strong>and</strong>l<strong>in</strong>g costs(staff<strong>in</strong>g, transport) for food exceed <strong>the</strong> bank charges <strong>and</strong> o<strong>the</strong>r costs associated with disburs<strong>in</strong>g cash.On <strong>the</strong> more complex issue of cost-effectiveness, this f<strong>in</strong>ancial analysis is <strong>in</strong>adequate because costs need tobe expressed <strong>in</strong> relation to impacts. In <strong>the</strong> next chapter we present empirical evidence on impacts thatsuggests that EDR cash transfers achieved far more substantial <strong>and</strong> diverse impacts than did food transfers,on a range of <strong>in</strong>dicators. Some of <strong>the</strong>se outcomes are <strong>in</strong>tangible, such as ‘choice, dignity <strong>and</strong> empowerment’,but <strong>the</strong> overall conclusion we would draw is that cash transfers were almost certa<strong>in</strong>ly more cost-effectivethan food transfers, because <strong>the</strong> positive impacts derived from equivalent transfers of cash <strong>and</strong> food werehigher for cash.2.5 Tra<strong>in</strong><strong>in</strong>g, mobilisation <strong>and</strong> sensitisationAn important reason for <strong>the</strong> success of <strong>the</strong> Emergency Drought Response project was <strong>the</strong> heavy <strong>in</strong>vestmentby project staff <strong>in</strong> community mobilisation, tra<strong>in</strong><strong>in</strong>g <strong>and</strong> sensitisation. Apart from tra<strong>in</strong><strong>in</strong>g of temporary staffwho were recruited specifically for <strong>the</strong> EDR project (e.g. warehouse supervisors who received <strong>and</strong> dispatchedproject materials; M&E staff who collected data from beneficiaries <strong>and</strong> non-beneficiaries <strong>and</strong> monitoredprices <strong>in</strong> local markets), communities <strong>and</strong> beneficiaries received almost cont<strong>in</strong>uous <strong>in</strong>formation updates<strong>and</strong> tra<strong>in</strong><strong>in</strong>g on various aspects of <strong>the</strong> <strong>in</strong>tervention. Although <strong>the</strong> scope of this evaluation did not <strong>in</strong>clude anassessment of <strong>the</strong>se activities, it is clear from our discussions with beneficiaries, communities <strong>and</strong> o<strong>the</strong>rstakeholders that <strong>the</strong>y made a major contribution to ensur<strong>in</strong>g broad acceptance <strong>and</strong> effective implementationof <strong>the</strong> cash transfer <strong>in</strong>novation. Key tra<strong>in</strong><strong>in</strong>g <strong>and</strong> sensitisation activities <strong>in</strong>cluded <strong>the</strong> follow<strong>in</strong>g.1. Publicity <strong>and</strong> communications:An <strong>in</strong>country communication strategy was devised to expla<strong>in</strong> <strong>the</strong> cash transfer <strong>in</strong>tervention to <strong>the</strong> widerpublic <strong>in</strong> Swazil<strong>and</strong>. This <strong>in</strong>cluded a poster campaign with story-boards <strong>and</strong> cartoons posted <strong>in</strong> shops, postoffices <strong>and</strong> o<strong>the</strong>r public build<strong>in</strong>gs; a radio show which debated cash transfers as a response to <strong>the</strong> foodcrisis; <strong>and</strong> newspaper articles expla<strong>in</strong><strong>in</strong>g <strong>the</strong> rationale for <strong>the</strong> cash-based <strong>in</strong>tervention.2. Stakeholder engagement:Members of <strong>the</strong> Swazil<strong>and</strong> <strong>Food</strong> Security Consortium, NGOs <strong>and</strong> donors were <strong>in</strong>vited to observe a cashdistribution ‘open day’. A brief<strong>in</strong>g document was circulated to government m<strong>in</strong>istries, <strong>and</strong> several meet<strong>in</strong>gswere held with government officials. Lesson learn<strong>in</strong>g meet<strong>in</strong>gs to review <strong>and</strong> improve cash disbursementprocedures were held between <strong>Save</strong> <strong>the</strong> <strong>Children</strong>, St<strong>and</strong>ard Bank <strong>and</strong> <strong>the</strong> Swazi Post Office.3. Community sensitisation:Communities were briefed about <strong>the</strong> <strong>in</strong>troduction of <strong>the</strong> cash transfers, how <strong>the</strong>y were calculated, how<strong>the</strong> cash transfers <strong>and</strong> food aid <strong>in</strong>teracted with each o<strong>the</strong>r, <strong>and</strong> related issues. Dur<strong>in</strong>g <strong>the</strong> project period,communities were briefed about aspects such as <strong>the</strong> use of ATMs, with communication through local ReliefCommittees, teachers, <strong>in</strong>formation posters, <strong>and</strong> a weekly slot at constituency meet<strong>in</strong>gs to update <strong>the</strong> traditionalstructures <strong>and</strong> <strong>in</strong>ner councils.4. Target<strong>in</strong>g:Relief Committees <strong>in</strong> <strong>the</strong> project areas were tra<strong>in</strong>ed <strong>in</strong> how to adm<strong>in</strong>ister <strong>the</strong> target<strong>in</strong>g methodology(community wealth rank<strong>in</strong>g) <strong>and</strong> how to select eligible households for <strong>in</strong>clusion <strong>in</strong> <strong>the</strong> EDR project.27SC Emergency Drought Response.p65272008/09/10, 11:56 AM
5. Registration:Staff were tra<strong>in</strong>ed to collect detailed <strong>and</strong> accurate demographic <strong>and</strong> o<strong>the</strong>r <strong>in</strong>formation about householdsregistered for <strong>the</strong> EDR project, which was important because this determ<strong>in</strong>ed <strong>the</strong> level of cash <strong>and</strong>/or foodentitlements.6. Documentation:<strong>Cash</strong> recipients received support from SC project staff <strong>in</strong> complet<strong>in</strong>g <strong>the</strong>ir ID application forms <strong>and</strong> <strong>the</strong>irbank account application forms.7. <strong>Cash</strong> collection:<strong>Save</strong> <strong>the</strong> <strong>Children</strong> ‘po<strong>in</strong>t persons’ assisted cash recipients <strong>in</strong> complet<strong>in</strong>g <strong>the</strong>ir ‘cash request form’ forwithdraw<strong>in</strong>g money from <strong>the</strong>ir accounts at <strong>the</strong> Post Office, <strong>and</strong> expla<strong>in</strong>ed to ATM users how to use <strong>the</strong>keypad to withdraw money from <strong>the</strong> bank.8. F<strong>in</strong>ancial management:300 posters were pr<strong>in</strong>ted <strong>and</strong> prom<strong>in</strong>ently displayed <strong>in</strong> public places, with messages about <strong>the</strong> importanceof sav<strong>in</strong>g cash <strong>and</strong> food.9. Bank accounts:<strong>Save</strong> <strong>the</strong> <strong>Children</strong> worked with St<strong>and</strong>ard Bank to make <strong>the</strong>ir <strong>in</strong>formation pamphlets more user-friendly,<strong>in</strong>clud<strong>in</strong>g translat<strong>in</strong>g <strong>the</strong>m from English <strong>in</strong>to Siswati. Bank account-holders participated <strong>in</strong> a tra<strong>in</strong><strong>in</strong>g coursecalled ‘Bank Accounts: Know your rights’, compris<strong>in</strong>g lectures, Q&A <strong>and</strong> advice on how to access advice<strong>and</strong> support from <strong>the</strong> bank. Ano<strong>the</strong>r tra<strong>in</strong><strong>in</strong>g session on ‘Legal Inheritance’ was led by Women <strong>and</strong> Law <strong>in</strong>Sou<strong>the</strong>rn Africa (WLSA), cover<strong>in</strong>g <strong>the</strong> procedure for claim<strong>in</strong>g <strong>in</strong>heritance <strong>in</strong> Swazil<strong>and</strong>, <strong>in</strong>clud<strong>in</strong>g list<strong>in</strong>g abank account as an asset, <strong>and</strong> writ<strong>in</strong>g a will. Two leaflets were produced <strong>and</strong> distributed.10. Child-headed households received special attention, <strong>in</strong>clud<strong>in</strong>g tra<strong>in</strong><strong>in</strong>g <strong>in</strong> manag<strong>in</strong>g <strong>the</strong>ir f<strong>in</strong>ances<strong>and</strong> more general life skills.11. Exit strategy:In April 2008, focal persons with<strong>in</strong> communities were identified <strong>and</strong> tra<strong>in</strong>ed to act as advisors to accountholdersafter <strong>the</strong> project ended. The 2-day tra<strong>in</strong><strong>in</strong>g course covered f<strong>in</strong>ancial literacy (bank rights <strong>and</strong> charges),<strong>in</strong>heritance rights (access<strong>in</strong>g money from a bank account when <strong>the</strong> account-holder dies), <strong>and</strong> child protection.Box 2 elaborates on one tra<strong>in</strong><strong>in</strong>g session that was delivered by <strong>Save</strong> <strong>the</strong> <strong>Children</strong> project staff, toge<strong>the</strong>r withcommunity volunteers. This highlights <strong>the</strong> different methodologies that were used, rang<strong>in</strong>g from formal<strong>in</strong>formation dissem<strong>in</strong>ation to participatory role play dramas.28SC Emergency Drought Response.p65282008/09/10, 11:56 AM
Box 2 EDR tra<strong>in</strong><strong>in</strong>g sessions, February 2008Dur<strong>in</strong>g this month 2/3 of households have received tra<strong>in</strong><strong>in</strong>g <strong>in</strong> <strong>the</strong> community on <strong>in</strong>vestments <strong>and</strong>sav<strong>in</strong>gs <strong>and</strong> <strong>the</strong> actual terms <strong>and</strong> conditions of <strong>the</strong>ir Puresave bank accounts, translat<strong>in</strong>g <strong>the</strong> <strong>in</strong>formationreceived from <strong>the</strong> bank below <strong>in</strong>to memorable <strong>and</strong> underst<strong>and</strong>able facts. Puresave requires <strong>the</strong> customer to ma<strong>in</strong>ta<strong>in</strong> a E50 m<strong>in</strong> balance <strong>in</strong> <strong>the</strong> account. There is 1 (one) free withdrawal per month (which can be made <strong>in</strong> <strong>the</strong> branch), any subsequentwithdrawal <strong>in</strong> <strong>the</strong> month will attract a penalty charge at a rate of E1.12 per E100 withdrawn with am<strong>in</strong>imum charge of E35 per withdrawal.The tra<strong>in</strong><strong>in</strong>g took place at <strong>the</strong> food distribution po<strong>in</strong>ts (FDP) prior to food distribution <strong>and</strong> lastedapproximately 3 hours, with refreshments. The tra<strong>in</strong><strong>in</strong>g <strong>in</strong>volved participatory sessions on SC, Childrights <strong>and</strong> protection <strong>and</strong> <strong>the</strong> cash programme <strong>and</strong> <strong>the</strong> actual terms of <strong>the</strong> bank account.This was followed by a structured 4-part role play <strong>in</strong> which various different ‘spenders’ were played,represent<strong>in</strong>g people who spend wisely <strong>and</strong> those who do not. The ‘wasteful spender’ who spent hermoney on fancy clo<strong>the</strong>s <strong>and</strong> nights danc<strong>in</strong>g with <strong>the</strong> boys, <strong>the</strong> old ‘gr<strong>and</strong>ma’ who can’t underst<strong>and</strong><strong>the</strong> programme <strong>and</strong> just wants her money <strong>and</strong> <strong>the</strong> ‘sensible couple’ who make decisions toge<strong>the</strong>r <strong>and</strong>for <strong>the</strong>ir children. Each part represented a different stage <strong>in</strong> <strong>the</strong> programme start<strong>in</strong>g from <strong>the</strong> Februarytransfer <strong>and</strong> f<strong>in</strong>ish<strong>in</strong>g <strong>in</strong> October 2008 when households will likely f<strong>in</strong>d <strong>the</strong>mselves <strong>in</strong> a similar situationas <strong>the</strong> start of <strong>the</strong> programme.Through drama many issues highlighted <strong>in</strong> <strong>the</strong> f<strong>in</strong>d<strong>in</strong>gs of <strong>the</strong> January focus group discussions wereaddressed, such as confusion around options of withdrawal mechanisms <strong>and</strong> leav<strong>in</strong>g money <strong>in</strong> <strong>the</strong>bank, <strong>and</strong> worries about <strong>the</strong> elderly receiv<strong>in</strong>g a ‘secret number’. The role plays are acted with <strong>the</strong><strong>in</strong>volvement of volunteers from <strong>the</strong> community <strong>and</strong> <strong>in</strong> recent tra<strong>in</strong><strong>in</strong>gs by youth groups.Mockup ATMs were used at <strong>the</strong> tra<strong>in</strong><strong>in</strong>gs to tra<strong>in</strong> people on us<strong>in</strong>g <strong>the</strong> mach<strong>in</strong>es to withdraw <strong>the</strong>irmoney. SC is advocat<strong>in</strong>g for <strong>in</strong>formation/ <strong>in</strong>structions to be given <strong>in</strong> Siswati on screen but at present<strong>the</strong> <strong>in</strong>structions come only <strong>in</strong> English, German <strong>and</strong> Ch<strong>in</strong>ese.Two residential tra<strong>in</strong><strong>in</strong>g courses for <strong>the</strong> children took place <strong>in</strong> February where 97 children collectedat 2 tra<strong>in</strong><strong>in</strong>g centres for a 2-day tra<strong>in</strong><strong>in</strong>g. <strong>Children</strong> attend<strong>in</strong>g <strong>the</strong> session ranged <strong>in</strong> age from 12 to 19years. The tra<strong>in</strong><strong>in</strong>g focused on f<strong>in</strong>ancial plann<strong>in</strong>g <strong>and</strong> budget<strong>in</strong>g, look<strong>in</strong>g at f<strong>in</strong>ancial term<strong>in</strong>ology <strong>and</strong>practices as well as prioritis<strong>in</strong>g. Child rights <strong>and</strong> protection were also discussed at length. Sessions onproblem solv<strong>in</strong>g at a household level <strong>and</strong> prioritis<strong>in</strong>g for family/ household needs were taken by <strong>the</strong>child protection team to look at specific issues that affect <strong>the</strong>se households. Budget<strong>in</strong>g session helpedchildren to identify <strong>the</strong> th<strong>in</strong>gs <strong>the</strong>y ‘need’ versus th<strong>in</strong>gs <strong>the</strong>y ‘want’ through agree<strong>in</strong>g lists as a groupof essentials <strong>and</strong> <strong>the</strong>n add<strong>in</strong>g <strong>the</strong> prices. Once given <strong>the</strong> sum <strong>the</strong> groups were tasked with prioritis<strong>in</strong>g<strong>and</strong> mak<strong>in</strong>g a plan for <strong>the</strong> rema<strong>in</strong><strong>in</strong>g items. Pre <strong>and</strong> posttra<strong>in</strong><strong>in</strong>g KAP tests were taken.Source: <strong>Save</strong> <strong>the</strong> <strong>Children</strong> Alliance (February 2008:4)29SC Emergency Drought Response.p65292008/09/10, 11:56 AM
Chapter 3Impact EvaluationThis chapter presents empirical evidence on impacts of <strong>the</strong> Emergency Drought Response (EDR) project,draw<strong>in</strong>g ma<strong>in</strong>ly on data from <strong>the</strong> f<strong>in</strong>al evaluation survey but also us<strong>in</strong>g data collected <strong>in</strong> <strong>the</strong> monthly monitor<strong>in</strong>gsurveys. The chapter beg<strong>in</strong>s by summaris<strong>in</strong>g <strong>the</strong> ways that cash <strong>and</strong> food transfers were used <strong>and</strong> <strong>the</strong>ircontribution to household <strong>in</strong>come <strong>and</strong> expenditure. This is followed by an analysis of impacts of transferson several aspects of household <strong>and</strong> <strong>in</strong>dividual well-be<strong>in</strong>g: food security, non-food goods <strong>and</strong> services(education, health, etc.), cop<strong>in</strong>g strategies, assets <strong>and</strong> livelihoods, <strong>and</strong> access to bank<strong>in</strong>g. Next we exam<strong>in</strong>eproject impacts on children, women <strong>and</strong> communities, <strong>and</strong> f<strong>in</strong>ally we consider impacts on markets.3.1 Use of cash <strong>and</strong> food transfersHouseholds that received cash <strong>and</strong> food transfers used this cash for a variety of purposes. Virtually allrecipients spent some or all of <strong>the</strong>ir cash on staple food (maize or maize-meal), o<strong>the</strong>r food items (vegetables,meat, o<strong>the</strong>r cereals) <strong>and</strong> groceries (soap, paraff<strong>in</strong>, etc.). More than half of <strong>the</strong>se households spent some cashtransfer <strong>in</strong>come on health (58%), <strong>and</strong> more than one-third reported spend<strong>in</strong>g on cloth<strong>in</strong>g (39%) <strong>and</strong> oneducation (38%). One <strong>in</strong> three households used some cash transfers to pay off debts (31), one <strong>in</strong> four<strong>in</strong>vested <strong>in</strong> <strong>the</strong>ir farms (24%) <strong>and</strong> one <strong>in</strong> ten <strong>in</strong>vested <strong>in</strong> <strong>the</strong>ir bus<strong>in</strong>ess (11%) (Figure 8). Needless to say,households that received only food rations could not meet such a diverse range of needs with <strong>the</strong>ir transfers,except by sell<strong>in</strong>g <strong>the</strong>ir food – which <strong>the</strong>y did not do: 96% of food recipients consumed all this food.Figure 8How cash plus food recipients used <strong>the</strong>ir cash transfers100%99%98%90%80%60%58%40%20%39% 38%31%24%300%GroceriesStaplefoodAnalysis of expenditure data dur<strong>in</strong>g <strong>the</strong> project period reveals that households that received cash plus foodtransfers had substantially higher spend<strong>in</strong>g levels (averag<strong>in</strong>g E402 per month) than households that receivedonly food transfers (averag<strong>in</strong>g E263 per month). Much of this E139 (53%) difference <strong>in</strong> spend<strong>in</strong>g is directlyattributable to <strong>the</strong> EDR cash transfers, which averaged E186 per household per month (E30/person x 6.2persons/household). Figure 9 reveals that most of <strong>the</strong> higher spend<strong>in</strong>g by cash recipients went on food,which is underst<strong>and</strong>able s<strong>in</strong>ce <strong>the</strong>se households received half food rations while ‘food only’ householdsreceived full rations.Interest<strong>in</strong>gly, <strong>the</strong> pre-project market feasibility study had predicted that: “Most recipients of cash transferswould spend a decent portion of funds received on food, with some expenditure on essential non-fooditems <strong>and</strong> o<strong>the</strong>r services” (de Matteis, 2007:4). In fact, a survey conducted for <strong>the</strong> feasibility study foundthat if <strong>the</strong>se 490 households were given cash <strong>the</strong>y would spend 52-56% on buy<strong>in</strong>g food if <strong>the</strong>y were notreceiv<strong>in</strong>g food aid, <strong>and</strong> 43% on buy<strong>in</strong>g additional food if <strong>the</strong>y were already receiv<strong>in</strong>g food aid (de Matteis,2007:19). This compares to 51% <strong>and</strong> 42% actually spent by households receiv<strong>in</strong>g ‘cash plus food’ <strong>and</strong> ‘foodonly’, respectively (Figure 9).11%O<strong>the</strong>r food Health Clo<strong>the</strong>s Education Debts Farm<strong>in</strong>g Bus<strong>in</strong>essSC Emergency Drought Response.p65302008/09/10, 11:56 AM
Figure 9 Average monthly household spend<strong>in</strong>g, November 2007 to April 200840030020022726152841581314142128O<strong>the</strong>rMedicalTransportCloth<strong>in</strong>gGroceries1000206(51%)<strong>Cash</strong> + <strong>Food</strong>55111(42%)<strong>Food</strong> OnlyEducationLivelihood<strong>Food</strong>Figure 10 compares spend<strong>in</strong>g on different expenditure categories by cash <strong>and</strong> food recipients. This confirms<strong>the</strong> large disparity <strong>in</strong> spend<strong>in</strong>g on food, with ‘cash plus food’ recipients spend<strong>in</strong>g almost double (85% more)than ‘food only’ recipients. Figure 10 also reveals that spend<strong>in</strong>g by cash transfer recipients was higher thanspend<strong>in</strong>g by ‘food only’ recipients <strong>in</strong> all o<strong>the</strong>r categories as well. Sometimes <strong>the</strong> disparity was high – 80% fortransport, 45% for education – but <strong>in</strong> some categories <strong>the</strong> marg<strong>in</strong> was narrow – 7% for cloth<strong>in</strong>g, 4% onlivelihoods. This demonstrates that cash transfers give both higher purchas<strong>in</strong>g power <strong>and</strong> greater flexibilitythan pure food transfers.Figure 10Spend<strong>in</strong>g differentials between ‘cash plus food’ <strong>and</strong> ‘food only’ recipients1200100085%8006004002004%45%31%7%80%30%0<strong>Food</strong> Livelihood Education Groceries Cloth<strong>in</strong>g Transport Medical31SC Emergency Drought Response.p65312008/09/10, 11:56 AM
3.2 Household food securityThe monitor<strong>in</strong>g <strong>and</strong> f<strong>in</strong>al evaluation surveys provide a lot of evidence on <strong>the</strong> food security impacts of <strong>the</strong>cash <strong>and</strong> food transfers that were distributed <strong>in</strong> Swazil<strong>and</strong> between November 2007 <strong>and</strong> April 2008. Threequantitative <strong>in</strong>dicators will be discussed here: (1) use of food transfers; (2) use of cash transfers; (3) trends<strong>in</strong> self-reported hunger. A fourth <strong>in</strong>dicator of <strong>the</strong> food security impacts of cash <strong>and</strong> food transfers is dietarydiversity, which is exam<strong>in</strong>ed later, under impacts on children.The primary purpose of <strong>the</strong> EDR project was to support <strong>the</strong> humanitarian relief programme, which aimedto protect food security <strong>in</strong> households fac<strong>in</strong>g food production deficits <strong>and</strong>/or loss of <strong>in</strong>come. One way ofsupport<strong>in</strong>g household food security is to provide free food, <strong>and</strong> all households <strong>in</strong> our survey receivedei<strong>the</strong>r a full ration or a half ration of food, compris<strong>in</strong>g 6 kilograms of maize, 0.9 kilograms of beans <strong>and</strong> 375ml of cook<strong>in</strong>g oil. The full food ration was considered sufficient to meet <strong>the</strong> daily subsistence needs (forcalories, prote<strong>in</strong> <strong>and</strong> fat) of each household member.The first quantitative evidence we have about food security impacts comes from data on how food transferswere used. Almost all respondents (96%) consumed all <strong>the</strong> food <strong>the</strong>y were given at home, <strong>the</strong>reby reduc<strong>in</strong>ghunger <strong>and</strong> ma<strong>in</strong>ta<strong>in</strong><strong>in</strong>g m<strong>in</strong>imum food <strong>in</strong>take levels for <strong>the</strong>mselves <strong>and</strong> <strong>the</strong>ir families. A small m<strong>in</strong>ority ofrespondents reported us<strong>in</strong>g some of <strong>the</strong>ir food allocations for o<strong>the</strong>r purposes; <strong>the</strong>se <strong>in</strong>cluded shar<strong>in</strong>g somefood aid with o<strong>the</strong>rs (4.0%), feed<strong>in</strong>g some food to <strong>the</strong>ir animals (1.3%), sell<strong>in</strong>g some or all of <strong>the</strong>ir foodrations for cash (0.7%), or barter<strong>in</strong>g it for o<strong>the</strong>r food items (0.4%) (see Annex Table 10). There were nosignificant differences <strong>in</strong> <strong>the</strong> use of food by respondents who received full rations <strong>and</strong> those who receivedhalf rations. Childheaded households were most <strong>in</strong>cl<strong>in</strong>ed to consume all <strong>the</strong>ir food aid (98.5%). This evidenceof almost complete use of food rations for household consumption suggests both that <strong>the</strong>se <strong>in</strong>terventionswere well targeted at families that were <strong>in</strong> fact food <strong>in</strong>secure, <strong>and</strong> that food transfers made a positivecontribution to reduc<strong>in</strong>g household food <strong>in</strong>security dur<strong>in</strong>g a difficult year.The second set of data on food security impacts of <strong>the</strong> Emergency Drought Relief project relates to <strong>the</strong>uses of cash transfers. EDR cash recipients received a half ration of food plus enough cash to buy <strong>the</strong> o<strong>the</strong>rhalf. But <strong>the</strong> cash transfers were unconditional <strong>and</strong> could be spent on anyth<strong>in</strong>g. None<strong>the</strong>less, all householdsreceiv<strong>in</strong>g cash transfers did use some or all of this cash to buy food – ei<strong>the</strong>r maize (98% of households) oro<strong>the</strong>r food items (90%). In terms of actual expenditure, across both ‘cash plus food’ <strong>and</strong> ‘food only’ recipients,almost half of total household spend<strong>in</strong>g was on food (46%). Households receiv<strong>in</strong>g full food rations spentE111 each month on buy<strong>in</strong>g additional food (42% of total expenditure). Households receiv<strong>in</strong>g both cash<strong>and</strong> food spent E206 per month on buy<strong>in</strong>g food (51% of total expenditure). ‘<strong>Cash</strong> plus food’ recipientsspent almost double what ‘food only’ recipients spent on food, presumably because <strong>the</strong>ir rations were less.<strong>Food</strong> commodities purchased by frequency were dom<strong>in</strong>ated by staple cereals (1. Maize; 2. Maize–meal; 3.Rice), followed by meat (4. Poultry) <strong>and</strong> pulses (5. Beans).The third <strong>and</strong> most powerful evidence we have on <strong>the</strong> food security impact of <strong>the</strong> ‘cash plus food’ <strong>and</strong> ‘foodonly’ transfers is recall data on self-reported hunger <strong>in</strong> respondents’ households. The f<strong>in</strong>al evaluationquestionnaire asked households to report whe<strong>the</strong>r <strong>the</strong>y had experienced hunger <strong>in</strong> each of <strong>the</strong> previous12 months. Figure 11 provides conv<strong>in</strong>c<strong>in</strong>g evidence for <strong>the</strong> positive effects of <strong>the</strong> humanitarian <strong>in</strong>tervention<strong>in</strong> 2007/08, <strong>and</strong> particularly for <strong>the</strong> beneficial impacts of <strong>the</strong> EDR cash transfers on household food security.Follow<strong>in</strong>g <strong>the</strong> failed harvest of April-May 2007, self-reported levels of hunger started ris<strong>in</strong>g rapidly amonghouseholds <strong>in</strong> our survey, peak<strong>in</strong>g at over 80% <strong>in</strong> August <strong>and</strong> September. These prevalence rates fell dramaticallyas soon as food <strong>and</strong> cash distributions started, but <strong>the</strong>y fell much more sharply for households that received<strong>the</strong> EDR ‘cash plus food’ package than for those receiv<strong>in</strong>g ‘full food rations’ only. Only 22% of ‘cash plusfood’ recipients reported hunger follow<strong>in</strong>g <strong>the</strong> first distribution of emergency assistance <strong>in</strong> November2007, down from 70% <strong>in</strong> October. The drop for ‘food only’ recipients was less pronounced: from 79% <strong>in</strong>October to 61% <strong>in</strong> November. These downward trends cont<strong>in</strong>ued <strong>in</strong>to early 2008, with ‘food only’ recipientsreport<strong>in</strong>g hunger down to 28% <strong>in</strong> February, when only 8% of ‘cash plus food’ recipients were still hungry.32SC Emergency Drought Response.p65322008/09/10, 11:56 AM
Figure 11 Hunger reported by households receiv<strong>in</strong>g cash <strong>and</strong>/or food transfers, 2007/08908070<strong>Cash</strong> + <strong>Food</strong><strong>Food</strong> Only6050403020100May 07 June 07 July 07 Aug 07 Sept 07 Oct 07 Nov 07 Dec 07 Jan 08 Feb 08 Mar 08 April 08The ‘cash plus food’ transfers clearly protected almost all recipient families aga<strong>in</strong>st <strong>the</strong> hunger <strong>and</strong> food<strong>in</strong>security <strong>the</strong>y were experienc<strong>in</strong>g before <strong>the</strong> EDR <strong>in</strong>tervention. However, households receiv<strong>in</strong>g full foodrations were only partially protected. As Table 6 reveals, onethird (34%) of ‘food only’ recipients cont<strong>in</strong>uedto face hunger after <strong>the</strong> <strong>in</strong>tervention started, compared to only one <strong>in</strong> seven (14%) ‘cash plus food’ recipients.S<strong>in</strong>ce ‘cash plus food’ recipients reported a higher <strong>in</strong>itial prevalence of hunger, <strong>the</strong> effectiveness of <strong>the</strong><strong>in</strong>tervention can be quantified <strong>and</strong> compared: hunger dropped to less than one-fifth of pre-<strong>in</strong>terventionlevels (from 74% to 14%), while hunger among ‘food only’ recipients only halved (from 68% to 34%).Table 6 Hunger reported by households before <strong>and</strong> after receiv<strong>in</strong>g assistance, 2007/08Period ‘<strong>Cash</strong> + food’ recipients ‘<strong>Food</strong> only’ recipientsPre<strong>in</strong>tervention(May – October 2007) 73.8% 68.2%Dur<strong>in</strong>g <strong>in</strong>tervention:(November 2007 – April 2008) 14.0% 34.3%Average prevalence of hunger(May 2007 – April 2008) 43.9% 51.3%One factor that might confound our <strong>in</strong>terpretation of <strong>the</strong>se f<strong>in</strong>d<strong>in</strong>gs is <strong>the</strong> breaks that occurred <strong>in</strong> <strong>the</strong> foodaid pipel<strong>in</strong>e dur<strong>in</strong>g early 2008, which meant that food transfers were less regular <strong>and</strong> less predictable thancash transfers. In January <strong>and</strong> February approximately 40% of food aid beneficiaries did not receive any oilor pulses, due to disrupted supplies that affected both <strong>the</strong> government (NDMA) <strong>and</strong> UN (WFP) foodpipel<strong>in</strong>es. ‘<strong>Cash</strong> plus food’ recipients were also affected, but not to <strong>the</strong> same extent. A more serious pipel<strong>in</strong>ebreak occurred <strong>in</strong> March <strong>and</strong> April, when no food aid was distributed at all. (In May, beneficiaries received adouble ration of food, but by <strong>the</strong>n <strong>the</strong> peak of <strong>the</strong> food crisis had passed.) The EDR monthly monitor<strong>in</strong>greports noted that spend<strong>in</strong>g on food was more “irregular” among ‘food only’ recipients as a result of <strong>the</strong>sedisruptions <strong>in</strong> food deliveries. Conversely, “<strong>the</strong> reliability of <strong>the</strong> cash transfer allows households to plan <strong>and</strong>budget for <strong>the</strong>ir needs.” (SC Swazil<strong>and</strong>, March 2008:3). Failures of food aid delivery could well expla<strong>in</strong> whyfood aid appears to have been less effective than cash transfers <strong>in</strong> protect<strong>in</strong>g household food securitydur<strong>in</strong>g <strong>the</strong> 2007/08 food crisis <strong>in</strong> Swazil<strong>and</strong>, <strong>and</strong> why levels of self-reported hunger actually started ris<strong>in</strong>gamong food aid households <strong>in</strong> March <strong>and</strong> April 2008.3.3 Non–food goods <strong>and</strong> servicesAll families allocate <strong>the</strong>ir spend<strong>in</strong>g on a number of nonfood goods <strong>and</strong> services, beyond meet<strong>in</strong>g <strong>the</strong>irsubsistence food requirements. Poor families, by def<strong>in</strong>ition, spend a larger proportion of <strong>the</strong>ir limited budgetson food. None<strong>the</strong>less, poor families also face an array of dem<strong>and</strong>s <strong>and</strong> needs, for which <strong>the</strong>y require cash.33SC Emergency Drought Response.p65332008/09/10, 11:56 AM
<strong>Cash</strong> transfers enable recipients to meet <strong>the</strong>se nonfood priorities. As noted above, ‘food only’ recipientscould not f<strong>in</strong>ance any of <strong>the</strong>se important non–food costs – unless <strong>the</strong>y sold some of <strong>the</strong>ir food rations, or<strong>the</strong>ir assets. On <strong>the</strong> o<strong>the</strong>r h<strong>and</strong>, receipt of full food rations does release household resources to spend ono<strong>the</strong>r non-food needs, <strong>and</strong> food recipients did spend significantly on a range of commodities <strong>and</strong> services,even if <strong>the</strong>ir levels of spend<strong>in</strong>g were lower than spend<strong>in</strong>g by ‘cash plus food’ recipients (Figure 10).As seen above, spend<strong>in</strong>g of EDR cash transfers was dom<strong>in</strong>ated by staple cereals <strong>and</strong> o<strong>the</strong>r food commodities,but almost half (49%) of cash recipient budgets was allocated to various non-food items – from livelihoodsto education <strong>and</strong> health, to groceries, cloth<strong>in</strong>g <strong>and</strong> transport (Figure 9).1. Groceries: Almost all cash transfer recipients bought groceries (99%) – soap, paraff<strong>in</strong>, etc. – spend<strong>in</strong>gon average E28 per month (7% of total spend<strong>in</strong>g).2. Health: More than half spent some cash on medical expenses (58%), but spent only E7 per month(2%). This discrepancy between <strong>the</strong> high proportion of households that spent money on health care<strong>and</strong> <strong>the</strong> small amount of money actually spent is expla<strong>in</strong>ed by <strong>the</strong> low cost of public health care <strong>in</strong>Swazil<strong>and</strong>, which is heavily subsidised by <strong>the</strong> government.3. Education: Two <strong>in</strong> five cash recipients spent some of this cash on education costs (38%), with anaverage monthly spend of E41 (7% of total spend<strong>in</strong>g). Education ranked third on <strong>the</strong> list of spend<strong>in</strong>gcategories, beh<strong>in</strong>d food <strong>and</strong> livelihoods but ahead of groceries, cloth<strong>in</strong>g, transport <strong>and</strong> health.4. Cloth<strong>in</strong>g: Two <strong>in</strong> five recipients also bought clo<strong>the</strong>s for <strong>the</strong>mselves <strong>and</strong> <strong>the</strong>ir families (39%), <strong>in</strong>clud<strong>in</strong>gschool uniforms, spend<strong>in</strong>g E15 per month (3%) dur<strong>in</strong>g <strong>the</strong> project period.5. Debts: One–third of cash recipients paid off some of <strong>the</strong>ir debts (31%) us<strong>in</strong>g this w<strong>in</strong>dfall <strong>in</strong>come. Thisis an important outcome because food crises are often associated with ris<strong>in</strong>g levels of <strong>in</strong>debtedness aspoor households are forced to take loans at exploitative rates of <strong>in</strong>terest – <strong>in</strong>stead, <strong>the</strong> EDR projectallowed cash recipients to reduce <strong>the</strong>ir <strong>in</strong>debtedness.6. Transport: <strong>Cash</strong> transfer recipients spent E26 per month (7%) on transport costs, much of thisbe<strong>in</strong>g to travel to cash disbursement po<strong>in</strong>ts – <strong>the</strong> nearest post office, bank branch or ATM po<strong>in</strong>t. Thesecosts were covered by a supplementary payment from <strong>the</strong> EDR project.<strong>Cash</strong> transfers were disbursed to help poor rural families survive a ‘covariate’ shock (drought), but <strong>the</strong>yalso assisted some households to meet ‘idiosyncratic’ shocks, such as a death <strong>in</strong> <strong>the</strong> family. The rural poor <strong>in</strong>Swazil<strong>and</strong> have very limited access to funeral plans or burial societies. One woman whose son died <strong>in</strong> early2008 had to buy a coff<strong>in</strong> for his burial, <strong>and</strong> allocated almost two months of cash transfers this unforeseenexpense. Families with members who had a chronic illness found <strong>the</strong> cash transfers <strong>in</strong>valuable for meet<strong>in</strong>grecurrent medical expenses. For example, one woman <strong>in</strong> a focus group discussion had a diabetic husb<strong>and</strong>,<strong>and</strong> used most of <strong>the</strong> monthly cash transfer to pay for medication such as <strong>in</strong>sul<strong>in</strong>.An <strong>in</strong>terest<strong>in</strong>g feature that emerges from <strong>the</strong> monthly monitor<strong>in</strong>g surveys is <strong>the</strong> concentration of certa<strong>in</strong>categories of spend<strong>in</strong>g <strong>in</strong> particular months. Agricultural seasonality means that spend<strong>in</strong>g on <strong>in</strong>puts (seeds,fertiliser, tractor hire, labour) is concentrated <strong>in</strong> <strong>the</strong> early months of <strong>the</strong> farm<strong>in</strong>g season, <strong>and</strong> this expla<strong>in</strong>swhy <strong>the</strong> highest proportion of household <strong>in</strong>vestments <strong>in</strong> ‘livelihoods’ occurred <strong>in</strong> November 2007, forboth ‘cash plus food’ <strong>and</strong> ‘food only’ recipients – account<strong>in</strong>g for 33% of total spend<strong>in</strong>g <strong>in</strong> ‘food only’ households<strong>in</strong> this month (Figure 13).34Similarly, school fees are due <strong>in</strong> January (E412 per primary school child per year), <strong>and</strong> even <strong>the</strong> poorestfamilies <strong>in</strong> Swazil<strong>and</strong> prioritise education as an <strong>in</strong>vestment <strong>in</strong> <strong>the</strong> future livelihoods of <strong>the</strong>ir children. Educationcosts (fees, uniforms, meals) were highest <strong>in</strong> January 2008 – averag<strong>in</strong>g 20% <strong>and</strong> 31% of total spend<strong>in</strong>g by‘cash plus food’ <strong>and</strong> ‘food only’ households, respectively. (Note that, although <strong>the</strong> proportions of spend<strong>in</strong>gon livelihoods <strong>and</strong> education were higher <strong>in</strong> ‘food only’ households, actual expenditures on <strong>the</strong>se <strong>and</strong> o<strong>the</strong>rspend<strong>in</strong>g categories were all higher <strong>in</strong> households that received cash transfers.) The <strong>in</strong>creased spend<strong>in</strong>g oneducation was largely f<strong>in</strong>anced by a reallocation with<strong>in</strong> household budgets away from o<strong>the</strong>r spend<strong>in</strong>g categories,especially food, which fell from 63% to 42% <strong>in</strong> ‘cash plus food’ households but fell much more steeply <strong>in</strong>‘food only’ households, from 66% to 24%, recover<strong>in</strong>g to 40% <strong>in</strong> February (Figure 12 <strong>and</strong> Figure 13).SC Emergency Drought Response.p65342008/09/10, 11:56 AM
Figure 12 Monthly spend<strong>in</strong>g, cash transfer recipients, 2007/08100%80%60%40%20%56%10%9%63%9%20%11%42%15%16%41%11%114%53%O<strong>the</strong>rMedicalNoth<strong>in</strong>gTransportGroceriesEducation20%Livelihoods0%Nov Dec Jan Feb Mar<strong>Food</strong>Figure 13 Monthly spend<strong>in</strong>g, ‘food only’ recipients, 2007/08100%O<strong>the</strong>r80%60%40%33%13%14%31%12%21%10%21%MedicalNoth<strong>in</strong>gTransportGroceriesEducation20%0%50% 66% 24% 40% 50%Nov Dec Jan Feb MarLivelihoods<strong>Food</strong>Monitor<strong>in</strong>g data also revealed a decl<strong>in</strong>e <strong>in</strong> asset ownership among ‘food only’ recipients between December<strong>and</strong> January (SC Swazil<strong>and</strong>, February 2008:3), quite possibly reflect<strong>in</strong>g a ‘forced decapitalisation’ by <strong>the</strong>sehouseholds to f<strong>in</strong>ance education costs through asset sales. The situation among ‘cash plus food’ recipientswas more complex, but <strong>the</strong>y appeared to be better able to protect or even <strong>in</strong>crease <strong>the</strong>ir asset hold<strong>in</strong>gs,despite fac<strong>in</strong>g high school fees <strong>in</strong> January.The monthly monitor<strong>in</strong>g report for February commented on <strong>the</strong> higher <strong>in</strong>stability of spend<strong>in</strong>g patternsamong ‘food only’ recipients, who lacked <strong>the</strong> flexibility to smooth <strong>the</strong>ir spend<strong>in</strong>g as needs dem<strong>and</strong>ed, unlikecash transfer recipients.“Whilst <strong>the</strong>re are some stable trends develop<strong>in</strong>g <strong>in</strong> <strong>the</strong> food <strong>and</strong> cash group <strong>the</strong>re does not appear tobe stability <strong>in</strong> <strong>the</strong> expenditure for <strong>the</strong> food only group. One priority is be<strong>in</strong>g sacrificed to meet ano<strong>the</strong>r.Last month saw a steep decl<strong>in</strong>e <strong>in</strong> expenditure on food <strong>in</strong> <strong>the</strong> food only group to cope with <strong>the</strong><strong>in</strong>crease <strong>in</strong> dem<strong>and</strong> for education related costs. Equally <strong>the</strong> two can be l<strong>in</strong>ked <strong>in</strong> this month’s monitor<strong>in</strong>gwhere food expenditure almost doubles as education needs decrease” (SC Swazil<strong>and</strong>, March 2008:3).35SC Emergency Drought Response.p65352008/09/10, 11:56 AM
3.4 Cop<strong>in</strong>g strategiesOne objective of <strong>the</strong> EDR project was to enable drought-affected to avoid adopt<strong>in</strong>g damag<strong>in</strong>g ‘cop<strong>in</strong>g strategies’.Empirical studies of seasonality, food crises <strong>and</strong> fam<strong>in</strong>es <strong>in</strong> Africa concluded that rural African householdsrespond to food stress <strong>in</strong> similar ways across different countries <strong>and</strong> contexts. These behavioural adjustmentsor ‘cop<strong>in</strong>g strategies’ tend to follow a predictable sequence, based on <strong>the</strong> fundamental strategic objective ofm<strong>in</strong>imis<strong>in</strong>g nutritional, economic <strong>and</strong> social costs of food deficits to <strong>the</strong> household. The immediate <strong>and</strong>almost universal response to food stress is to ration food consumption (to protect household assets).Households <strong>the</strong>n try to raise cash to f<strong>in</strong>ance food purchases (to protect m<strong>in</strong>imum food consumptionlevels), which <strong>the</strong>y do firstly by draw<strong>in</strong>g on <strong>the</strong>ir normal sources of <strong>in</strong>come – agricultural labour, microenterprises,sell<strong>in</strong>g off-take livestock – <strong>and</strong> <strong>the</strong>n by resort<strong>in</strong>g to less preferred sources of cash – such asborrow<strong>in</strong>g, migrat<strong>in</strong>g <strong>in</strong> search of work, <strong>and</strong> sell<strong>in</strong>g household assets. Household spend<strong>in</strong>g patterns alsochange, as priorities are adjusted – <strong>in</strong> particular, non-food spend<strong>in</strong>g tends to be reduced (to save money tobuy food).Not all <strong>the</strong>se responses have detrimental consequences, but some are very damag<strong>in</strong>g <strong>and</strong> can compromise<strong>the</strong> future viability of household livelihoods. For <strong>in</strong>stance, if reduced spend<strong>in</strong>g means cutt<strong>in</strong>g back on cigarettesthis has no obviously negative implications for household well-be<strong>in</strong>g, but if it means withdraw<strong>in</strong>g childrenfrom school <strong>the</strong>n <strong>the</strong> long-term consequences (not least <strong>in</strong> terms of reduced future earn<strong>in</strong>gs potential) are<strong>in</strong>calculable. Humanitarian <strong>in</strong>terventions generally aim to protect not only lives but also livelihoods, whichmeans ensur<strong>in</strong>g that damag<strong>in</strong>g cop<strong>in</strong>g strategies are avoided – for <strong>in</strong>stance, that food or cash transfers aretimely <strong>and</strong> sufficient so that households do not need to sell <strong>the</strong>ir productive assets for food.The evaluation survey asked about a range of cop<strong>in</strong>g strategies adopted dur<strong>in</strong>g <strong>the</strong> past twelve months(s<strong>in</strong>ce <strong>the</strong> 2007 harvest, before <strong>and</strong> dur<strong>in</strong>g <strong>the</strong> <strong>in</strong>tervention period), <strong>and</strong> found that rates of adoption werehigh, <strong>and</strong> followed <strong>the</strong> sequence predicted by <strong>the</strong> literature – ration<strong>in</strong>g first, sell<strong>in</strong>g assets <strong>and</strong> withdraw<strong>in</strong>gchildren from school last (Figure 14). What is strik<strong>in</strong>g about this figure is not just <strong>the</strong> sequenc<strong>in</strong>g but also<strong>the</strong> similarity <strong>in</strong> adoption rates between ‘cash plus food’ <strong>and</strong> ‘food only’ recipients. Two-thirds of households<strong>in</strong>terviewed (67-68%) rationed <strong>the</strong>ir food consumption (<strong>the</strong>y ate smaller portions, or fewer meals per day).Many households also pursued a number of strategies for rais<strong>in</strong>g cash to buy food, <strong>in</strong>clud<strong>in</strong>g: borrow<strong>in</strong>g(29%); migrat<strong>in</strong>g for work (19%); sell<strong>in</strong>g livestock (10%); <strong>and</strong> sell<strong>in</strong>g o<strong>the</strong>r assets (3%). F<strong>in</strong>ally, most householdscut <strong>the</strong>ir non-food spend<strong>in</strong>g, <strong>and</strong> a small m<strong>in</strong>ority did so by withdraw<strong>in</strong>g <strong>the</strong>ir children from school (4%).The high proportion of households that adopted one or more of <strong>the</strong>se cop<strong>in</strong>g strategies implies that <strong>the</strong>receipt of cash <strong>and</strong>/or food transfers did not fully protect <strong>the</strong>se households aga<strong>in</strong>st <strong>the</strong> consequences of<strong>the</strong> drought <strong>and</strong> forest fires that devastated harvests <strong>and</strong> reduced <strong>in</strong>comes <strong>in</strong> rural Swazil<strong>and</strong> <strong>in</strong> 2007. Onepossible explanation is that <strong>the</strong> relief <strong>in</strong>tervention came too late to prevent <strong>the</strong> adoption of cop<strong>in</strong>g strategiesthat were not needed subsequently – as seen above, levels of hunger were extremely high <strong>in</strong> <strong>the</strong> period Julyto October 2007 (Figure 11), so it is also possible that respondents were report<strong>in</strong>g on cop<strong>in</strong>g strategiesadopted before <strong>the</strong>y started receiv<strong>in</strong>g cash <strong>and</strong>/or food transfers.Figure 14 Cop<strong>in</strong>g strategies adopted by droughtaffected households, 2007/0880%68%67%RationedBorrowedMigratedSold livestockKids out of schoolSold assets60%40%29%29%22%20%16%10%4% 3%10%4% 2%0%36SC Emergency Drought Response.p65362008/09/10, 11:56 AM
S<strong>in</strong>ce none of <strong>the</strong> differences <strong>in</strong> cop<strong>in</strong>g strategy adoption rates between ‘cash plus food’ <strong>and</strong> ‘food only’households is statistically significant, it appears that <strong>the</strong> type of <strong>in</strong>tervention made no difference to this<strong>in</strong>dicator – cash transfers were nei<strong>the</strong>r better nor worse than food aid <strong>in</strong> terms of protect<strong>in</strong>g householdsaga<strong>in</strong>st <strong>the</strong> need to adopt damag<strong>in</strong>g cop<strong>in</strong>g strategies to survive this food crisis. This might be expla<strong>in</strong>ed byrecall<strong>in</strong>g that <strong>the</strong> ‘cash plus food’ package enabled recipients to access an equivalent amount of food as <strong>the</strong>full food ration given to ‘food only’ recipients, so <strong>the</strong> two transfer packages provided <strong>the</strong> same level ofprotection aga<strong>in</strong>st hunger. Also, both sets of households received food aid <strong>and</strong> were exposed to <strong>the</strong> samepipel<strong>in</strong>e break that saw no food deliveries at all <strong>in</strong> March <strong>and</strong> April (with no compensat<strong>in</strong>g <strong>in</strong>crease <strong>in</strong> cashpayments). F<strong>in</strong>ally, <strong>the</strong>se data only tell us about <strong>the</strong> rate of adoption of different strategies, not how <strong>in</strong>tensively<strong>the</strong>y were adopted. O<strong>the</strong>r <strong>in</strong>dicators (such as asset depletion, as mentioned above) suggest that ‘food only’recipients might have been forced to pursue damag<strong>in</strong>g responses to food <strong>in</strong>security to a more severedegree than did recipients of cash transfers.3.5 Livelihoods, assets <strong>and</strong> sav<strong>in</strong>gsMany project beneficiaries <strong>in</strong>vested some of <strong>the</strong> cash <strong>the</strong>y received <strong>in</strong> <strong>the</strong>ir family farms (24%) or <strong>the</strong>irbus<strong>in</strong>esses (11%). Spend<strong>in</strong>g on livelihoods was second only to food, amount<strong>in</strong>g to 16% of total householdspend<strong>in</strong>g. On average, all households surveyed <strong>in</strong>vested E57 each month on <strong>the</strong>ir livelihood activities (or atotal of E342 over <strong>the</strong> six months), out of a total monthly budget of E362. This figure was almost identicalbetween both categories of beneficiaries, but was higher as a proportion of total spend<strong>in</strong>g <strong>in</strong> ‘food only’(21%) than <strong>in</strong> ‘cash plus food’ households (14%). For farm<strong>in</strong>g households this spend<strong>in</strong>g contributedsubstantially towards <strong>the</strong> costs of fertiliser (E120-150 <strong>in</strong> 2007) <strong>and</strong> tractor hire (E120/hour) (FAO/WFP,2007:9-10).Many cash recipients <strong>in</strong>vested some of this money <strong>in</strong> micro-enterprises that multiplied this <strong>in</strong>come <strong>and</strong>generated additional <strong>in</strong>come (see Box 3).Box 3 Woman trader, SiphofaneniOne woman who was a ‘cash plus food’ beneficiary of <strong>the</strong> EDR project sells snack foods for a liv<strong>in</strong>g.Before <strong>the</strong> EDR project she estimates that she spent E30 on <strong>in</strong>gredients <strong>and</strong> sold snacks for E60 onan average work<strong>in</strong>g day, mak<strong>in</strong>g a profit of E30. When <strong>the</strong> EDR project started she started sell<strong>in</strong>g rawpeanuts <strong>and</strong> cooked jugo beans to people queu<strong>in</strong>g for <strong>the</strong>ir cash outside Siphofaneni Post Office. Onan average pay-day she spent E60 on peanuts <strong>and</strong> jugo beans <strong>and</strong> sold <strong>the</strong>se for E120, mak<strong>in</strong>g a profitof E60 – double her normal profit.As noted above, one objective of any humanitarian response to food crisis is to protect <strong>the</strong> assets ofaffected families aga<strong>in</strong>st ‘decapitalisation’ (sell<strong>in</strong>g or exchang<strong>in</strong>g assets for food). A more ambitious secondaryobjective of cash transfers (though not of food aid) is to facilitate asset accumulation that will streng<strong>the</strong>n <strong>the</strong>household’s asset base <strong>and</strong> support post-crisis recovery. Data from <strong>the</strong> f<strong>in</strong>al evaluation survey confirmsthat both <strong>the</strong>se objectives were achieved by <strong>the</strong> EDR cash transfers. Not only were cash recipient householdsbetter able to conserve <strong>the</strong>ir assets dur<strong>in</strong>g <strong>the</strong> project <strong>in</strong>tervention period, <strong>the</strong>se cash transfers alsocontributed significantly to asset accumulation by many beneficiary households.In terms of <strong>the</strong> proportion of households that owned different assets, <strong>the</strong>re are no significant differencesbetween households that received ‘cash plus food’ <strong>and</strong> those that received ‘food only’ transfers. For <strong>in</strong>stance,23% of ‘cash plus food’ <strong>and</strong> 22% of ‘food only’ households owned cattle, 82% <strong>and</strong> 81% (respectively) ownedchickens, 17% <strong>and</strong> 18% owned a plough, <strong>and</strong> 57% of both groups owned radios (see Annex Table 12). Thissuggests that <strong>the</strong> two groups of beneficiary households were at similar wealth levels.In terms of numbers of assets owned, however, ‘food only’ recipients had slightly higher asset hold<strong>in</strong>gswhen <strong>the</strong> <strong>in</strong>tervention started <strong>in</strong> late 2007. But a simple count of assets reveals that food recipients suffereda 7.2% decl<strong>in</strong>e <strong>in</strong> <strong>the</strong>ir asset hold<strong>in</strong>gs dur<strong>in</strong>g <strong>the</strong> <strong>in</strong>tervention period, whereas cash recipients managed toprotect <strong>the</strong>ir assets, los<strong>in</strong>g only (a statistically non-significant) 0.7% of <strong>the</strong>ir assets dur<strong>in</strong>g this period (Figure15). (Of course, this ‘asset count<strong>in</strong>g’ method does not convey <strong>the</strong> real value of <strong>the</strong>se assets – fur<strong>the</strong>ranalysis <strong>in</strong>corporat<strong>in</strong>g asset prices is needed to quantify <strong>the</strong>se changes.) We can <strong>the</strong>refore conclude that<strong>the</strong> cash transfers distributed by <strong>the</strong> EDR project served <strong>the</strong> purpose of asset protection <strong>in</strong> beneficiaryhouseholds, <strong>and</strong> did this more effectively than food transfers did.37SC Emergency Drought Response.p65372008/09/10, 11:56 AM
Figure 15 Changes <strong>in</strong> asset ownership, December 2007 to May 200817.617.216.816.4<strong>Cash</strong> +<strong>Food</strong><strong>Food</strong>Only16.016.895 16.77617.546 16.28115.6Dec 07 May 08 Dec 07 May 08Not only did cash transfers allow assets to be protected aga<strong>in</strong>st ‘distress sales’ for food, EDR cash was alsoused to accumulate assets. Of 1,225 households surveyed that received cash transfers, 107 (8.7%) boughtchickens with this cash, 62 (5.1%) bought hoes, 35 (2.9%) bought goats, 26 (2.1%) bought radios, 25 (2.0%)bought pigs <strong>and</strong> smaller numbers bought axes, beds, wardrobes, even cattle <strong>and</strong>, <strong>in</strong> one case, a plough (Table7). Although <strong>the</strong> percentages of households that acquired assets are quite small, extrapolat<strong>in</strong>g from oursample to all households that received cash transfers suggests that substantial numbers of householdsaccumulated useful assets through <strong>the</strong> EDR project. Estimated total households that acquired livestock areas follows: chickens (655 households), goats (214), pigs (153), cattle (18). Estimated households that acquiredfarm implements are: hoes (378), axes (98), ploughs (6). Estimated households that acquired householdgoods are: radio (159), bed (37), wardrobe (12).38SC Emergency Drought Response.p65382008/09/10, 11:56 AM
Table 7Reasons for changes <strong>in</strong> asset ownershipAsset Sold/exchanged for food Sold for o<strong>the</strong>r reasonsLivestock<strong>Cash</strong> + <strong>Food</strong> only <strong>Cash</strong> + <strong>Food</strong> only<strong>Food</strong><strong>Food</strong>Cattle 10 (8.2%) 2 (0.4%) 17 (1.4%) 2 (0.4%) 3 (0.2%)Donkey 1 (0.1%) 0 (0.0%) 0 (0.0%) 0 (0.0%) 0 (0.0%)Pig 5 (0.4%) 8 (1.6%) 3 (0.2%) 0 (0.0%) 25 (2.0%)Goat 16 (1.3%) 6 (1.2%) 21 (1.7%) 9 (1.8%) 35 (2.9%)Chicken 48 (3.9%) 35 (7.1%) 20 (1.6%) 4 (0.8%) 107 (8.7%)Farm implementsTractor 0 (0.0%) 0 (0.0%) 0 (0.0%) 0 (0.0%) 0 (0.0%)Plough 0 (0.0%) 0 (0.0%) 0 (0.0%) 0 (0.0%) 1 (0.1%)Ox-cart 0 (0.0%) 0 (0.0%) 0 (0.0%) 0 (0.0%) 0 (0.0%)Hoe 0 (0.0%) 0 (0.0%) 0 (0.0%) 0 (0.0%) 62 (5.1%)Axe 0 (0.0%) 0 (0.0%) 0 (0.0%) 0 (0.0%) 16 (1.3%)Household goodsCar 1 (0.1%) 0 (0.0%) 2 (0.2%) 0 (0.0%) 0 (0.0%)Bicycle 0 (0.0%) 0 (0.0%) 0 (0.0%) 0 (0.0%) 0 (0.0%)Radio 0 (0.0%) 0 (0.0%) 0 (0.0%) 0 (0.0%) 26 (2.1%)Wardrobe 0 (0.0%) 0 (0.0%) 0 (0.0%) 0 (0.0%) 2 (0.4%)Bed 0 (0.0%) 0 (0.0%) 0 (0.0%) 0 (0.0%) 6 (0.5%)Total households 1,225 491 1,225 491 1,225Apart from physical assets (livestock, farm tools, furniture), ano<strong>the</strong>rasset is f<strong>in</strong>ancial – sav<strong>in</strong>gs. Traditionally, sav<strong>in</strong>gs <strong>in</strong> rural Swazil<strong>and</strong> areheld <strong>in</strong> <strong>the</strong> form of livestock – “animals breed, but cash does not!”Many people are members of sav<strong>in</strong>gs clubs, because <strong>the</strong>y provideaccess to a form of <strong>in</strong>formal <strong>in</strong>surance (lump-sums can be withdrawnwhen a member faces an unforeseen shock or major expense). Inour survey, 14% of ‘cash plus food’ recipients were members ofsav<strong>in</strong>gs clubs before <strong>the</strong> EDR project started, <strong>and</strong> a fur<strong>the</strong>r 13.8%jo<strong>in</strong>ed a sav<strong>in</strong>gs club after <strong>the</strong> project started. So <strong>the</strong> cash transfercaused membership of sav<strong>in</strong>gs clubs to double. Some 16.5% of cashrecipients deposited an average of E117 of this cash <strong>in</strong>to <strong>the</strong>ir sav<strong>in</strong>gsclub.Unlike cash held at home, cash saved <strong>in</strong> banks does ‘breed’ – it earns <strong>in</strong>terest – <strong>and</strong> one reason for open<strong>in</strong>gbank accounts for project participants was to give <strong>the</strong>m access to f<strong>in</strong>ancial services, <strong>in</strong>clud<strong>in</strong>g deposit facilities.People who are runn<strong>in</strong>g small bus<strong>in</strong>esses can derive great value from sav<strong>in</strong>g some of <strong>the</strong>ir profits, or leav<strong>in</strong>gmoney as work<strong>in</strong>g capital <strong>in</strong> <strong>the</strong> bank. One-third of cash transfer recipients (32.4%) left some of this money<strong>in</strong> <strong>the</strong>ir bank accounts for sav<strong>in</strong>gs purposes. On average, E205 was saved by <strong>the</strong> end of <strong>the</strong> EDR project.One woman who raises chickens <strong>and</strong> pigs for <strong>in</strong>come said: “I deposit E50 at Score Supermarket every timeI receive <strong>the</strong> cash. I do this so that I could buy food amount<strong>in</strong>g to <strong>the</strong> sav<strong>in</strong>gs at <strong>the</strong> end of <strong>the</strong> year”.3.6 Impacts on childrenBoughtus<strong>in</strong>g cashtransfersThe Emergency Drought Response project reached large numbers of children. On average, beneficiaryhouseholds <strong>in</strong>cluded 1.1 children under five years old <strong>and</strong> 2.5 children aged 6-15, equally divided betweenboys <strong>and</strong> girls. Extrapolat<strong>in</strong>g from our survey to <strong>the</strong> 7,650 households reached by <strong>the</strong> EDR, this means thatmore than 8,300 under-fives <strong>and</strong> 19,000 6-15 yearolds, or 27,000 children under 15 years old <strong>in</strong> total,were directly supported by this <strong>in</strong>tervention (Table 8).39SC Emergency Drought Response.p65392008/09/10, 11:57 AM
Table 8<strong>Children</strong> <strong>and</strong> orphans who benefited from <strong>the</strong> EDR <strong>in</strong>tervention<strong>Children</strong> surveyed M F Total per hh Total EDR<strong>Children</strong> 0-5 951 986 1,937 1.1 8,306<strong>Children</strong> 6-15 2,275 2,177 4,452 2.5 19,091Total 3,226 3,163 6,389 3.6 27,397<strong>Children</strong> per household 1.8 1.8 3.6S<strong>in</strong>gle–parent orphans 983 904 1,887 1.1 8,092Double–parent orphans 318 308 626 0.4 2,684Total 1,301 1,212 2,513 1.4 10,776Orphans per household 0.7 0.7 1.4The EDR <strong>in</strong>tervention had a particular concern with support<strong>in</strong>g vulnerable children. Our survey f<strong>in</strong>ds that<strong>the</strong>re were 1.4 s<strong>in</strong>gle or double-parent orphans liv<strong>in</strong>g <strong>in</strong> each beneficiary household, or a total of 10,776orphans <strong>in</strong> <strong>the</strong> 7,650 EDR households – close to 8,100 s<strong>in</strong>gle-parent <strong>and</strong> 2,700 double-parent (Table 8).In focus group discussions, children commented on <strong>the</strong> EDR project, identify<strong>in</strong>g several economic <strong>and</strong>social impacts <strong>in</strong> addition to those discussed above. Economic benefits of <strong>the</strong> cash <strong>in</strong>cluded: “We alwayshave enough food now”; “People are no longer starv<strong>in</strong>g”; “I have new clo<strong>the</strong>s <strong>and</strong> shoes”, “My parents havepaid my school fees”; “The money pays my bus fare to school”. A few children reported misuse of cashtransfers: “My bro<strong>the</strong>r said he will go to South Africa to buy a cell phone”; “Men don’t return home on paydays;some have found o<strong>the</strong>r women to spend <strong>the</strong> money with”. A positive social impact was mentioned byone teenager: “The crime rate has decreased, <strong>the</strong> youth <strong>in</strong> <strong>the</strong> community are now behav<strong>in</strong>g well.” Someadults reported that young girls were no longer engag<strong>in</strong>g <strong>in</strong> transactional sex for cash or food, s<strong>in</strong>ce <strong>the</strong>project provided <strong>the</strong>m with enough cash to meet <strong>the</strong>ir basic needs. One negative social impact was noted<strong>in</strong> child-headed households where cash transfers were controlled by carers on <strong>the</strong> child’s behalf: “<strong>Children</strong>disrespect <strong>the</strong>ir gr<strong>and</strong>mo<strong>the</strong>rs, <strong>and</strong> claim that <strong>the</strong> money belongs to <strong>the</strong>m.” Overall, most communitiesreported that <strong>the</strong> impacts of <strong>the</strong> project on children were entirely positive, <strong>and</strong> <strong>the</strong>re were no un<strong>in</strong>tendednegative effects.Child-headed households were also s<strong>in</strong>gled out as a priority beneficiary group, <strong>and</strong> several impacts of <strong>the</strong>project on children <strong>and</strong> specifically on child-headed households were monitored separately. Below weexam<strong>in</strong>e two quantitative <strong>in</strong>dicators of <strong>the</strong> project’s impact on children: spend<strong>in</strong>g of cash transfers, <strong>and</strong>food <strong>in</strong>take (‘dietary diversity’).3.6.1 <strong>Cash</strong> spend<strong>in</strong>g by <strong>and</strong> on childrenChild–headed households <strong>in</strong> Swazil<strong>and</strong> are poorer <strong>and</strong> more vulnerable than adul<strong>the</strong>aded households.Expenditure data from our f<strong>in</strong>al evaluation survey found that <strong>the</strong> average monthly spend<strong>in</strong>g of child-headedhouseholds was E257. This was 21% less than female–headed households (E311), <strong>and</strong> 39% less than spend<strong>in</strong>gby male–headed households (E356).Child–headed households spent <strong>the</strong>ir cash transfers very responsibly, prioritis<strong>in</strong>g basic needs (food, groceries,cloth<strong>in</strong>g), followed by health <strong>and</strong> education (Figure 16). Some also used cash transfers to pay off debts, <strong>and</strong>a smaller number shared <strong>the</strong>ir w<strong>in</strong>dfall <strong>in</strong>come with o<strong>the</strong>rs. This pattern of spend<strong>in</strong>g priorities mirrors <strong>the</strong>allocation of cash transfers by adult-headed households very closely (Figure 8), except that child-headedhouseholds did not report <strong>in</strong>vest<strong>in</strong>g <strong>in</strong> farm<strong>in</strong>g or bus<strong>in</strong>ess, presumably because most are too young tofarm or run a bus<strong>in</strong>ess. It should also be noted that much of <strong>the</strong> spend<strong>in</strong>g of cash transfers by adult-headedhouseholds was directed to children – not only for food <strong>and</strong> o<strong>the</strong>r basic needs (one parent stated: “We areable to feed our children without <strong>the</strong>m go<strong>in</strong>g to steal”), but also to support children’s education (schoolfees, uniforms), which absorbed a heavy proportion of total spend<strong>in</strong>g <strong>in</strong> January.40SC Emergency Drought Response.p65402008/09/10, 11:57 AM
Figure 16 Spend<strong>in</strong>g of cash transfers by childheaded households100%80%60%40%20%0%GroceriesStaplefoodO<strong>the</strong>rfoodClo<strong>the</strong>s Health Education Debts Helpedo<strong>the</strong>rsLivestockLower spend<strong>in</strong>g implies not only higher levels of poverty but also higher levels of vulnerability. Evidence forthis comes from data on cop<strong>in</strong>g strategies adopted by child-headed households. 90% of child–headedhouseholds rationed food dur<strong>in</strong>g 2008, compared to 68% of adult–headed households. This suggests that<strong>the</strong> food <strong>in</strong>security of child-headed households was higher, <strong>and</strong> that <strong>the</strong>y need targeted attention <strong>in</strong> termsof social protection even <strong>in</strong> noncrisis years.3.6.2 Child nutritionMonitor<strong>in</strong>g data provides strik<strong>in</strong>g evidence of <strong>the</strong> beneficial impacts of EDR cash transfers on children’snutrition <strong>and</strong> food security status. One <strong>in</strong>dicator that was monitored monthly was ‘dietary diversity’ <strong>in</strong>beneficiary households, def<strong>in</strong>ed as <strong>the</strong> number of food groups consumed by household members. (‘<strong>Food</strong>groups’ <strong>in</strong>cluded cereals, milk, meat, vegetables, fruit, legumes, <strong>and</strong> oil or fat). Summaris<strong>in</strong>g <strong>the</strong> results revealsa strong upward trend <strong>in</strong> dietary diversity among children dur<strong>in</strong>g <strong>the</strong> project period, for both groups ofbeneficiaries. However, a higher proportion of children achieved an adequate dietary diversity 5 <strong>in</strong> ‘cash plusfood’ households than <strong>in</strong> ‘food only’ households. At <strong>the</strong> time of <strong>the</strong> basel<strong>in</strong>e survey <strong>in</strong> October 2007, onlyone-third of children (33%) were recorded an appropriately diverse diet. This figure rema<strong>in</strong>ed constant <strong>in</strong>November for children of ‘food only’ beneficiaries, but doubled to two-thirds (66%) <strong>in</strong> households thatreceived cash. By March this proportion was well above 80%, <strong>and</strong> had also risen <strong>in</strong> ‘food only’ households,to slightly below 60% (Figure 17).So ‘cash plus food’ households not only enjoyed an immediate <strong>and</strong> susta<strong>in</strong>ed improvement <strong>in</strong> <strong>the</strong>ir diets, asmeasured by dietary diversity – which has been proven to be a robust proxy for food security (Hodd<strong>in</strong>ott<strong>and</strong> Yisehac Yohannes, 2002) – <strong>the</strong>y also consumed consistently more diverse diets than ‘food only’ householdsthroughout <strong>the</strong> project period. As <strong>Save</strong> <strong>the</strong> <strong>Children</strong> noted <strong>in</strong> successive monthly monitor<strong>in</strong>g reports, <strong>the</strong>logical explanation is that cash transfers provided access to an unlimited range of foods through marketpurchase, while food aid recipients were limited to <strong>the</strong> maize, beans <strong>and</strong> oil <strong>the</strong>y were given.“Though an <strong>in</strong>crease <strong>in</strong> diversity of diet is observed for <strong>the</strong> food only, it is not as significant as that seen for<strong>the</strong> food <strong>and</strong> cash <strong>in</strong>tervention. This may be due to <strong>the</strong> fact that households with cash are able to buy amore diverse diet than those without, thus <strong>the</strong> <strong>in</strong>crease” (SC Swazil<strong>and</strong>, February 2008: 5).5 Age specific scores were used to ascerta<strong>in</strong> whe<strong>the</strong>r dietary diversity was adequate or not: for children 69 months old, <strong>the</strong> diet was adequate if <strong>the</strong> child had consumed at least 2 different foodgroups; for children 912 months <strong>the</strong> diet was adequate if <strong>the</strong> child had consumed at least 3 different food groups; <strong>and</strong> for children 1236 months, <strong>the</strong> diet was adequate if <strong>the</strong> child had consumed atleast 4 different food groups.41SC Emergency Drought Response.p65412008/09/10, 11:57 AM
Figure 17 <strong>Children</strong> with adequate dietary diversity (% of households)423.7 Impacts on women<strong>Save</strong> <strong>the</strong> <strong>Children</strong> Swazil<strong>and</strong> took a decision to ensure that women were <strong>the</strong> direct recipients of cash <strong>and</strong>food transfers wherever possible. The reason<strong>in</strong>g for this is that women are generally considered to bepoorer <strong>and</strong> more vulnerable than men, <strong>and</strong> because women are <strong>the</strong> primary carers for children, who werean important target group for support from this project. Disburs<strong>in</strong>g cash <strong>in</strong> particular to women was<strong>in</strong>tended to ensure that <strong>the</strong> benefits would accrue to children, <strong>and</strong> was also <strong>in</strong>tended to empower women.The majority (90%) of <strong>the</strong> registered beneficiaries <strong>and</strong> account-holders were women. Not surpris<strong>in</strong>gly,female-headed households comprised a significant proportion of <strong>the</strong> beneficiaries (43% of <strong>the</strong> ‘cash plusfood’ group), because <strong>the</strong>y generally fall <strong>in</strong>to <strong>the</strong> poorest wealth groups with<strong>in</strong> rural communities.Although <strong>the</strong> cash transfers were <strong>in</strong>tended to benefit <strong>the</strong> entire household, women who collected <strong>the</strong> cashusually took primary responsibility for decid<strong>in</strong>g on how to spend <strong>the</strong> cash <strong>and</strong> how to use <strong>the</strong> food with<strong>in</strong><strong>the</strong> family, even <strong>in</strong> male–headed households. Women <strong>in</strong> one focus group told us that when <strong>the</strong>y received<strong>the</strong> cash <strong>the</strong>y spent most of it immediately on food <strong>and</strong> groceries, leav<strong>in</strong>g very little for <strong>the</strong>ir husb<strong>and</strong>s.Interest<strong>in</strong>gly, although <strong>the</strong>re were concerns before <strong>the</strong> project that nom<strong>in</strong>at<strong>in</strong>g women as cash recipients<strong>and</strong> account-holders could cause <strong>in</strong>tra-household conflict between men <strong>and</strong> women, men tended to agreewith giv<strong>in</strong>g <strong>the</strong> cash to women. “We just give all <strong>the</strong> money to our wives because <strong>the</strong>y know what to buy.”One man <strong>in</strong> ano<strong>the</strong>r focus group discussion dissented from <strong>the</strong> dom<strong>in</strong>ant view. “I am <strong>the</strong> one who decideswhat to buy, I never give <strong>the</strong> money to <strong>the</strong> woman. Even before <strong>the</strong> programme I was <strong>the</strong> one who knewwhat <strong>and</strong> what not to buy as a provider <strong>in</strong> <strong>the</strong> household.” In o<strong>the</strong>r households husb<strong>and</strong>s <strong>and</strong> wivesdecided jo<strong>in</strong>tly on how <strong>the</strong> cash transfers should be spent, but this was apparently a m<strong>in</strong>ority of cases.A surpris<strong>in</strong>g f<strong>in</strong>d<strong>in</strong>g was that when a conflict over <strong>the</strong> use of cash did occur, it was more usually betweenadults <strong>and</strong> children than between husb<strong>and</strong>s <strong>and</strong> wives. Especially <strong>in</strong> female-headed households, childrensometimes confronted <strong>the</strong>ir parents or carers <strong>and</strong> dem<strong>and</strong>ed <strong>the</strong>ir ‘share’ of <strong>the</strong> cash transfer. This mighthave been an un<strong>in</strong>tended consequence of <strong>the</strong> way <strong>the</strong> calculation of <strong>the</strong> cash payment level was expla<strong>in</strong>edto recipients: <strong>in</strong>dividuals represent<strong>in</strong>g family members stood up <strong>and</strong> each was allocated E30. Of course thisdid not mean that each household member should be given E30, but that this amount covered <strong>the</strong> costs ofeach person’s half-ration of food. Older carers such as gr<strong>and</strong>mo<strong>the</strong>rs were particularly susceptible to pressuresto divide up <strong>the</strong> cash, from <strong>the</strong>ir gr<strong>and</strong>children or orphans <strong>in</strong> <strong>the</strong>ir care.SC Emergency Drought Response.p65422008/09/10, 11:57 AM
did however respond to <strong>the</strong> <strong>in</strong>creased purchas<strong>in</strong>g power that cash transfers conveyed. Shops <strong>in</strong>creased<strong>the</strong>ir stocks of food <strong>and</strong> grocery commodities, <strong>in</strong>clud<strong>in</strong>g mealie–meal, bread, sugar, cook<strong>in</strong>g oil, c<strong>and</strong>les <strong>and</strong>soap. Some focus groups of cash recipients claimed that shop owners raised <strong>the</strong> prices of basic commoditieson cash collection days, tak<strong>in</strong>g advantage of <strong>the</strong> ‘w<strong>in</strong>dfall <strong>in</strong>come’ that caused recipients to be less priceconscious than usual. Similarly, some communities mentioned that <strong>the</strong> cost of mill<strong>in</strong>g maize <strong>in</strong>creased, partlydue to ris<strong>in</strong>g electricity costs but partly because of perceptions by millers that people were given cash topay for mill<strong>in</strong>g <strong>the</strong>ir food rations.We <strong>the</strong>refore conclude that <strong>the</strong> EDR project probably had no aggregate impact on prices of basic foodcommodities <strong>in</strong> Swazil<strong>and</strong>, especially for maize <strong>and</strong> mealie-meal, because <strong>the</strong> <strong>in</strong>cremental purchas<strong>in</strong>g powergenerated by <strong>the</strong> cash transfers was t<strong>in</strong>y <strong>in</strong> relation to total dem<strong>and</strong>. (At <strong>the</strong> national level, import volumesare driven primarily by dem<strong>and</strong> from large permanent markets such as Swazil<strong>and</strong>’s urban centres.) At <strong>the</strong>local level, however, traders, shop-keepers <strong>and</strong> millers did display opportunistic behaviour, such as rais<strong>in</strong>gprices on cash transfer paydays, but this effect was nei<strong>the</strong>r significant nor susta<strong>in</strong>ed.On <strong>the</strong> positive side, supplies of food <strong>and</strong> o<strong>the</strong>r basic commodities <strong>in</strong> local shops <strong>and</strong> markets def<strong>in</strong>itelyresponded positively to signals of <strong>in</strong>creased dem<strong>and</strong>, as reflected <strong>in</strong> ris<strong>in</strong>g stocks follow<strong>in</strong>g <strong>the</strong> disbursementof cash transfers. Local traders reported positive changes <strong>in</strong> <strong>the</strong>ir bus<strong>in</strong>ess dur<strong>in</strong>g <strong>the</strong> cash transfer period– <strong>in</strong>creased dem<strong>and</strong> <strong>and</strong> higher sales, lead<strong>in</strong>g to higher turnover <strong>and</strong> profits. Traders <strong>in</strong> local markets preparedfor pay-days by gett<strong>in</strong>g extra supplies <strong>in</strong> advance to sell to beneficiaries. There was a noticeable <strong>in</strong>crease <strong>in</strong>trade activities that were directly attributable to <strong>the</strong> cash disbursement. Traders came to Post Offices <strong>and</strong>ATMs on pay-days from near <strong>and</strong> far, <strong>and</strong> established temporary markets to take advantage of <strong>the</strong> surge <strong>in</strong>purchas<strong>in</strong>g power created by <strong>the</strong> cash transfers. In Siphofaneni, a Traders Committee responded by activelydiscourag<strong>in</strong>g traders from outside <strong>the</strong> area, to protect local bus<strong>in</strong>ess <strong>and</strong>, accord<strong>in</strong>g to one local trader, to“protect our poor people aga<strong>in</strong>st exploitation by traders from o<strong>the</strong>r areas who take <strong>the</strong>ir money <strong>and</strong> <strong>the</strong>ndisappear”.People who collected <strong>the</strong>ir cash immediately purchased maize <strong>and</strong> o<strong>the</strong>r food items, clo<strong>the</strong>s, cook<strong>in</strong>g utensils,farm tools <strong>and</strong> a range of consumer goods. Some project participants also took advantage of <strong>the</strong> ‘economicboom’ by sell<strong>in</strong>g cooked or raw food, sweets <strong>and</strong> iced water to o<strong>the</strong>r people queu<strong>in</strong>g outside <strong>the</strong> PostOffice (as seen <strong>in</strong> Box 3 above). Although <strong>the</strong> magnitude of this ‘multiplier effect’ cannot be quantified from<strong>the</strong> available data, it is clear that <strong>the</strong> cash transfers contributed to a stimulation of <strong>the</strong> local economy thatgenerated significant <strong>in</strong>come ga<strong>in</strong>s, not only for cash recipients but also for people who sold goods <strong>and</strong>services to <strong>the</strong>m.This effect was most obvious from observation of economic activity around pay-po<strong>in</strong>ts on cash pay-days,but it extended far beyond <strong>the</strong> pay-po<strong>in</strong>ts <strong>and</strong> persisted longer than <strong>the</strong> pay-day itself. Qualitative data fromcase studies <strong>and</strong> focus group discussions with cash recipients revealed a wide range of livelihood activitiesthat were part-f<strong>in</strong>anced with cash transfers. Apart from farm<strong>in</strong>g for <strong>in</strong>come (grow<strong>in</strong>g cotton or vegetablesfor sale), <strong>the</strong>se <strong>in</strong>cluded a number of non-agricultural small bus<strong>in</strong>esses, such as h<strong>and</strong>icrafts, bak<strong>in</strong>g bread orbrew<strong>in</strong>g beer, retail<strong>in</strong>g vegetables, cook<strong>in</strong>g snack foods, <strong>and</strong> rais<strong>in</strong>g chickens or pigs for sale. Interest<strong>in</strong>gly,some cash recipients jo<strong>in</strong>ed forces with o<strong>the</strong>rs to <strong>in</strong>vest <strong>in</strong> jo<strong>in</strong>t activities. One group formed to buywater<strong>in</strong>g pipes, pool<strong>in</strong>g <strong>the</strong>ir cash to <strong>in</strong>stall an irrigation system for <strong>the</strong>ir gardens. Ano<strong>the</strong>r group of farmersused <strong>the</strong>ir cash transfers to service a generator which was used for irrigat<strong>in</strong>g <strong>the</strong>ir vegetables.<strong>Cash</strong> transfers provided vital work<strong>in</strong>g capital for all <strong>the</strong>se micro-enterprises, <strong>and</strong> it is likely that <strong>the</strong> <strong>in</strong>comeof several households will shift to a higher level, possibly even contribut<strong>in</strong>g to susta<strong>in</strong>able poverty reduction.However, <strong>the</strong> evaluation survey was conducted too close to <strong>the</strong> end of <strong>the</strong> EDR project to assess <strong>the</strong>magnitude <strong>and</strong> susta<strong>in</strong>ability of <strong>the</strong>se wider economic impacts.44SC Emergency Drought Response.p65442008/09/10, 11:57 AM
Chapter 4Conclusions, Lessons Learned <strong>and</strong>Recommendations4.1 Conclusions<strong>Save</strong> <strong>the</strong> <strong>Children</strong> Swazil<strong>and</strong> pr<strong>in</strong>ted a Tshirt for EDR project staff to wear, bear<strong>in</strong>g <strong>the</strong> slogan: “<strong>Cash</strong> forChoice Dignity Empowerment”. Did <strong>the</strong> project achieve <strong>the</strong>se ambitions? One way of assess<strong>in</strong>g this isto judge whe<strong>the</strong>r <strong>the</strong> n<strong>in</strong>e hypo<strong>the</strong>ses that were tested by <strong>the</strong> cash transfers should be accepted (successfullyachieved) or rejected (not achieved, or <strong>in</strong>sufficient <strong>in</strong>formation). But first we should also assess whe<strong>the</strong>r <strong>the</strong>primary objective – <strong>the</strong> humanitarian response – was successfully enhanced by <strong>the</strong> EDR cash <strong>and</strong> foodtransfers.Humanitarian <strong>in</strong>tervention:✔ <strong>Cash</strong> transfers contribute effectively to national emergency response.There is no doubt that cash recipients suffered less hunger <strong>and</strong> food <strong>in</strong>security dur<strong>in</strong>g <strong>the</strong> food crisisthan <strong>the</strong>y would have done without this assistance. There is also compell<strong>in</strong>g evidence that cash recipientswere better protected than food recipients dur<strong>in</strong>g this period, because cash met a larger range of food<strong>and</strong> nonfood needs <strong>and</strong> because cash transfers were not subject to <strong>the</strong> pipel<strong>in</strong>e breaks that disruptedfood deliveries.<strong>Cash</strong> pilot<strong>in</strong>g – hypo<strong>the</strong>sis test<strong>in</strong>g:✔✔✔<strong>Cash</strong> improves nutrition, measured by more diverse diets<strong>Cash</strong> allows purchase of essential non-food items<strong>Cash</strong> is <strong>in</strong>vested <strong>in</strong> assets <strong>and</strong> livelihood activities that <strong>in</strong>crease <strong>in</strong>comes? Local markets are streng<strong>the</strong>ned by cash <strong>in</strong>jections, <strong>and</strong> <strong>in</strong>flation does not rise as a result✘Harmful cop<strong>in</strong>g strategies are avoided? Car<strong>in</strong>g practices for children improve✔✔✔Women are empowered by receiv<strong>in</strong>g cash<strong>Cash</strong> delivery systems are appropriate, timely, safe, well targeted <strong>and</strong> could be scaled upBeneficiaries are more sympa<strong>the</strong>tic to cash transfers than before <strong>the</strong> <strong>in</strong>tervention.Seven of <strong>the</strong> ten hypo<strong>the</strong>ses are assessed favourably, for two hypo<strong>the</strong>ses <strong>the</strong> evidence is <strong>in</strong>conclusive, <strong>and</strong>one hypo<strong>the</strong>sis is rejected. The evidence on market impacts (<strong>in</strong>flation <strong>and</strong> multiplier effects) is mixed, thoughgenerally positive, <strong>and</strong> post-project monitor<strong>in</strong>g is needed to assess susta<strong>in</strong>ability of multiplier effects. Theevidence on child-care practices is too limited to draw def<strong>in</strong>itive conclusions about whe<strong>the</strong>r cash transfersmade a difference. The data on cop<strong>in</strong>g-strategies found that twothirds of cash recipients <strong>and</strong> two-thirds offood recipients rationed <strong>the</strong>ir food consumption dur<strong>in</strong>g <strong>the</strong> six months before <strong>and</strong>/or six months dur<strong>in</strong>g<strong>the</strong> EDR <strong>in</strong>tervention, suggest<strong>in</strong>g ei<strong>the</strong>r that <strong>the</strong> assistance was delivered too late or that food aid pipel<strong>in</strong>edisruptions affected ‘cash plus food’ as well as ‘food only’ recipients.Overall, <strong>the</strong> flexibility of cash transfers, diligent attention by <strong>Save</strong> <strong>the</strong> <strong>Children</strong> to ‘customer care’ aspects,<strong>and</strong> <strong>the</strong> decision to target women <strong>and</strong> child-headed households comb<strong>in</strong>ed to ensure that <strong>the</strong> EDR cashtransfers did <strong>in</strong>deed deliver “choice, dignity <strong>and</strong> empowerment”.45SC Emergency Drought Response.p65452008/09/10, 11:57 AM
4.2 Lessons learned1. <strong>Cash</strong> transfers were an appropriate <strong>and</strong> effective response to <strong>the</strong> food crisis <strong>in</strong> Swazil<strong>and</strong>, becausefood markets are well function<strong>in</strong>g <strong>and</strong> rural household food security derives largely from a comb<strong>in</strong>ationof food production <strong>and</strong> market purchase.2. The effectiveness of cash disbursement was streng<strong>the</strong>ned by heavy <strong>in</strong>vestment of project resourcesat <strong>the</strong> design <strong>and</strong> implementation stages <strong>in</strong> community mobilisation, target<strong>in</strong>g <strong>and</strong> verification, tra<strong>in</strong><strong>in</strong>gof cash recipients <strong>in</strong> various relevant issues, <strong>and</strong> an array of monitor<strong>in</strong>g <strong>and</strong> evaluation activities.3. The accuracy <strong>and</strong> level of detail required for deliver<strong>in</strong>g cash transfers (<strong>in</strong>clud<strong>in</strong>g secur<strong>in</strong>g ID documents<strong>and</strong> open<strong>in</strong>g bank accounts) was more rigorous than for register<strong>in</strong>g people for food aid. More time <strong>and</strong>tra<strong>in</strong><strong>in</strong>g were needed to complete <strong>the</strong> documentation correctly, but it also ensured a more comprehensive<strong>and</strong> accurate database, which <strong>in</strong> turn ensured improved target<strong>in</strong>g <strong>and</strong> more precise calibration ofentitlements.4. The switch from manual distribution of food aid to technological distribution of cash transfers wasreadily accepted by beneficiaries, who adopted <strong>the</strong> technology (with <strong>Save</strong> <strong>the</strong> <strong>Children</strong>’s assistance)with little difficulty. But multiple technologies were <strong>in</strong>volved – automated teller mach<strong>in</strong>es (ATMs),po<strong>in</strong>t-of-sale (POS) devices, ATM cards <strong>and</strong> a computerised database – which created some technicalproblems that delayed <strong>the</strong> migration from Post Office to bank.5. <strong>Food</strong> transfers were more cost-effective overall than cash transfers, but ma<strong>in</strong>ly because of differences<strong>in</strong> wholesale costs of import<strong>in</strong>g food versus retail costs of buy<strong>in</strong>g food locally; <strong>in</strong> terms of delivery <strong>and</strong>management expenses, deliver<strong>in</strong>g cash was significantly cheaper.6. <strong>Cash</strong> transfers provided more flexibility than food transfers <strong>in</strong> household budget<strong>in</strong>g, allow<strong>in</strong>g recipientsto smooth food consumption <strong>and</strong> to meet a range of non–food spend<strong>in</strong>g priorities, especially educationexpenses <strong>and</strong> <strong>in</strong>vestment <strong>in</strong> farm<strong>in</strong>g <strong>and</strong> nonfarm livelihood activities.7. Comb<strong>in</strong><strong>in</strong>g cash with food transfers provided added advantage <strong>and</strong> benefits to beneficiaries (e.g. when<strong>the</strong> food aid pipel<strong>in</strong>e was disrupted, cash recipients were better cushioned), <strong>and</strong> <strong>the</strong> comb<strong>in</strong>ation of‘half cash, half food’ was preferred by over 90% of survey respondents.8. <strong>Children</strong> benefited from <strong>the</strong> programme, both by hav<strong>in</strong>g cash transfers spent by <strong>the</strong>ir parents onaddress<strong>in</strong>g children’s needs (food, education, health, cloth<strong>in</strong>g, etc) <strong>and</strong> by child-headed householdsreceiv<strong>in</strong>g cash directly, which <strong>the</strong>y generally managed very responsibly).4.3 Recommendations for future cash programm<strong>in</strong>g1. Start<strong>in</strong>g up cash transfer activities takes time to do properly, but s<strong>in</strong>ce time is limited dur<strong>in</strong>g emergencies,cash transfer procedures must be ma<strong>in</strong>streamed <strong>in</strong>to disaster preparedness, <strong>in</strong> Swazil<strong>and</strong> <strong>and</strong> elsewhere.2. A manual for deliver<strong>in</strong>g cash transfers should be produced, draw<strong>in</strong>g on <strong>the</strong> procedures developed <strong>and</strong>lessons learned from <strong>the</strong> Emergency Drought Response project, for use <strong>in</strong> future social protectionprogramm<strong>in</strong>g, <strong>in</strong> Swazil<strong>and</strong> <strong>and</strong> o<strong>the</strong>r countries.3. S<strong>in</strong>ce <strong>the</strong> requirement for formal ID documents is a barrier to access<strong>in</strong>g f<strong>in</strong>ancial services for poorpeople with no documentation, a national registration drive should be implemented, or locally adaptedbeneficiary identification systems should be considered <strong>in</strong> future <strong>in</strong>terventions.4. To improve <strong>the</strong> accessibility of cash to physically vulnerable people, mobile bank<strong>in</strong>g services should beconsidered, to deliver cash closer to recipients’ homes (as is done with food aid).5. F<strong>in</strong>ancial literacy is crucial for migrat<strong>in</strong>g from manual (‘pull’) to technological (‘push’) cash disbursementsystems, so adequate time <strong>and</strong> support for f<strong>in</strong>ancial literacy (underst<strong>and</strong><strong>in</strong>g bank accounts, us<strong>in</strong>g ATMs,manag<strong>in</strong>g cash) must be built <strong>in</strong>to future cash programm<strong>in</strong>g.46SC Emergency Drought Response.p65462008/09/10, 11:57 AM
6. If ma<strong>in</strong>ta<strong>in</strong><strong>in</strong>g constant household access to food is <strong>the</strong> primary objective of an emergency cash transfer<strong>in</strong>tervention, prices must be monitored closely <strong>and</strong> cash payment levels should be adjusted everydisbursement, to track food price fluctuations.7. Bus<strong>in</strong>ess enterprises that were f<strong>in</strong>anced with EDR cash transfers should be monitored for severalmonths after <strong>the</strong> project ends, to determ<strong>in</strong>e <strong>the</strong>ir commercial profitability <strong>and</strong> <strong>the</strong> susta<strong>in</strong>ability of <strong>the</strong>beneficial livelihood impacts of <strong>the</strong> <strong>in</strong>tervention.8. The use of bank accounts <strong>and</strong> ATM facilities should be monitored after <strong>the</strong> project ends, to establishwhe<strong>the</strong>r participants derived susta<strong>in</strong>able access to f<strong>in</strong>ancial services.9. Close attention should always be paid to <strong>the</strong> social impacts of cash transfers – both positive (reducedcrime <strong>and</strong> transactional sex) <strong>and</strong> negative (resentment between beneficiaries <strong>and</strong> non-beneficiaries, ‘misuse’of cash, <strong>in</strong>tra-family conflicts between genders <strong>and</strong> generations).10. All available evidence confirms that child–headed households are especially vulnerable, so <strong>the</strong>y needspecifically targeted social protection measures, even <strong>in</strong> non-emergency contexts.47SC Emergency Drought Response.p65472008/09/10, 11:57 AM
ReferencesBeswick, Claire (June 2008) Distribut<strong>in</strong>g cash through bank accounts: <strong>Save</strong> <strong>the</strong> <strong>Children</strong>’s droughtresponse <strong>in</strong> Swazil<strong>and</strong>. Marshalltown, South Africa: F<strong>in</strong>Mark Trustde Matteis, Aless<strong>and</strong>ro (August 2007) Feasibility Study for <strong>Cash</strong> <strong>Transfers</strong> <strong>in</strong> Swazil<strong>and</strong>: An Analysisof Market Function<strong>in</strong>g. Mbabane: <strong>Save</strong> <strong>the</strong> <strong>Children</strong> Swazil<strong>and</strong>Demographic <strong>and</strong> Health Surveys (DHS) (2007) ‘New National Survey F<strong>in</strong>ds 19 Percent of <strong>the</strong> SwaziPopulation Aged Two <strong>and</strong> Older Has HIV’, Press Release.http://www.measuredhs.com/ aboutdhs/pressroom/Release_archives/070628.cfm. Accessed 22/06/2008Devereux, S. (2008). Innovations <strong>in</strong> <strong>the</strong> Design <strong>and</strong> Delivery of Social <strong>Transfers</strong>: Lessons Learnedfrom Malawi. London: Concern WorldwideFAO/WFP (May 2007) Special Report: FAO/WFP Crop And <strong>Food</strong> Supply Assessment Mission toSwazil<strong>and</strong>. Rome: <strong>Food</strong> <strong>and</strong> Agriculture Organization, World <strong>Food</strong> ProgrammeHodd<strong>in</strong>ott, J. <strong>and</strong> Yisehac Yohannes (2002) ‘Dietary Diversity as a <strong>Food</strong> Security Indicator’, FCND DiscussionPaper No.136. Wash<strong>in</strong>gton DC: International <strong>Food</strong> Policy Research Institute (IFPRI)<strong>Save</strong> <strong>the</strong> <strong>Children</strong> Swazil<strong>and</strong> <strong>and</strong> World <strong>Food</strong> Programme (November 2007) Emergency DroughtResponse (<strong>Cash</strong> & <strong>Food</strong> <strong>Transfers</strong>): Basel<strong>in</strong>e, Monitor<strong>in</strong>g <strong>and</strong> Evaluation Plan.Mbabane: <strong>Save</strong> <strong>the</strong> <strong>Children</strong> Swazil<strong>and</strong><strong>Save</strong> <strong>the</strong> <strong>Children</strong> Alliance (February 2008) Emergency Drought Response Swazil<strong>and</strong>: SituationReport #10, February 2008. Mbabane: <strong>Save</strong> <strong>the</strong> <strong>Children</strong> Swazil<strong>and</strong><strong>Save</strong> <strong>the</strong> <strong>Children</strong> Swazil<strong>and</strong> (December 2007) Emergency Drought Response: 1st MonthlyMonitor<strong>in</strong>g Report. Mbabane: <strong>Save</strong> <strong>the</strong> <strong>Children</strong> Swazil<strong>and</strong><strong>Save</strong> <strong>the</strong> <strong>Children</strong> Swazil<strong>and</strong> (January 2008) Emergency Drought Response Project (<strong>Cash</strong> <strong>Transfers</strong>):Basel<strong>in</strong>e Report. Mbabane: <strong>Save</strong> <strong>the</strong> <strong>Children</strong> Swazil<strong>and</strong><strong>Save</strong> <strong>the</strong> <strong>Children</strong> Swazil<strong>and</strong> (February 2008) Emergency Drought Response: 3rd Monthly Monitor<strong>in</strong>gReport. Mbabane: <strong>Save</strong> <strong>the</strong> <strong>Children</strong> Swazil<strong>and</strong><strong>Save</strong> <strong>the</strong> <strong>Children</strong> Swazil<strong>and</strong> (March 2008) Emergency Drought Response: 4th Monthly Monitor<strong>in</strong>gReport. Mbabane: <strong>Save</strong> <strong>the</strong> <strong>Children</strong> Swazil<strong>and</strong><strong>Save</strong> <strong>the</strong> <strong>Children</strong> Swazil<strong>and</strong> (April 2008) Emergency Drought Response: 5th Monthly Monitor<strong>in</strong>gReport. Mbabane: <strong>Save</strong> <strong>the</strong> <strong>Children</strong> Swazil<strong>and</strong>Swazil<strong>and</strong> Vulnerability Assessment Committee (VAC) (2006) Swazil<strong>and</strong> Vulnerability AssessmentReport. Mbabane: Swazi VACSwazil<strong>and</strong> Vulnerability Assessment Committee (VAC) (April 2007) Swazil<strong>and</strong> Livelihood VulnerabilityAnalysis: A Rapid Assessment Report. Mbabane: Swazi VACUnited Nations Development Programme (UNDP) (2005) Human Development Report 2005. NewYork: UNDPUnited Nations Development Programme (UNDP) (2008) Human Development Report 2007/2008:Country Fact Sheets – Swazil<strong>and</strong>. http://hdrstats.undp.org/countries/ country_fact_sheets/cty_fs_SWZ.html. Accessed 22/06/2008.48SC Emergency Drought Response.p65482008/09/10, 11:57 AM
Annex TablesTable 9Detailed breakdown of food <strong>and</strong> cash distribution costs (E/ household/month)Costs <strong>Food</strong> <strong>Cash</strong> ExplanationDirect CostsBank charges 20.00 Bank charge per transfer0.04 0.04 Monthly charges / beneficiariesDelivery charges 8.64 E95 per tonne = enough food for 11families (6.5 people per household)<strong>Food</strong> CostsMaize 182.00 Prices quoted from NDMA 28 * 6.5Pulses 104.00 Prices quoted from NDMA 16 * 6.5Oil 58.50 Prices quoted from NDMA 9 * 6.5<strong>Cash</strong> Payment 468.37 Based on latest prices *6.5Support CostsVehicle costsCar Hire 5.00 2 x vehicles hired purely for fooddistributionFuel & R&M 7.50 0.88 <strong>Food</strong> based on actual project costs<strong>Cash</strong> based on assumption of 1,400Km per month (7 days * 200Km) +1,250Km M&EHR CostsField StaffField Coord<strong>in</strong>ator 2.25 Based on Jabulani <strong>and</strong> Bongani salariesField Officers 7.00 2.33 Under cash – assumption that 4 FieldOfficers could perform workDrivers 1.49 0.50 Assumed that only 2 drivers requiredunder cash only programmeSupport StaffF<strong>in</strong>ance staff 0.00 0.38 Based on 25% of time spent on cashdistribution workLogistics staff 1.91 Based on monthly salary / 6,000Warehouse officers 0.28 Musa’s salary / 6,000Loaders 2.17 10 loaders at Sipho + 4 at Nhlangano@ E 50 per daySecurity Guards 1.09 6 guards at 1,091 pmAdm<strong>in</strong>istration CostsPr<strong>in</strong>t<strong>in</strong>g costsRation cards 0.14 0.82 each divided by life of <strong>the</strong> projectWaybills etc 0.90 42 books for <strong>the</strong> programme costE 5,380Communications 0.92 0.23 Assume 75% drop <strong>in</strong> comms bill dueto less staffOne-off costsRegistration costs 0.61 Based on extra 15 m<strong>in</strong>s perhousehold over <strong>the</strong> project life to givea monthly cost. Ben # * 0.25 Hrs /8 Hrs per day / 30 days pm * salarypm / Ben # / 6 months.Tra<strong>in</strong><strong>in</strong>g costs 4.58 GBP 11K * 15 / 6,000 / 649SC Emergency Drought Response.p65492008/09/10, 11:57 AM
Table 10 Use of food transfersUse of <strong>Food</strong> <strong>Cash</strong> + <strong>Food</strong> <strong>Food</strong> Only TotalCount % Count % Count %Ate all <strong>the</strong> food 1,176 96.0% 478 97.4% 1,721 96.5%Gave some food away, ate <strong>the</strong> rest 48 3.9% 23 4.7% 71 4.0%Gave some food to livestock as feed 17 1.4% 6 1.2% 24 1.3%Bartered some food for o<strong>the</strong>r food 11 0.9% 1 0.2% 12 0.7%Bartered some food for o<strong>the</strong>r th<strong>in</strong>gs 4 0.3% 2 0.4% 6 0.3%Gave some food as payment, ate rest 5 0.4% 0 0.0% 5 0.3%Sold all food for cash 3 0.2% 1 0.2% 4 0.2%Sold some food to buy o<strong>the</strong>r food 3 0.2% 1 0.2% 4 0.2%Sold some food <strong>and</strong> ate <strong>the</strong> rest 3 0.2% 1 0.2% 4 0.2%Bartered all <strong>the</strong> food for o<strong>the</strong>r food 3 0.2% 1 0.2% 4 0.2%Bartered all <strong>the</strong> food for o<strong>the</strong>r th<strong>in</strong>gs 2 0.2% 1 0.2% 3 0.2%Gave all <strong>the</strong> food away to o<strong>the</strong>rs 2 0.2% 1 0.2% 3 0.2%Gave all food to o<strong>the</strong>rs as payment 2 0.2% 0 0.0% 2 0.1%O<strong>the</strong>r 3 0.2% 0 0.0% 3 0.2%Total 1,225 100% 491 100% 1,784 100%Table 11Cop<strong>in</strong>g strategiesLiveli- Intervention Ate less Reduced Sold Sold Family Borrowed Tookhood group food number of livestock o<strong>the</strong>r members food or childrenzone meals per to buy assets migrated cash to out ofday food to buy for work buy food schoolfoodLowveld <strong>Cash</strong> & food 61.9% 58.1% 14.0% 3.0% 19.0% 35.0% 4.3%Maize & <strong>Food</strong> only 55.1% 46.2% 15.3% 2.0% 25.6% 32.9% 4.0%Cattle CHH 88.5% 76.9% 7.7% 0.0% 26.9% 46.2% 0.0%Total 60.7% 55.2% 14.2% 2.6% 21.0% 34.7% 4.1%Timber <strong>Cash</strong> & food 77.2% 75.3% 3.1% 2.5% 10.6% 18.5% 3.3%Highl<strong>and</strong>s <strong>Food</strong> only 86.8% 72.6% 1.6% 2.1% 17.4% 22.6% 3.2%CHH 90.5% 81.0% 0.0% 0.0% 7.1% 28.6% 2.4%Total 80.5% 74.9% 2.5% 2.2% 12.2% 20.2% 3.2%50SC Emergency Drought Response.p65502008/09/10, 11:57 AM
Table 12Asset ownership (households own<strong>in</strong>g, by transfers received)Assets <strong>Cash</strong> + <strong>Food</strong> <strong>Food</strong> only Total [-CHH]Cattle 287 (23.4%) 108 (22.0%) 395 (23.0%)Donkey 17 (1.4%) 7 (1.4%) 24 (1.4%)Pig 129 (10.5%) 31 (6.3%) 160 (9.3%)Chickens 1,007 (82.2%) 397 (80.9%) 1,404 (81.8%)Goats 397 (32.4%) 144 (29.3%) 541 (31.5%)Car 19 (1.6%) 6 (1.2%) 25 (1.5%)Bicycle 40 (3.3%) 13 (2.6%) 53 (3.1%)Radio 696 (56.8%) 280 (57.0%) 976 (56.9%)Wardrobe 598 (48.8%) 248 (50.5%) 846 (49.3%)Bed 1,002 (81.8%) 425 (86.6%) 1,427 (83.2%)Plough 206 (16.8%) 90 (18.3%) 296 (17.2%)Hoe 1,089 (88.9%) 445 (90.6%) 1,534 (89.4%)Axe 788 (64.3%) 340 (69.2%) 1,128 (66.7%)Ox-cart 60 (4.9%) 16 (3.3%) 76 (4.4%)Tractor 20 (1.6%) 0 (0.0%) 20 (1.2%)Total 1,225 (100%) 491 (100%) 1,716 (100%)Table 13Asset ownership (households own<strong>in</strong>g, by household headship)Assets MHH FHH CHH TotalCattle 254 (25.7%) 141 (19.4%) 11 (16.2%) 406 (22.8%)Donkey 20 (2.0%) 4 (0.1%) 0 (0.0%) 24 (1.3%)Pig 95 (9.6%) 65 (8.9%) 2 (2.9%) 162 (9.1%)Chickens 841 (85.1%) 563 (77.3%) 34 (50.0%) 1,438 (80.6%)Goats 377 (38.2%) 164 (22.5%) 10 (14.7%) 551 (30.9%)Car 16 (1.6%) 9 (1.2%) 0 (0.0%) 25 (1.4%)Bicycle 38 (3.8%) 15 (2.1%) 1 (1.5%) 54 (3.0%)Radio 602 (60.9%) 374 (51.4%) 33 (48.5%) 1,009 (56.6%)Wardrobe 502 (50.8%) 344 (47.3%) 32 (47.1%) 878 (49.2%)Bed 841 (85.1%) 586 (80.5%) 58 (85.3%) 1,485 (83.2%)Plough 188 (19.0%) 108 (14.8%) 5 (7.4%) 301 (16.9%)Hoe 895 (90.6%) 639 (87.8%) 46 (67.6%) 1,580 (88.6%)Axe 677 (68.5%) 451 (62.0%) 31 (45.6%) 1,159 (65.0%)Ox-cart 55 (5.6%) 21 (2.9%) 1 (1.5%) 77 (4.3%)Tractor 13 (1.3%) 7 (1.0%) 0 (0.0%) 20 (1.1%)Total 988 (100%) 728 (100%) 68 (100%) 1,784 (100%)51SC Emergency Drought Response.p65512008/09/10, 11:57 AM
Table 14Changes <strong>in</strong> asset ownership: LivestockAsset Number owned Number owned Changetoday6 months agoCattle<strong>Cash</strong> + <strong>Food</strong> 1,604 1,601 +3<strong>Food</strong> only 695 698 -3MHH 1,519 1,500 +19FHH 780 799 -19CHH 73 71 +2Donkey<strong>Cash</strong> + <strong>Food</strong> 115 108 +7<strong>Food</strong> only 31 31 0MHH 135 126 +9FHH 11 13 -2CHH 0 0 0Pig<strong>Cash</strong> + <strong>Food</strong> 306 241 +65<strong>Food</strong> only 59 64 -5MHH 212 174 +38FHH 153 131 +22CHH 3 3 0Chickens<strong>Cash</strong> + <strong>Food</strong> 8,788 9,227 -439<strong>Food</strong> only 3,265 3,894 -629MHH 7,599 8,047 -448FHH 4,454 5,074 -620CHH 294 243 -51Goats<strong>Cash</strong> + <strong>Food</strong> 2,451 2,409 +42<strong>Food</strong> only 905 894 +11MHH 2,420 2,415 +5FHH 936 888 +48CHH 60 63 -352SC Emergency Drought Response.p65522008/09/10, 11:57 AM
Table 15Changes <strong>in</strong> asset ownership: Household goodsAsset Number owned Number owned Changetoday6 months agoCar<strong>Cash</strong> + <strong>Food</strong> 22 24 -2<strong>Food</strong> only 6 7 -1MHH 19 21 -2FHH 9 10 -1CHH 0 0 0Bicycle<strong>Cash</strong> + <strong>Food</strong> 39 39 0<strong>Food</strong> only 13 13 0MHH 37 39 -2FHH 15 13 +2CHH 1 1 0Radio<strong>Cash</strong> + <strong>Food</strong> 722 700 +22<strong>Food</strong> only 290 291 -1MHH 623 618 +5FHH 389 373 +16CHH 34 33 +1Wardrobe<strong>Cash</strong> + <strong>Food</strong> 663 664 -1<strong>Food</strong> only 289 290 -1MHH 554 555 -1FHH 398 399 -1CHH 40 40 0Bed<strong>Cash</strong> + <strong>Food</strong> 1,496 1,477 +19<strong>Food</strong> only 655 655 0MHH 1,200 1,194 +6FHH 951 938 +13CHH 113 111 +253SC Emergency Drought Response.p65532008/09/10, 11:57 AM
Table 16Changes <strong>in</strong> asset ownership: Farm implementsAsset Number owned Number owned Changetoday6 months agoPlough<strong>Cash</strong> + <strong>Food</strong> 234 235 -1<strong>Food</strong> only 95 95 0MHH 206 210 -4FHH 123 120 +3CHH 4 5 -1Hoe<strong>Cash</strong> + <strong>Food</strong> 3,073 2,942 +131<strong>Food</strong> only 1,296 1,289 +7MHH 2,638 2,568 +70FHH 1,731 1,663 +68CHH 105 106 -1Axe<strong>Cash</strong> + <strong>Food</strong> 953 939 +14<strong>Food</strong> only 379 378 +1MHH 806 797 +9FHH 526 520 +6CHH 33 33 0Oxcart<strong>Cash</strong> + <strong>Food</strong> 66 65 +1<strong>Food</strong> only 16 16 0MHH 60 59 +1FHH 22 22 0CHH 1 1 0Tractor<strong>Cash</strong> + <strong>Food</strong> 18 20 -2<strong>Food</strong> only 0 0 0MHH 12 13 -1FHH 6 7 -1CHH 0 0 054SC Emergency Drought Response.p65542008/09/10, 11:57 AM
Table 17 Changes <strong>in</strong> asset ownership, December 2007 to May 2008Asset <strong>Cash</strong> + <strong>Food</strong> recipients <strong>Food</strong> only recipientsLivestockNumber owned Number owned Number owned Number ownedper household 6 months ago per household 6 months agoCattle 1.309 1.307 1.415 1.422Donkey 0.094 0.088 0.063 0.063Pig 0.250 0.200 0.120 0.130Chicken 7.174 7.532 6.650 7.931Goat 2.001 1.967 1.843 1.821Household goodsCar 0.018 0.020 0.012 0.014Bicycle 0.032 0.032 0.026 0.026Radio 0.589 0.571 0.591 0.593Wardrobe 0.541 0.542 0.589 0.591Bed 1.221 1.206 1.334 1.334Farm implementsPlough 0.191 0.192 0.193 0.193Hoe 2.509 2.402 2.640 2.625Axe 0.778 0.767 0.772 0.770Ox-cart 0.054 0.053 0.033 0.033Tractor 0.015 0.016 0.000 0.000Total 16.776 16.895 16.281 17.546Table 18 <strong>Children</strong> with appropriate dietary diversity (% of households)Month Dec Jan Feb Mar April Average<strong>Cash</strong> plus food6.0 - 8.11 months 65.2 78.6 100.0 87.6 100.0 86.39.0 - 11.11 months 73.9 72.0 87.0 83.3 92.9 81.812.0 - 36 months 60.6 50.0 75.0 77.0 82.5 69.0All ‘cash plus food’ 65.8 59.2 79.2 79.2 85.4 73.8<strong>Food</strong> only6.0 - 8.11 months 100.00 50.00 66.7 66.7 50.0 66.79.0 - 11.11 months n/a 33.3 66.7 87.5 100.0 71.912.0 - 36 months n/a 25.0 63.6 48.1 54.8 47.9All ‘food only’ 33.3 31.9 64.9 58.5 58.5 49.4All children6.0 - 8.11 months 81.0 66.7 84.6 78.6 80.0 78.29.0 - 11.11 months 69.6 61.8 81.3 84.4 94.4 78.312.0 - 36 months 50.0 42.4 72.4 69.3 74.8 61.8All children 62.5 50.7 75.5 73.5 77.8 68.055SC Emergency Drought Response.p65552008/09/10, 11:57 AM
56SC Emergency Drought Response.p65562008/09/10, 11:57 AM