POTATO STORES 2002 - SASA
POTATO STORES 2002 - SASA
POTATO STORES 2002 - SASA

You also want an ePaper? Increase the reach of your titles
YUMPU automatically turns print PDFs into web optimized ePapers that Google loves.
PESTICIDE USAGE IN SCOTLAND<strong>POTATO</strong> <strong>STORES</strong> <strong>2002</strong>J P SnowdenScottish Agricultural Science AgencyEast Craigs, Edinburgh EH12 8NJE-mail: jeremy.snowden@sasa.gsi.gov.ukWeb: http:/www.sasa.gov.ukScottish Agricultural Science Agency
Scottish Agricultural Science AgencyEast CraigsEdinburgh EH12 8NJTelephone: 0131 244 8862An Agency of The Scottish Executive Environment and Rural Affairs Department Crown copyright reserved 2003ISBN 0-9543886-1-5
CONTENTSPageSummary........................................................................................................................................... 1Introduction ...................................................................................................................................... 2Definitions and notes........................................................................................................................ 2Method.............................................................................................................................................. 3Distribution of stores ........................................................................................................................ 4Seed potatoes.................................................................................................................................... 4Ware potatoes................................................................................................................................... 5Comparisons with previous surveys................................................................................................. 6References ........................................................................................................................................ 7Acknowledgements .......................................................................................................................... 7Figure 1 Agricultural land-use regions…..…….…………………………………………………8Figure 2 Storage of seed potatoes 2000....................................................................................... 10Figure 3 Storage of seed potatoes <strong>2002</strong>....................................................................................... 10Figure 4 Storage of ware potatoes 2000 ...................................................................................... 10Figure 5 Storage of ware potatoes <strong>2002</strong> ...................................................................................... 10Figure 6 Comparison of pesticide usage 1994 - <strong>2002</strong>, percentage treated .................................. 11Figure 7 Comparison of pesticide usage 1994 - <strong>2002</strong>, average rate ............................................ 11Table 1 Distribution of stores ...................................................................................................... 12Table 2 Storage type and method ................................................................................................ 13Table 3 Pesticides used by store type and method....................................................................... 14Table 4 Pesticides used and percentage treated........................................................................... 15Table 5 Active ingredients........................................................................................................... 16Table 6 Comparison of pesticide usage 1998-<strong>2002</strong>..................................................................... 17Table 7 Comparison of active ingredient usage 1998-<strong>2002</strong> ........................................................ 17Table 8 Comparison of pesticide usage 1996-<strong>2002</strong>, average dosage rate ................................... 18Table 9 Comparison of pesticide usage 1996-<strong>2002</strong>, percentage treated...................................... 18Table 10 Comparison of pesticide usage 1996-<strong>2002</strong>, quantities used........................................... 18Table 11 Raising factors and first adjustment factors ................................................................... 19Table 12 Second adjustment factors.............................................................................................. 19
SUMMARYThis is the tenth survey on the use of pesticides on stored potatoes in Scotland, covering the cropharvested in <strong>2002</strong>.Compared with the previous survey in 2000, the quantity of both seed and ware potatoes storedrose by around 7% to a total of over 1,234,000 tonnes. There was a significant increase inrefrigerated storage resulting in 75% of seed potatoes and 71% of ware potatoes being stored bythese means.The total quantity of all potatoes treated, 235,538 tonnes, rose roughly in line with the increase intonnage stored, although pesticide usage on seed potatoes increased, whilst that on ware potatoesfell, compared with the previous survey.Overall, imazalil remained the principal active ingredient, being applied to a total of218,231 tonnes, predominantly to seed potatoes. Use of 2-aminobutane, applied to seed only,increased, whilst use of chlorpropham, applied to ware only, declined.P e s t i c i d e U s a g e i n P o t a t o S t o r e s 2 0 0 21
INTRODUCTIONThis is the tenth survey of the use of pesticides on stored potatoes in Scotland, a list of previoussurveys can be found in the references 1-7 .Both the methodology employed in this survey and the presentation of data in the report aresimilar to those of the previous survey covering the potato crop harvested in 2000.DEFINITIONS AND NOTESPesticide information recorded in this survey relates to post-harvest applications, including thosecarried out in the field prior to entry to the store, but excluding pre-planting fungicidal seedtreatments applied towards the end of the storage period, even if they were applied in store.Usage of pesticides in the latter situation is recorded in the Arable Crop reports.Basic tonnage is the quantity of potatoes treated with a pesticide, irrespective of the number oftimes they were treated or the number of pesticides used. This figure is used to calculate thepercentage of potatoes treated with a chemical or groups of chemicals.Tonnes treated is the basic tonnage multiplied by the number of treatments those potatoesreceived.Seed potatoes are those designated as seed, after dressing and removal of the ware fraction.Ware potatoes include those grown for the ware market plus the portion of potatoes originallyplanted for seed but later sold as ware. The quantity of stored potatoes following the harvestrecorded in this report will include soil, wastage, and those potatoes downgraded to animal feed.Farm store data include information obtained from grower-dealers, i.e. those farmers who growand trade in potatoes.For the purpose of this survey, potato merchants do not own agricultural land and are therefore notin the Agricultural Census. As in the previous report, merchants have been subdivided into thosethat grow potatoes on rented land and store potatoes, and those who only store.Due to rounding, there may be slight differences in totals both within and between tables.2P e s t i c i d e U s a g e i n P o t a t o S t o r e s 2 0 0 2
METHODFor this survey, the sample of farms was the same as that for the Arable Crops <strong>2002</strong> 8 and wasdrawn from the <strong>2002</strong> Agricultural Census 9 . In addition, a number of grower-dealers and potatomerchants who grew potatoes were identified during the survey fieldwork. All the knownmerchants in Scotland who did not grow potatoes were surveyed.The country was divided into 11 land-use regions 10 (Fig.1), and the farm store sample was drawnfrom Census returns of holdings growing any of the combine crops. The sample was stratified byland-use region and size of holding. Sampling fractions within region and size group related toarea of crops grown rather than number of farms, so that smaller size groups did not dominate thesample. A number of regions were amalgamated, due to the low number of stores sampled.These regions were Highlands & Islands with Moray Firth and Aberdeen, Lothian with TweedValley, and Southern Uplands with Solway.The data collected were obtained by personal interview and details included the areas grown,quantities of potatoes stored, the storage environment, methods of storage and storage chemicalsapplied. Fungicidal seed treatments applied prior to planting are included in the Arable Cropreports and are therefore not recorded in this report.The data from merchants that grew on rented land were merged with the farm sample. Nationalestimates of storage chemical usage were produced from the sample data by applying raisingfactors based on the areas of potatoes grown in <strong>2002</strong> 9 . An adjustment was made to the warefraction to allow for the potatoes grown for seed that were designated as ware (Table 11). Asecond adjustment (Table 12) was made to the survey estimates of stored potatoes to bring theminto line with the figures provided by the British Potato Council.Information from merchants that did not grow potatoes were recorded separately, as this data wasnot raised. The two data sets were then merged in the final tables to provide total national usagefigures.P e s t i c i d e U s a g e i n P o t a t o S t o r e s 2 0 0 23
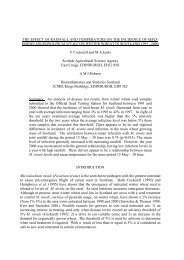
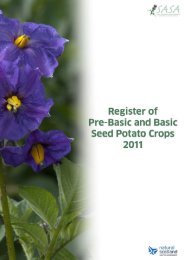
DISTRIBUTION OF <strong>STORES</strong>Information was obtained from a total of 56 stores. The distribution of these stores throughoutScotland is shown in Table 1.SEED <strong>POTATO</strong>ESThe quantity of seed potatoes stored in <strong>2002</strong> was 385,934 tonnes, a 6% increase compared withthe previous survey, but roughly similar to that recorded in 1998.Storage methods (Tables 2, 3)There has been a dramatic increase in refrigerated storage, and in <strong>2002</strong> it was estimated that 75%of all seed potatoes were stored in this way, compared with only 37% in 2000. There was acorresponding drop in basic ventilated storage, from 63% in the previous survey to only 20% in<strong>2002</strong>. Unventilated storage (5%) remained low.Nearly all (99%) seed was boxed, compared with 88% in 2000.Use of pesticides (Tables 3, 4)Almost half (47%) of all seed potatoes were treated in <strong>2002</strong>, a higher proportion than in any of theprevious surveys.Only two pesticides were recorded on seed potatoes, imazalil and 2-aminobutane. The formerremained the most widely used, and almost 170,000 tonnes were treated compared with only75,000 tonnes in the previous survey. Usage of 2-aminobutane also increased, from under 5,000tonnes in 2000 to 12,372 tonnes in the present survey.As in previous surveys, potatoes were treated with pesticides as a general disease precaution. Nospecific reasons were given by growers.4P e s t i c i d e U s a g e i n P o t a t o S t o r e s 2 0 0 2
WARE <strong>POTATO</strong>ESThere was a 7% increase in the tonnage of ware potatoes from around 790,000 in 2000 to almost850,000 in <strong>2002</strong>.Storage methods (Tables 2, 3)Storage methods for <strong>2002</strong> harvested ware potatoes were similar to those recorded for seedpotatoes. It was estimated that 71% of all ware potatoes were refrigerated and 23% ventilated,compared with 33% and 62% respectively in 2000. Unventilated storage remained low (6%).Similar to data presented in the previous two surveys, nearly all ware potatoes were stored inboxes.Use of pesticides (Tables 3, 4)The increase in use of refrigerated storage and the recent withdrawal of tecnazene may be thereasons for the reduction in pesticide usage, from 9% of the tonnage treated in 2000 to only 6% in<strong>2002</strong>, the lowest in recent surveys. Usage of imazalil, applied to 48,423 tonnes, increasedcompared with the previous survey from 26,522 tonnes, whilst usage of chlorpropham, applied tounder 5,000 tonnes, declined.As in previous surveys, ware potatoes were treated mostly for general disease precaution andsprout suppression.P e s t i c i d e U s a g e i n P o t a t o S t o r e s 2 0 0 25
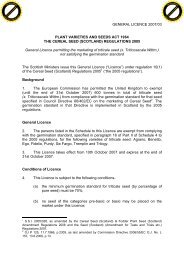
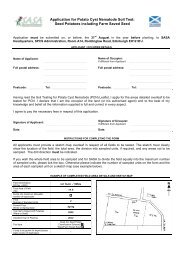
COMPARISONS WITH PREVIOUS SURVEYSComparisons in the usage of pesticide with previous surveys are presented in Tables 6-10 andFigures 6 and 7.Compared with 2000, the total tonnage of all stored potatoes increased by 7% from a little over1,155,000 to 1,234,191, with both seed and ware increasing in roughly similar proportions.The total tonnage and proportion of all potatoes treated, together with the weight of pesticidesapplied, were roughly similar to those recorded in the previous two surveys, although there weresignificant increases in the treatment of seed potatoes, and a corresponding decrease in thosedesignated as ware.When the tonnage of all potatoes treated is taken into account, imazalil remained the most widelyused pesticide. When measured by weight of active ingredient applied, 2-aminobutane, applied toseed only, replaced chlorpropham, applied to ware only, as the main pesticide.6P e s t i c i d e U s a g e i n P o t a t o S t o r e s 2 0 0 2
REFERENCES1. Chapman, P.J., Sly, J.M.A. and Cutler, J.R. Pesticide usage survey report 11, Arable FarmCrops 1974, London, MAFF 1977.2. Tucker, G.G. Survey of pesticide usage on potatoes stored from the 1975 crop. The SeedPotato, 18, No 1, pp 17-22, 1978.3. Steed, J.M., Sly, J.M.A., Tucker, G.G. and Cutler, J.R. Pesticide usage survey report 18,Arable Farm Crops 1977, London, MAFF, 1979.4. Snowden, J.P. and Bowen, H.M. Pesticide usage survey report 73, Potatoes in Store 1986-87, DAFS, Edinburgh, 1989.5. Snowden, J.P. Pesticide usage survey report, Potato Stores 1992,1994 & 1996,SOAEFD, Edinburgh, 1998.6. Snowden, J.P. and Thomas L.A. Pesticide usage survey report, Potato Stores 1998,SOAEFD, Edinburgh, 2001.7. Thomas L.A. Pesticide usage survey report, Potato Stores 2000, SEERAD, Edinburgh,<strong>2002</strong>.8. Snowden, J.P. and Thomas L.A. Pesticide usage survey report, Arable Crops <strong>2002</strong>,SEERAD, Edinburgh 2003.9. Agricultural Statistics, Scotland <strong>2002</strong>, HMSO, Edinburgh, 2003.10. Wood, H.J. An Agricultural Atlas of Scotland, George Gill and Sons, London, 1931.ACKNOWLEDGEMENTSI would like to thank all the farmers and merchants who provided information for this report.Thanks are also given to L A Thomas and C Bierley who collected some of the data and toDr C J Griffiths for providing editorial assistance. In addition, the author is particularly gratefulfor support from Mr D Garthwaite and colleagues at Central Science Laboratory, York, fromInformation Technology Section, <strong>SASA</strong>, and to Mr A Roberts of Biomathematics & StatisticsScotland.P e s t i c i d e U s a g e i n P o t a t o S t o r e s 2 0 0 27
8P e s t i c i d e U s a g e i n P o t a t o S t o r e s 2 0 0 2
P e s t i c i d e U s a g e i n P o t a t o S t o r e s 2 0 0 29
Figure FigureFigureFigure2 Storage of seed potatoes 2000 3 Storage of seed potatoes <strong>2002</strong>refrigerated37%unventilated
FigureFigure 6 Comparison of pesticide usage 1994 – <strong>2002</strong>Percentage of potatoes treated10090807060504030201001994 1996 1998 2000 <strong>2002</strong>Seed Ware All potatoes7 Comparison of pesticide usage 1994 - <strong>2002</strong>Average application of all active ingredients per treated tonne (g/tonne)1601401201008060402001994 1996 1998 2000 <strong>2002</strong>Seed Ware All potatoesP e s t i c i d e U s a g e i n P o t a t o S t o r e s 2 0 0 211
12TABLE 1 Distribution of storesP e s t i c i d e U s a g e i n P o t a t o S t o r e s 2 0 0 2RegionNumberof storesHighlands & Islands, Moray Firth and Aberdeen 7Angus 21East Fife 9Lothian & Tweed Valley 8Central Lowlands 11Scotland 56
TABLE 2 Stored potatoesStorage type and methodP e s t i c i d e U s a g e i n P o t a t o S t o r e s 2 0 0 2 13SeedStore typeStorage methodUnventilated Ventilated Refrigerated Total Bulk Boxed TotalTonnes stored 18,990 79,087 287,857 385,934 2,864 383,070 385,934% type & method 5 20 75 100 1 99 100Basic tonnage treated 45,085 136,036 181,121 2,864 178,257 181,121% treated 57 47 47 100 47 47WareTonnes stored 47,503 198,659 602,095 848,257 916 847,341 848,257% type & method 6 23 71 100 + 100 100Basic tonnage treated 5,735 44,356 50,091 50,091 50,091% treated 3 7 6 6 6‘+’=
TECHNICAL REPORTWISC–4 Extended Norms—FSIQ Equivalents of Sum of Scaled Scores continuedFSIQ Sum FSIQ 90% CI 95% CI Percentile216 187 180–189 179–189 >99.9217 187 180–189 179–189 >99.9218 188 181–190 180–190 >99.9219 189 182–190 181–191 >99.9220 190 183–191 182–192 >99.9221 190 183–191 182–192 >99.9222 191 184–192 183–193 >99.9223 192 185–193 184–194 >99.9224 193 186–194 185–195 >99.9225 193 186–194 185–195 >99.9226 194 187–195 186–196 >99.9227 195 188–196 187–197 >99.9228 196 189–197 188–198 >99.9229 196 189–197 188–198 >99.9230 197 190–198 189–199 >99.9231 198 191–199 190–200 >99.9232 199 192–200 191–201 >99.9233 199 192–200 191–201 >99.9234 200 193–201 192–202 >99.9235 201 194–202 193–203 >99.9236 202 195–203 194–204 >99.9237 202 195–203 194–204 >99.9238 203 196–204 195–205 >99.9239 204 197–205 196–206 >99.9240 205 198–206 197–207 >99.9241 205 198–206 197–207 >99.9242 206 199–207 198–208 >99.9243 207 200–208 199–209 >99.9244 208 201–209 200–210 >99.9245 208 201–209 200–210 >99.9246 209 202–210 201–211 >99.9247–280 210 203–211 202–212 >99.918Copyright © 2008 Pearson Education, Inc. or its affiliate(s). All rights reserved.
TABLE 4 Stored potatoesPesticides used (tonnes treated) and percentage treatedP e s t i c i d e U s a g e i n P o t a t o S t o r e s 2 0 0 2 15SeedTonnestreated<strong>2002</strong>% treated2000% treated2-aminobutane 12,372 3 1Imazalil 169,808 44 19All formulations 182,180 47 22Tonnes stored 385,934 365,001WareChlorpropham 4,935 + 4Imazalil 48,423 6 3All formulations 53,358 6 9Tonnes stored 848,257 790,074‘+’ = < 0.5%
16TABLE 5 Active ingredientsTonnes treated and quantities (kg) usedP e s t i c i d e U s a g e i n P o t a t o S t o r e s 2 0 0 2SeedTonnestreated2-aminobutane 12,372 2,493Imazalil 169,808 1,666All actives 182,180 4,159WareChlorpropham 4,935 104Imazalil 48,423 482All actives 53,358 586kg
P e s t i c i d e U s a g e i n P o t a t o S t o r e s 2 0 0 2 17TABLE 6 Stored potatoesComparison of pesticide usage 1998 – <strong>2002</strong>, tonnes stored, tonnes treated and quantities (kg) used1998 2000 <strong>2002</strong>TonnesstoredTonnestreatedkgTonnesstoredSeed 384,899 143,289 9,116 365,001 81,289 1,582 385,934 182,180 4,159Ware 715,033 102,672 5,280 790,074 119,536 2,771 848,257 53,358 586All potatoes 1,099,932 245,961 14,396 1,155,075 200,825 4,353 1,234,191 235,538 4,745SeedTonnestreatedTABLE 7 Stored potatoesComparison of active ingredient usage 1998 – <strong>2002</strong>, tonnes treated and quantities (kg) used1998 2000 <strong>2002</strong>TonnestreatedkgTonnestreatedkgTonnestreated2-aminobutane 36,140 7,286 4,869 727 12,372 2,493Imazalil 104,974 849 74,862 583 169,808 1,666Tecnazene 2,175 136 1,560 195Thiabendazole 40,096 846 3,823 77All actives 183,385 9,117 85,114 1,582 182,180 4,159WareChlorpropham 25,955 580 80,930 1,747 4,935 104Imazalil 32,906 228 26,522 192 48,423 482Tecnazene 43,811 4,374 12,086 776Thiabendazole 3,316 99 2,777 56All actives 105,988 5,281 122,315 2,771 53,358 586kgkgTonnesstoredTonnestreatedkg
Comparison Comparison Comparison percentage18P e s t i c i d e U s a g e i n P o t a t o S t o r e s 2 0 0 2TABLE 8 Average application rateof pesticide usage 1996 – <strong>2002</strong>,average dosage rate of all actives (g/tonne)TABLE 9 Percentage treatedof pesticide usage 1996 – <strong>2002</strong>,treated (%)1996 1998 2000 <strong>2002</strong> 1996 1998 2000 <strong>2002</strong>Seed 88 64 20 23 Seed 30 37 22 47Ware 59 51 23 11 Ware 11 12 12 6All potatoes 74 59 22 20 All potatoes 16 21 21 19Table 10 Active ingredientsof active ingredient usage 1996 – <strong>2002</strong>,quantities(kg) used on all potatoesActive ingredient1996 1998 2000 <strong>2002</strong>2-aminobutane 8,666 7,286 727 2,493Chlorpropham 65 580 1,747 104Imazalil 687 1,077 775 2,148Tecnazene 6,202 4,510 971Thiabendazole 945 133All actives 15,620 14,398 4,353 4,745
TABLE 11 Raising factors and first adjustment factorsfor ware potatoes combinedTABLE 12 Second adjustment factorsP e s t i c i d e U s a g e i n P o t a t o S t o r e s 2 0 0 2 19RegionSeed WareHighlands & Islands, Moray Firth and Aberdeen 9.56 9.56Angus 5.66 12.22East Fife 8.74 7.84Lothian and Tweed Valley 10.89 6.84Central Lowlands 2.57 6.10Seed potatoes 0.7491Ware potatoes 1.0759