08. Costing Essential Services Package An Issue Paper
08. Costing Essential Services Package An Issue Paper 08. Costing Essential Services Package An Issue Paper
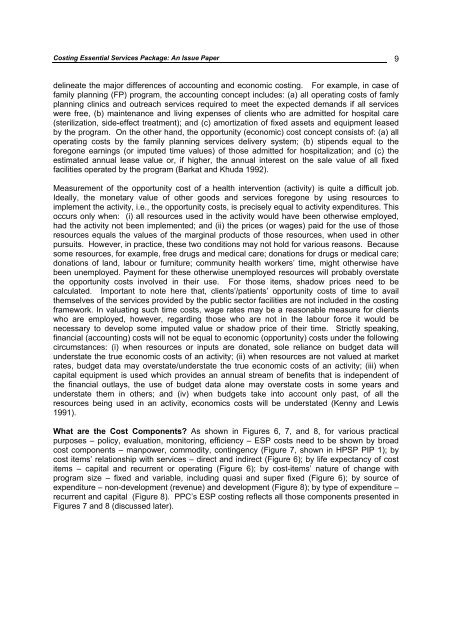
Costing Essential Services Package: An Issue Paper 9 delineate the major differences of accounting and economic costing. For example, in case of family planning (FP) program, the accounting concept includes: (a) all operating costs of famly planning clinics and outreach services required to meet the expected demands if all services were free, (b) maintenance and living expenses of clients who are admitted for hospital care (sterilization, side-effect treatment); and (c) amortization of fixed assets and equipment leased by the program. On the other hand, the opportunity (economic) cost concept consists of: (a) all operating costs by the family planning services delivery system; (b) stipends equal to the foregone earnings (or imputed time values) of those admitted for hospitalization; and (c) the estimated annual lease value or, if higher, the annual interest on the sale value of all fixed facilities operated by the program (Barkat and Khuda 1992). Measurement of the opportunity cost of a health intervention (activity) is quite a difficult job. Ideally, the monetary value of other goods and services foregone by using resources to implement the activity, i.e., the opportunity costs, is precisely equal to activity expenditures. This occurs only when: (i) all resources used in the activity would have been otherwise employed, had the activity not been implemented; and (ii) the prices (or wages) paid for the use of those resources equals the values of the marginal products of those resources, when used in other pursuits. However, in practice, these two conditions may not hold for various reasons. Because some resources, for example, free drugs and medical care; donations for drugs or medical care; donations of land, labour or furniture; community health workers’ time, might otherwise have been unemployed. Payment for these otherwise unemployed resources will probably overstate the opportunity costs involved in their use. For those items, shadow prices need to be calculated. Important to note here that, clients’/patients’ opportunity costs of time to avail themselves of the services provided by the public sector facilities are not included in the costing framework. In valuating such time costs, wage rates may be a reasonable measure for clients who are employed, however, regarding those who are not in the labour force it would be necessary to develop some imputed value or shadow price of their time. Strictly speaking, financial (accounting) costs will not be equal to economic (opportunity) costs under the following circumstances: (i) when resources or inputs are donated, sole reliance on budget data will understate the true economic costs of an activity; (ii) when resources are not valued at market rates, budget data may overstate/understate the true economic costs of an activity; (iii) when capital equipment is used which provides an annual stream of benefits that is independent of the financial outlays, the use of budget data alone may overstate costs in some years and understate them in others; and (iv) when budgets take into account only past, of all the resources being used in an activity, economics costs will be understated (Kenny and Lewis 1991). What are the Cost Components? As shown in Figures 6, 7, and 8, for various practical purposes – policy, evaluation, monitoring, efficiency – ESP costs need to be shown by broad cost components – manpower, commodity, contingency (Figure 7, shown in HPSP PIP 1); by cost items’ relationship with services – direct and indirect (Figure 6); by life expectancy of cost items – capital and recurrent or operating (Figure 6); by cost-items’ nature of change with program size – fixed and variable, including quasi and super fixed (Figure 6); by source of expenditure – non-development (revenue) and development (Figure 8); by type of expenditure – recurrent and capital (Figure 8). PPC’s ESP costing reflects all those components presented in Figures 7 and 8 (discussed later).
Costing Essential Services Package: An Issue Paper 10 Figure 6: Type of Cost Classification Relation with services Life expectancy Direct In-direct (overhead) (shadow pricing) Pay and allowances (Manpower) Nondevelopment (Revenue) (43%) Source Simple (land, building) Development (57%) Capital Quasi (Kit) Recurrent (operating) Figure 7: Broad Cost Components Commodity Cost Figure 8: Super (Central administration, system installation) Nature of change with program size (or nature of inputs) Fixed Contingency Cost PPC’s Cost Component Analysis Recurrent (77%) Type of Expenditure Capital (23%) Simple (Medicine) Manpower Cost (47%) Note: Figures in the parentheses show share of HPSP expenditure for the first year (GoB 1998a: 79-81) Variable Purpose Quasi (BCC) Other Cost (53%)
- Page 1 and 2: Costing Essential Services Package
- Page 3 and 4: Abbreviations AC Adolescent Care AI
- Page 5 and 6: Abbreviations CONTENTS 1. Backgroun
- Page 7 and 8: Costing Essential Services Package:
- Page 9 and 10: Costing Essential Services Package:
- Page 11 and 12: Costing Essential Services Package:
- Page 13: Costing Essential Services Package:
- Page 17 and 18: Costing Essential Services Package:
- Page 19 and 20: Costing Essential Services Package:
- Page 21 and 22: Costing Essential Services Package:
- Page 23 and 24: Costing Essential Services Package:
- Page 25 and 26: Costing Essential Services Package:
- Page 27 and 28: Costing Essential Services Package:
- Page 29 and 30: Costing Essential Services Package:
- Page 31 and 32: Costing Essential Services Package:
<strong>Costing</strong> <strong>Essential</strong> <strong>Services</strong> <strong>Package</strong>: <strong>An</strong> <strong>Issue</strong> <strong>Paper</strong> 9<br />
delineate the major differences of accounting and economic costing. For example, in case of<br />
family planning (FP) program, the accounting concept includes: (a) all operating costs of famly<br />
planning clinics and outreach services required to meet the expected demands if all services<br />
were free, (b) maintenance and living expenses of clients who are admitted for hospital care<br />
(sterilization, side-effect treatment); and (c) amortization of fixed assets and equipment leased<br />
by the program. On the other hand, the opportunity (economic) cost concept consists of: (a) all<br />
operating costs by the family planning services delivery system; (b) stipends equal to the<br />
foregone earnings (or imputed time values) of those admitted for hospitalization; and (c) the<br />
estimated annual lease value or, if higher, the annual interest on the sale value of all fixed<br />
facilities operated by the program (Barkat and Khuda 1992).<br />
Measurement of the opportunity cost of a health intervention (activity) is quite a difficult job.<br />
Ideally, the monetary value of other goods and services foregone by using resources to<br />
implement the activity, i.e., the opportunity costs, is precisely equal to activity expenditures. This<br />
occurs only when: (i) all resources used in the activity would have been otherwise employed,<br />
had the activity not been implemented; and (ii) the prices (or wages) paid for the use of those<br />
resources equals the values of the marginal products of those resources, when used in other<br />
pursuits. However, in practice, these two conditions may not hold for various reasons. Because<br />
some resources, for example, free drugs and medical care; donations for drugs or medical care;<br />
donations of land, labour or furniture; community health workers’ time, might otherwise have<br />
been unemployed. Payment for these otherwise unemployed resources will probably overstate<br />
the opportunity costs involved in their use. For those items, shadow prices need to be<br />
calculated. Important to note here that, clients’/patients’ opportunity costs of time to avail<br />
themselves of the services provided by the public sector facilities are not included in the costing<br />
framework. In valuating such time costs, wage rates may be a reasonable measure for clients<br />
who are employed, however, regarding those who are not in the labour force it would be<br />
necessary to develop some imputed value or shadow price of their time. Strictly speaking,<br />
financial (accounting) costs will not be equal to economic (opportunity) costs under the following<br />
circumstances: (i) when resources or inputs are donated, sole reliance on budget data will<br />
understate the true economic costs of an activity; (ii) when resources are not valued at market<br />
rates, budget data may overstate/understate the true economic costs of an activity; (iii) when<br />
capital equipment is used which provides an annual stream of benefits that is independent of<br />
the financial outlays, the use of budget data alone may overstate costs in some years and<br />
understate them in others; and (iv) when budgets take into account only past, of all the<br />
resources being used in an activity, economics costs will be understated (Kenny and Lewis<br />
1991).<br />
What are the Cost Components? As shown in Figures 6, 7, and 8, for various practical<br />
purposes – policy, evaluation, monitoring, efficiency – ESP costs need to be shown by broad<br />
cost components – manpower, commodity, contingency (Figure 7, shown in HPSP PIP 1); by<br />
cost items’ relationship with services – direct and indirect (Figure 6); by life expectancy of cost<br />
items – capital and recurrent or operating (Figure 6); by cost-items’ nature of change with<br />
program size – fixed and variable, including quasi and super fixed (Figure 6); by source of<br />
expenditure – non-development (revenue) and development (Figure 8); by type of expenditure –<br />
recurrent and capital (Figure 8). PPC’s ESP costing reflects all those components presented in<br />
Figures 7 and 8 (discussed later).


