Arable Crops 2004 - SASA
Arable Crops 2004 - SASA
Arable Crops 2004 - SASA

Create successful ePaper yourself
Turn your PDF publications into a flip-book with our unique Google optimized e-Paper software.
PESTICIDE USAGE IN SCOTLANDARABLE CROPS <strong>2004</strong>(Revised 2009)J P Snowden, L A Thomas & G StruthersScottish Agricultural Science AgencyEast Craigs, Edinburgh EH12 8NJE-mail: psu@sasa.gsi.gov.ukWeb: http:/www.sasa.gov.ukScottish Agricultural Science Agency ------------------------------------------------------------
Scottish Agricultural Science AgencyEast CraigsEdinburgh EH12 8NJTelephone: 0131 244 8862An Agency of The Scottish Executive Environment and Rural Affairs Department© Crown copyright reserved 2005
Reason for Report RevisionThis report has been reissued to correct inaccuracies in active ingredient application area data thatwere overestimated in the original report.This issue only affects a limited number of active ingredients in relation to active ingredientapplication area. All formulation data and active ingredient weight data are unaffected. Theamended tables are:Table 27 – Cereal fungicide active ingredientsTable 28 – Cereal herbicide and growth regulator active ingredientsTable 31 – Oilseed rape fungicide active ingredientsTable 32 – Oilseed rape herbicide active ingredientsTable 35 – Potato fungicide active ingredientsTable 39 – Legume fungicide active ingredientsTable 45 – Principal active ingredientsTables 47-50 – Comparisons with previous yearsText relating to the data contained in these tables has also been revised.
Q CONTENTS● Page Summary .......................................................................................................................................... 1 Introduction ...................................................................................................................................... 2 Definitions and notes ........................................................................................................................ 2 Method.............................................................................................................................................. 3 Winter barley .................................................................................................................................... 4 Spring barley .................................................................................................................................... 5 Winter wheat .................................................................................................................................... 6 Spring wheat..................................................................................................................................... 7 Winter oats ....................................................................................................................................... 7 Spring oats ........................................................................................................................................ 8 Winter oilseed rape........................................................................................................................... 9 Spring oilseed rape ......................................................................................................................... 10 Seed potatoes .................................................................................................................................. 11 Early potatoes ................................................................................................................................. 12 Ware potatoes ................................................................................................................................. 12 Legumes ......................................................................................................................................... 13 Minor crops .................................................................................................................................... 14 Set aside land.................................................................................................................................. 15 Comparison with previous surveys ................................................................................................ 16 References ...................................................................................................................................... 18 Acknowledgements ........................................................................................................................ 18 ● Page Figure 1 Agricultural land-use regions .......................................................................................... 19 Figure 2 Percentage areas of arable crops grown .......................................................................... 20 Figure 3 Estimated percentage areas of set aside .......................................................................... 20 Figure 4 Distribution of pesticide types on crops.......................................................................... 21 Figure 5 Percentage of areas of crops treated with insecticide...................................................... 22 Figure 6 Percentage of areas of crops treated with fungicide........................................................ 22 Figure 7 Percentage of areas of crops treated with herbicide ........................................................ 22 Figure 8 Trends in main insecticide types 1990 - <strong>2004</strong>................................................................. 23 Figure 9 Top 5 active ingredients in <strong>2004</strong>: trends in usage 1992 - <strong>2004</strong>....................................... 77 Figure 10 Cereals, comparison with previous years...................................................................... 79 Figure 11 Oilseed rape, comparison with previous years.............................................................. 81 Figure 12 Potatoes, comparison with previous years .................................................................... 83 Figure 13 Set aside, comparison with previous years.................................................................... 85 Table 1 Regional distribution of arable crops in <strong>2004</strong> .................................................................. 24 Table 2 Distribution of sample ...................................................................................................... 25 Table 3 Proportion (%) of each crop treated with pesticides (cereals) .......................................... 26 Table 4 Proportion (%) of each crop treated with pesticides (other crops) ................................... 26 Table 5 Cereal seed treatment formulations .................................................................................. 27Table 6 Cereals insecticide and molluscicide formulations .......................................................... 28 Table 7 Cereals fungicide formulations......................................................................................... 29 Table 8 Cereals herbicide and growth regulator formulations ...................................................... 32
Table 9 Oilseed rape seed treatment formulations ........................................................................ 36 Table 10 Oilseed rape insecticide and molluscicide formulations ................................................ 37 Table 11 Oilseed rape fungicide formulations .............................................................................. 38 Table 12 Oilseed rape herbicide and growth regulator formulations ............................................ 39 Table 13 Potato seed treatment formulations ................................................................................ 40 Table 14 Potato insecticide and molluscicide formulations .......................................................... 41 Table 15 Potato fungicide formulations ........................................................................................ 42 Table 16 Potato herbicide and growth regulator formulations ...................................................... 44 Table 17 Legume seed treatment formulations ............................................................................. 45 Table 18 Legume insecticide formulations ................................................................................... 46 Table 19 Legume fungicide formulations ..................................................................................... 47 Table 20 Legume herbicide formulations...................................................................................... 48Table 21 Set aside seed treatment formulations ............................................................................ 49 Table 22 Set aside insecticide and molluscicide formulations ...................................................... 50 Table 23 Set aside fungicide formulations .................................................................................... 51 Table 24 Set aside herbicide formulations .................................................................................... 52 Table 25 Cereals seed treatment active ingredients....................................................................... 53 Table 26 Cereals insecticide and molluscicide active ingredients................................................. 54 Table 27 Cereals fungicide active ingredients............................................................................... 55Table 28 Cereals herbicide and growth regulator active ingredients ............................................ 57 Table 29 Oilseed rape seed treatment active ingredients............................................................... 60 Table 30 Oilseed rape insecticide and molluscicide active ingredients......................................... 61 Table 31 Oilseed rape fungicide active ingredients....................................................................... 62 Table 32 Oilseed rape herbicide and growth regulator active ingredients .................................... 63 Table 33 Potato seed treatment active ingredients ........................................................................ 64 Table 34 Potato insecticide, molluscicide and nematicide active ingredients ............................... 65 Table 36 Potato herbicide active ingredients................................................................................. 67 Table 37 Legume seed treatment active ingredients ..................................................................... 68 Table 38 Legume insecticide active ingredients............................................................................ 69 Table 39 Legume fungicide active ingredients.............................................................................. 70 Table 40 Legume herbicide active ingredients.............................................................................. 71 Table 41 Set aside seed treatment active ingredients .................................................................... 72 Table 42 Set aside insecticide and molluscicide active ingredients .............................................. 73 Table 43 Set aside fungicide active ingredients ............................................................................ 74 Table 44 Set aside herbicide active ingredients............................................................................. 75Table 45 Principal active ingredients by area................................................................................ 76 Table 46 Principal active ingredients by weight ........................................................................... 76 Table 47 Cereals, comparison with previous years ....................................................................... 78 Table 48 Oilseed rape, comparison with previous years ............................................................... 80 Table 49 Potatoes, comparison with previous years...................................................................... 82 Table 50 Set aside, comparison with previous years ..................................................................... 84 Table 51 Sampled area .................................................................................................................. 86 Table 52 Census area..................................................................................................................... 86 Table 53 Raising factors ................................................................................................................ 87 Table 54 First and second adjustment factors ............................................................................... 88
Q SUMMARYThis report presents information from a survey of pesticide usage on arable crops in Scotlandduring the 2003/<strong>2004</strong> growing season. The sample data have been raised to give estimates ofnational pesticide usage.The total area of arable crops, excluding land for set aside, was 515,702 hectares, a fall of lessthan 1% compared with 2002 when the previous survey had been carried out. There wereincreases in area for all crops except winter barley, spring barley, spring oats, seed potatoes andlinseed.When measured by the area treated with active ingredients, insecticide usage fell by 5% comparedwith the previous survey. The pyrethroid, lambda-cyhalothrin, applied to over 67,000 hectaresand used extensively on potatoes, winter cereals and oilseed rape, replaced pirimicarb as the mostpopular insecticide. Methiocarb usage declined by 48%, due mainly to the reduction in use onwinter wheat and winter oilseed rape during the dry autumn of 2003. Metaldehyde, applied toaround 34,000 hectares, remained the most widely used molluscicide.The total area treated with fungicide active ingredients increased by 19% compared with 2002,due to significant increases on cereals and oilseed rape. Chlorothalonil, applied to around404,000 hectares and used mainly on winter wheat and spring barley, replaced fenpropimorph asthe principal fungicide. The increase in usage of chlorothalonil coincided with widespreadresistance in strobilurin fungicides against Septoria tritici in wheat, and the effectiveness ofchlorothalonil to protect barley crops against Ramularia collo cygni and Rhynchosporium secalis(Pers. Comm. Oxley,S).Compared with the area treated in the previous survey, overall herbicide usage increased by 7%,due mainly to increased usage on cereals and oilseed rape. Mecoprop-P, applied to around247,000 hectares of cereals, remained the most commonly used herbicide.1
Q INTRODUCTIONThis is the twelfth survey of pesticide usage on arable crops in Scotland, the previous surveysbeing in 1974, 1977, 1982, 1987, 1988, 1990, 1992, 1994, 1996, 1998, 2000 and 2002 1-12 , (surveyreport 74 in 1987 covered potatoes only) and is part of a continuing program of post registrationsurveillance of pesticides. The survey covered cereals, oilseeds, potatoes, legumes (peas, beansand lupins), and set aside land.The methodology employed was broadly similar to that described in previous surveys. A minoraddition to this report is the detailed pesticide usage on legumes (peas, beans and lupins) which ispresented in the same way as all other major crops.Q DEFINITIONS AND NOTESBasic area is the planted area of crop which was treated with a given pesticide or pesticide group,irrespective of the number of times it was applied to that area. Basic areas are not presentedanywhere in the report, but their values are used to calculate the percentage of crop treated with agiven pesticide or pesticide group.Area treated (or hectares treated) is the basic area of a crop treated with a given pesticidemultiplied by the number of treatments that area received. These terms are synonymous with"spray area" and "spray hectare" which have appeared in previous reports. The new terms arebelieved to more appropriate where pelleted or granular treatments are applied.In this report the term ‘formulation(s)’ is used to describe the pesticide active ingredient ormixture of active ingredients in a product(s).The reasons for the uses of pesticides reported in the text are those given by growers and maysometimes be inappropriate.It should be borne in mind that some of the herbicides may not have been applied directly to thecrop itself but either as land preparation treatments prior to sowing/planting the crop or to controlweeds at the field margins.All pesticide usage referring to those spring crops sown on land where winter crops failed areincluded in the appropriate tables, but data relating to those pesticides applied to the failed cropsare not recorded.Usage of sulphur on oilseed rape has been recorded as though it were a pesticide. However, thepredominant reason for its use is as a nutrient rather than to control disease.Due to rounding, there may be slight differences in totals both within and between tables.Data from the 2002 survey are provided for comparison purposes in some of the tables, although itshould be borne in mind that there may be minor differences in the range of crops surveyed,together with changes in areas of each of the crops grown.2
Q METHODUsing the June <strong>2004</strong> Agricultural Census 13 a sample was drawn representing the whole ofScotland and was selected from holdings growing any of the combinable crops and/or potatoes.As in previous surveys of this type, the country was divided into 11 land-use regions 14 (Fig 1).Holdings were stratified by land-use region and by size group (based on the total area of arablecrops grown, excluding set aside land). Sampling fractions within both regions and size groupswere based on the areas of the relevant crops grown rather than number of holdings, so thatsmaller size groups would not dominate the sample.The survey period was from the end of the 2003 harvest to the end of the <strong>2004</strong> harvest. As well asrecording treatments applied directly to the crop, data were also collected on land preparationtreatments prior to sowing/planting the crop.With a few exceptions, each grower was visited by a surveyor, following an introductory letterand telephone call. A small number of growers in remote areas had to be interviewed bytelephone, again by prior arrangement. When necessary, data were also collected from consultantagronomists, contractors and seed merchants. In all, information was obtained from 325 holdings.Details of the numbers of holdings visited and their distribution are given in Table 2 and the areasof crops surveyed are shown in Table 51.For all crops, sample data were raised to give estimates of national pesticide usage using raisingfactors (Table 53). These were based on the areas growing arable crops in the <strong>2004</strong> AgriculturalCensus 13 within regions and size groups (Table 52). Adjustments (Table 54) were made for eachcrop, including those grown on set aside land, within each region by applying the raising factors(Table 53) to the sample area of each crop grown and comparing this with the area from the <strong>2004</strong>Agricultural Census. A second adjustment was made for crops where no holdings were sampledin one or more regions (Table 54). In Tables 47, 48 and 49 only, estimates of pesticide usagewere further adjusted to take into account those pesticide treatments which were known to havebeen applied, but where the details were unspecified.3
Q WINTER BARLEYThe area grown in <strong>2004</strong> was 56,709 hectares, a 7% decline compared with the previous survey.● Seed treatments (Table 5)The proportion of seed treated with a pesticide was 90%, compared with 96% in 2002.As in the previous three surveys, the formulation comprising tebuconazole/triazoxide was by farthe most popular treatment, and in <strong>2004</strong> was used on 71% of the seed. Of the remainingtreatments, fludioxonil and imidacloprid/tebuconazole/triazoxide, each applied to 5% of winterbarley seed, were the most commonly recorded.● Insecticides and molluscicides (Tables 6, 26)The proportion of the area of the crop treated with insecticides was 26%, slightly down on the29% recorded in 2002. Lambda-cyhalothrin, applied to 10% of the crop area, replacedcypermethrin (7%) as the most commonly used insecticide. As in previous years, treatment waspredominantly for aphid control to prevent transmission of barley yellow dwarf virus (BYDV).Tau-fluvalinate and deltamethrin, each applied to 3% of the crop area, were also widely used.Only 1% of the crop area was treated with molluscicides, compared with 4% in 2002.Methiocarb, thiodicarb, and metaldehyde were all recorded on small areas.● Fungicides (Tables 7, 27)As in the previous survey, nearly all (98%) of the crop area was treated with fungicide. Mildewand rhynchosporium were the most commonly specified reasons for use of fungicides.Fenpropimorph remained the most popular fungicide active ingredient, applied to 70,623 hectares,accounting for 19% of the total area treated with fungicide active ingredients. Chlorothalonil(12%), which had not been widely used in 2002, and cyprodinil (12%) were also popular.Chlorothalonil is a protectant fungicide with good activity against Rhynchosporium secalis. Theincrease in usage of chlorothalonil coincides with an increase in this disease. This is partly due toa decline in sensitivity of some triazole fungicides, which are commonly used to control thisdisease (Pers. Comm. Oxley,S).● Herbicides and growth regulators (Tables 8, 28)Nearly the entire crop area received a herbicide treatment, compared with 97% in 2002. As inprevious years, control of annual broad-leaved weeds was the most common reason cited forherbicide usage.Usage of the most popular herbicides was very similar to that recorded in the three most recentsurveys. Isoproturon remained the principal herbicide, accounting for 26% of the total areatreated with herbicide active ingredients, and applied to 49,935 hectares. Diflufenican (15%),glyphosate (12%), pendimethalin (11%) and mecoprop-P (8%) were again widely used.4
Q SPRING BARLEYThe area of spring barley, 259,329 hectares, declined by 2% compared with the previous survey in2002.● Seed treatments (Table 5)Ninety-four percent of the seed was treated with a pesticide, similar to that recorded in 2002.As in the previous three surveys, the formulation comprising tebuconazole/triazoxide was by farthe most popular treatment, and was applied to 67% of the seed. Compared with 2002, usage offludioxonil (11%) increased, whilst that of guazatine (only 3%) declined.● Insecticides and molluscicides (Tables 6, 26)Usage of insecticides on spring barley remained low, and in <strong>2004</strong>, were applied to only 3% of thecrop area. As in the previous four surveys, chlorpyrifos, applied to 5,088 hectares forleatherjacket control, was the most popular insecticide.Only very small areas, 167 hectares, were treated with the molluscicide, thiodicarb. In 2002, nomolluscicides had been recorded.● Fungicides (Tables 7, 27)The proportion of the crop area treated with fungicides in <strong>2004</strong> was 88%, similar to that recordedin the previous survey, and again, mildew and rhynchosporium were the main reasons specifiedfor use of fungicides.As in previous surveys, fenpropimorph was the principal fungicide recorded on spring barley, andin <strong>2004</strong> was applied to 218,802 hectares, accounting for 20% of the total area treated withfungicide active ingredients. Usage of chlorothalonil increased dramatically from less than4,000 hectares in 2002 to 162,854 hectares in <strong>2004</strong>. The main reason for this increase is due tothe need to protect crops from a relatively new disease complex in barley caused by Ramulariacollo cygni and abiotic or physiological stresses. Chlorothalonil is effective against both types ofbarley leaf spots, so its usage has increased as the barley leaf spot diseases have become a regulardisease problem (Pers. Comm. Oxley,S). Flusilazole and epoxiconazole were again widely used.● Herbicides and growth regulators (Tables 8, 28)Overall usage of herbicides remained similar to that recorded in previous surveys, and in <strong>2004</strong>,98% of the crop area was treated, mainly for the control of annual broad-leaved weeds.Metsulfuron-methyl, applied to 186,305 hectares and accounting for 22% of the total herbicideactive ingredients, remained the most popular herbicide on spring barley crops. As in 2002,mecoprop-P (20%) and thifensulfuron-methyl (19%) were also widely used.5
Q WINTER WHEATThe estimated area of winter wheat grown in <strong>2004</strong> was 99,140 hectares, a 3% increase comparedwith the previous survey.● Seed treatments (Table 5)The proportion of seed treated with pesticide was 94%, slightly lower than the 96% recorded in2002. The formulation comprising bitertanol/fuberidazole, used on 37% of the seed in <strong>2004</strong>,remained the most popular treatment. Fludioxonil, applied to 19% of the seed, was also widelyused.● Insecticides and molluscicides (Tables 6, 26)Thirty-five percent of the crop area was treated with insecticide, similar to that recorded in 2002.As in previous years, most treatments were for the control of aphids to prevent transmission ofBYDV.Lambda-cyhalothrin, applied to 15,221 hectares or 15% of the crop area, replaced cypermethrin(9%) as the most popular insecticide.Only 5% of the crop area was treated with molluscicides, considerably less than the 26% recordedin 2002. Metaldehyde, applied to 3,447 hectares, remained the most popular molluscicide.● Fungicides (Tables 7, 27)Nearly all, 98%, of the crop area was treated with a fungicide, compared with the entire crop in2002. Control of mildew and septoria remained the most commonly cited reasons for their use.Usage of chlorothalonil, which had been applied to less than 20,000 hectares in 2002, showed amarked increase in the present survey. The increase in chlorothalonil coincided with widespreadresistance in the QoI group of fungicides (Quinone outside Inhibitors commonly known asstrobilurins), to Septoria tritici, which is currently the key disease affecting wheat. This rapid lossin efficacy of strobilurin fungicides meant growers used chlorothalonil as an alternative product toapply together with triazole fungicides, e.g. epoxiconazole, to achieve effective disease protection(Pers. Comm. Oxley,S). It was applied to 178,113 hectares, accounting for 20% of the total areaof fungicide active ingredients, and replaced epoxiconazole (18%) as the principal fungicide. Asin the previous survey, fenpropimorph, kresoxim-methyl and tebuconazole were also widely used.● Herbicides and growth regulators (Tables 8, 28)Nearly all (96%) of the area of the crop was treated with herbicide, a similar proportion to thatrecorded in 2002, and, as in previous years, control of annual broad-leaved weeds was the mostcommonly cited reason for herbicide usage.Isoproturon, applied to 81,569 hectares and accounting for 22% of the total area of herbicideactive ingredients, remained by far the most popular herbicide. As in 2002, diflufenican andmecoprop-P (each 13%) were also commonly used.Ninety-five percent of the crop was treated with a growth regulator, compared with 97% in 2002.Chlormequat, applied to 143,656 hectares, remained the main growth regulator.6
Q SPRING WHEATThis crop is not recorded separately in the Agricultural Census, but it was estimated that2,535 hectares were grown in Scotland in <strong>2004</strong>, compared with only 842 hectares in the previoussurvey. Estimates of pesticide usage are presented in Tables 5-8 and 25-28.Q WINTER OATSThe area of winter oats in <strong>2004</strong> was 6,152 hectares, a 13% increase compared with 2002.● Seed treatments (Table 5)Eighty-four percent of seed was treated with pesticide, slightly lower than the 88% recorded in theprevious survey. Fludioxonil, applied to 1,862 hectares, 30% of seed, replaced guazatine as themost commonly used treatment.● Insecticides and molluscicides (Tables 6, 26)The proportion of the crop area treated with insecticide was 31%, a similar figure to that recordedin 2002. Aphid control was the only reason specified for insecticide usage.Cypermethrin, applied to 1,283 hectares, 21% of the crop area, remained the most popularinsecticide. Lambda-cyhalothrin was the only other insecticide encountered.Only 61 hectares (1% of the crop area) were treated with the molluscicide, methiocarb. In 2002,thiodicarb, applied to 9% of crop area, had been the only molluscicide recorded.● Fungicides (Tables 7, 27)Nearly all, 96% of the crop area, was treated with fungicides, compared with only 80% in 2002.Mildew control was again the main reason specified for their use.As in previous surveys, fenpropimorph, applied to 7,706 hectares and accounting for 42% of thetotal area treated with fungicide active ingredients, was the most popular fungicide.Epoxiconazole and kresoxim-methyl were also widely used.● Herbicides and growth regulators (Tables 8, 28)The entire crop was treated with herbicides, a similar situation to that encountered in 2002, andagain, annual broad-leaved weed control was the most commonly cited reason.Mecoprop-P, applied to 4,387 hectares and flupyrsulfuron-methyl, to 3,833 hectares, were themost commonly used herbicides.Eighty-eight percent of the crop was treated with a growth regulator. Chlormequat, applied to5,932 hectares, replaced trinexapac-ethyl (2,716 hectares), as the most widely used growthregulator.7
Q SPRING OATSThe area grown in <strong>2004</strong> was 15,814 hectares, a 4% decline since the previous survey.● Seed treatments (Table 5)Eighty-seven percent of the seed was treated with pesticide, slightly lower than in 2002 when 92%was treated.The formulation comprising bitertanol/fuberidazole, applied to 4,811 hectares, 30% of the seed,replaced guazatine (2,312 hectares) as the most popular treatment.● Insecticides and molluscicides (Tables 6, 26)Only 3% of the crop area was treated with insecticide, similar to that recorded in previous surveys. Chlorpyrifos, applied to 331 hectares for leatherjacket control, and lambda-cyhalothrin for aphid control, were the only insecticides encountered. As in previous surveys, no molluscicide usage was recorded. ● Fungicides (Tables 7, 27)Sixty-one percent of the crop area was treated with fungicide, slightly lower than the 68%recorded in 2002. As in previous surveys, control of mildew was the main reason specified fortheir use.Fenpropimorph remained the most popular fungicide, and in <strong>2004</strong> was applied to 7,924 hectares,accounting for 31% of the total treated area of fungicide active ingredients. As in the previoussurvey, quinoxyfen, epoxiconazole and kresoxim-methyl were also widely used.● Herbicides and growth regulators (Tables 8, 28)The proportion of the crop area treated with herbicide in <strong>2004</strong> was 91%, slightly higher than the85% recorded in the previous survey. Control of annual broad-leaved weeds was the mostcommonly cited reason for their use.The two most popular herbicides were again mecoprop-P, applied to10,035 hectares, andmetsulfuron-methyl, to 8,057 hectares.As in 2002, around half the crop area was treated with a growth regulator. Chlormequat, appliedto 5,012 hectares, remained the most popular treatment.8
Q WINTER OILSEED RAPEThe area grown in <strong>2004</strong> was 34,167 hectares, a 29% increase compared with the previous survey.● Seed treatments (Table 9)Nearly all, 97%, of the seed was treated, compared with an estimated 100% in 2002.Iprodione, applied to 83% of the seed, remained the most popular treatment, followed by thiram,to 79%. The insecticide formulation comprising beta-cyfluthrin/imidacloprid, 47%, was alsowidely used.● Insecticides and molluscicides (Tables 10, 30)Sixty percent of the crop area was treated with an insecticide, slightly lower than the 67%recorded in 2002. Control of pollen beetle was the main reason specified for insecticide use,compared with aphid control in the previous survey.Lambda-cyhalothrin, applied to 10,568 hectares or 28% of the crop area, remained the principalinsecticide. Cypermethrin, applied to 5,235 hectares, and deltamethrin to 4,439 hectares, werealso popular.Only 12% of the crop area was treated with molluscicides, compared with 34% in 2002. As inprevious surveys, metaldehyde and methiocarb were the most commonly used molluscicides.● Fungicides (Tables 11, 31)As in the previous two surveys, almost the entire crop area received fungicide, predominantly forcontrol of light leaf spot. Flusilazole, applied to 41,904 hectares and accounting for 27% of thetotal treated area of fungicide active ingredients, replaced carbendazim, applied to 32,772 hectares(21%) as the principal fungicide.● Herbicides and growth regulators (Tables 12, 32)The entire crop was treated with a herbicide, compared with 98% in 2002, mainly for control ofannual broad-leaved weeds. Metazachlor, applied to 26,144 hectares and accounting for 39% ofthe total area of herbicide active ingredients, remained by far the most commonly used herbicide.Usage of propaquizafop, applied to 9,527 hectares, for the control of annual grass weeds andvolunteer cereals, increased, whilst glyphosate (9,282 hectares) remained popular for pre-harvestdesiccation.As in 2002, very small areas were treated with the growth regulator, chlormequat.9
Q SPRING OILSEED RAPECompared with the previous survey in 2002, the area increased by 16% to 5,178 hectares.● Seed treatments (Table 9)It was estimated that all the seed was treated in <strong>2004</strong>.Thiram, applied to 84% of the seed, remained the principal treatment. Iprodione, applied to 72%,and the insecticide formulation comprising beta-cyfluthrin/imidacloprid, to 41%, were the onlyother treatments encountered.● Insecticides and molluscicides (Tables 10, 30)The proportion of the crop area treated with insecticides declined from 80% in 2002 to 60% in thepresent survey. As in previous surveys, pollen beetle control was the most commonly cited reasonfor their use.In <strong>2004</strong>, lambda-cyhalothrin and tau-fluvalinate, applied to 1,973 and 1,024 hectares respectively,were the most popular insecticides. Usage of cypermethrin and alpha-cypermethrin, which hadbeen the main insecticides in the previous survey, was much lower in <strong>2004</strong>.No molluscicide usage was encountered in <strong>2004</strong>. In the previous survey, 10% of the crop hadbeen treated with thiodicarb.● Fungicides (Tables 11, 31)The proportion of the crop area treated with fungicide increased from 57% in the previous surveyto 80% in <strong>2004</strong>. Control of sclerotinia was the main reason specified for fungicide use.Boscalid, which was the most popular fungicide, applied to 3,747 hectares, had not been availablein 2002. Metconazole, which had been the main fungicide in 2002, was not encountered at all inthe present survey.● Herbicides and growth regulators (Tables 12, 32)Treatments with herbicides were significantly higher in <strong>2004</strong>, with 95% of the crop area treatedcompared with only 41% in the previous survey. Annual broad-leaved weed control was the mostcommon reason specified for their use.Metazachlor, applied to 4,216 hectares, and glyphosate, to 3,135 hectares, predominantly for preharvestdesiccation, were the most commonly used herbicides.10
Q SEED POTATOESCompared with the previous survey, the area grown declined by 13% to 12,022 hectares in <strong>2004</strong>.● Seed treatments (Table 13)Nearly all (97%) the seed was treated, compared with 91% in 2002.Imazalil and pencycuron, both alone and in formulation together, were the most commonly usedtreatments.● Insecticides and molluscicides (Tables 14, 34)Eighty-eight percent of the crop area was treated with insecticide, slightly lower than the 91%reported in 2002.Pirimicarb was again the principal insecticide employed, and in <strong>2004</strong> was applied to28,830 hectares, for the control of aphids. Lambda-cyhalothrin was also widely used(22,610 hectares), although usage of deltamethrin declined since the previous survey.The proportion of the crop area treated with molluscicides was 26%, slightly lower than the 30%recorded in 2002. Methiocarb, applied to 4,132 hectares, remained the most widely usedmolluscicide.● Fungicides (Tables 15, 35)The entire crop was treated with fungicide, as has been the case in the previous three surveyreports.Mancozeb, applied to 51,586 hectares and accounting for 32% of the total area of fungicide activeingredients, remained the principal fungicide on this crop for blight control. Cymoxanil, appliedto 43,066 hectares, and fluazinam, to 19,556 hectares, were again widely used.● Herbicides (Tables 16, 36)In <strong>2004</strong>, the entire crop was treated with herbicides, compared with 95% in the previous survey.Paraquat, applied to 11,652 hectares, and linuron, to 9,611 hectares, remained the main treatmentsfor weed control. As in the previous survey, diquat was also widely used for both weed controland as a pre-harvest desiccant. Sulphuric acid remained the most commonly used desiccant, andwas applied to a total of 17,678 hectares.11
Q EARLY POTATOESThe area grown in <strong>2004</strong> was 941 hectares, similar to that in the previous survey. Only a few cropswere encountered in this survey, and detailed pesticide usage data are presented in all the relevanttables.Q WARE POTATOESCompared with the previous survey, the area in <strong>2004</strong> increased by 6% to 16,389 hectares.●Seed treatments (Table 13)Eighty-six percent of seed was treated, a similar figure to that recorded in 2002.Imazalil and pencycuron, both alone and in formulation together, were the most commonly usedtreatments.● Insecticides and molluscicides (Tables 14, 34)The proportion of the crop area treated with insecticide was 60%, slightly higher than in 2002.Lambda-cyhalothrin, applied to 8,519 hectares, replaced pirimicarb (7,865 hectares) as the mostcommonly used insecticide for aphid control.In <strong>2004</strong>, 65% of the crop area was treated with molluscicides, compared with only 44% in theprevious survey. Metaldehyde, applied to 25,019 hectares, replaced methiocarb as the mostpopular molluscicide.● Fungicides (Tables 15, 35)Almost the entire crop was treated with fungicide, compared with 98% in the previous survey.As in 2002, mancozeb and cymoxanil, applied to 80,508 and 73,234 hectares respectively, werethe most commonly used fungicides for blight control.● Herbicides and growth regulators (Tables 16, 36)As in all recent surveys, nearly all the crop area was treated with a herbicide. Diquat, applied to18,233 hectares, mainly for weed control and, to a lesser extent, as a pre-harvest desiccant,replaced paraquat, applied to 15,759 hectares, as the principal herbicide. Linuron(10,394 hectares) was again widely used. Sulphuric acid, applied to a total 21,100 hectares,remained the most popular desiccant.No growth regulator usage was recorded in <strong>2004</strong>. In the previous survey, small areas had beentreated with maleic hydrazide.12
Q LEGUMESIn <strong>2004</strong>, significant numbers of crops of peas, beans and lupins were encountered, and detailedpesticide usage data of these crops are published in the all the relevant tables and described below.● Peas for combining (Tables17-20, 37-40)In <strong>2004</strong>, the area grown was 1,586 hectares, a 9% increase compared with the previous survey.Just over half the seed was treated. Thiram, applied to 539 hectares remained the main treatment.Only 29% of the crop area was treated with the insecticide, lambda-cyhalothrin, for aphid control.In the previous survey, no insecticides had been recorded.Just over half the crop area received a fungicide compared with only 12% in 2002. Chlorothalonilwas the most commonly used fungicide, applied to 460 hectares, for control of Botrytis.The proportion of the crop area treated with a herbicide was 64%, markedly higher than the 28%recorded in 2002. The formulation comprising terbuthylazine/terbutryn, applied to 607 hectares,mainly for the control of annual broad-leaved weeds, was by far the most popular treatment in thepresent survey.● Field beans (Tables17-20, 37-40)The area grown in <strong>2004</strong> was 2,802 hectares, an increase of 32% since the previous survey.Twenty-four percent of the seed was treated, and the only specified formulation was thiram. In2002, all seed had been untreated.In <strong>2004</strong>, 53% of the crop area was treated with insecticide, slightly higher than in the previoussurvey, and the only reasons specified were for the control of aphids and weevils.Lambda-cyhalothrin, applied to 748 hectares, replaced cypermethrin as the main insecticide.Eighty-five percent of the crop area was treated with fungicide, higher than the 73% recorded in2002. Control of mildew and chocolate spot were the most commonly cited reasons for use offungicides. Chlorothalonil, applied to 3,502 hectares, remained the most popular fungicide.The proportion of crop area treated with herbicide in <strong>2004</strong> was 89%, lower than in the previoussurvey, when 97% had been treated. Simazine, applied to 1,511 hectares, mainly for annualbroadleaved weed control, replaced pendimethalin as the principal herbicide.● Lupins (Tables17-20, 37-40)In <strong>2004</strong>, 691 hectares were grown. Lupins had neither been listed separately in the Agricultural Census in 2002 nor encountered in the survey for that year. Just under half the seed was treated, mostly with thiram. No insecticides were encountered in <strong>2004</strong>. Fungicides were applied to only 13% of the crop area, with only the formulation comprising chlorothalonil/metalaxyl-M, for Botrytis control, and sulphur recorded. The entire crop area received a herbicide. The formulation comprising terbuthylazine/terbutryn, applied to 633 hectares, was by far the most commonly used treatment. 13
Q MINOR CROPS● TriticaleThe areas of these crops are recorded in the Agricultural Census, but the areas grown areconsidered too small to warrant inclusion of data in the tables. Estimates of pesticide usage of allthe active ingredients applied are used to calculate the Survey's principal active ingredients(Tables 45 & 46).Pesticides recorded for each crop are provided below.The area in <strong>2004</strong> was 1,284 hectares, similar to that in 2002. Fungicides : epoxiconazole/fenpropimorph/kresoxim-methyl. HerbicidesGrowth regulators: diflufenican/trifluralin, fluroxypyr, glyphosate, metsulfuron-methyl. : 2-chloroethylphosphonic acid/mepiquat chloride, chlormequat, trinexapac-ethyl.● LinseedThe area grown in <strong>2004</strong> was 638 hectares, a 26% decline compared with the previous survey.As in 2002, no seed or field treatments were recorded.14
Q SET ASIDE LANDThe total area in <strong>2004</strong> was 68,386 hectares, a fall of 20% compared with the previous survey.● Natural regeneration (Tables 21-24, 41-44)The estimated area of set aside natural regeneration was 30,338 hectares, a 36% decreasecompared with 2002.No molluscicides were encountered in <strong>2004</strong>. In the previous survey, small areas had been treatedwith methiocarb.Herbicides were the only pesticides encountered, and were applied to 24% of the area, a similarfigure to that recorded in 2002. As in the previous survey, by far the most common herbicide wasglyphosate, applied to 7,771 hectares.● Grass (Tables 21-24, 41-44)The area of grass was estimated to be 33,399 hectares, a 4% increase compared with 2002.Only 1% of the area was treated compared with 5% in 2002. Glyphosate, applied to 185 hectares,replaced MCPA, applied to 153 hectares, as the main herbicide.● Industrial oilseed rape (Tables 21-24, 41-44)It was estimated that only 3,331 hectares were grown in <strong>2004</strong>, compared with 4,031 hectares inthe previous survey.All seed was treated. Iprodione replaced thiram as the most popular treatment.The proportion of the crop area treated with insecticide was 66%, slightly higher than in 2002.Deltamethrin, applied to 1,258 hectares, replaced lambda-cyhalothrin, as the most widely usedinsecticide. Small areas were treated with molluscicides: metaldehyde on 209 hectares, andmethiocarb on 55 hectares.Eighty-five percent of the crop area was treated with fungicides, significantly higher than the 62%recorded in the previous survey. Flusilazole, applied to 3,721 hectares, replaced carbendazim(2,468 hectares) as the principal fungicide.The proportion of the crop area treated with herbicide was 89%, compared with 78% in 2002.Metazachlor, applied to 2,268 hectares replaced glyphosate as the most widely used herbicide.● Other crops (Tables 21-24, 41-44)The total area of these crops was estimated to be 1,318 hectares, a 43% fall compared with 2002.Cover crops accounted for 570 hectares, crambe (Abyssinian mustard) for 504 hectares, andwoodland, 245 hectares.As in 2002, no pesticides were encountered on either the cover crops or woodland. Theinsecticide deltamethrin, fungicide carbendazim, and herbicides metazachlor and trifluralin wereall recorded on crambe.15
Q COMPARISON WITH PREVIOUS SURVEYS● Cereals (Table 47)The total area of cereals in <strong>2004</strong> was 440,963 hectares, slightly less than that reported in theprevious survey.The total area treated with all pesticide active ingredients increased by 12% and their weights by24%, due mainly to corresponding increases recorded in fungicides.The total area treated with insecticide active ingredients fell slightly compared with 2002, but thetotal weight applied increased by 9%, due mainly to a 16% increase in organophosphates, whichare applied at relatively high dosage rates. Pyrethroids remained by far the most widely usedinsecticide type, whilst lambda-cyhalothrin replaced cypermethrin as the most popular activeingredient. Molluscicide usage, measured by both area treated and their weights fell to about onesixth of the levels recorded in 2002. This decline is most certainly due to the very dry autumn in2003 and the consequent reduction in use on winter cereals, in particular winter wheat.Of all the pesticide types, fungicides displayed the largest increase in usage, with the area ofactive ingredients increasing by 21% and their weight by 42%. Chlorothalonil replacedfenpropimorph as the principal fungicide on cereals. Fenpropimorph has for many years been themost popular fungicide, and the considerable increase in usage of chlorothalonil, which is appliedat relatively high dosage rates, accounts in the main for the higher weight of fungicides. Theincreased usage of chlorothalonil in wheat was a consequence to strobilurin resistance in Septoriatritici, and for protection against Ramularia collo cygni and Rhynchosporium secalis in barley(Pers. Comm. Oxley,S).Usage of herbicides also increased, areas of active ingredients by 7% and their weight by 21%.This discrepancy is due mainly to increased usage of certain herbicides such as isoproturon,glyphosate, mecoprop-P and pendimethalin, all of which are applied at relatively high dosagerates. Mecoprop-P remained the most widely used herbicide. Growth regulator usage increasedby around 8%, and chlormequat remained the most popular active ingredient.The total area of seed treatment active ingredients increased slightly, by 3%, whilst their weightdeclined by 31%. This divergence is due mainly to the decreased usage of guazatine which isapplied at relatively high dosage rates.● Oilseed rape (Table 48)The area of oilseed rape increased by 27% compared with 2002.The area treated with all pesticides increased by 52% when measured by area of activeingredients, and by 62% when measured by weight.The total area treated with insecticide active ingredients increased by 17% compared with 2002,although, when the increase in area grown is taken into account, overall usage fell. Despite theincrease in crop area, the total weight of insecticide active ingredients also fell, by 12%. Thisapparent discrepancy is due mainly to the fact that neither the organophosphate dimethoate (whichwas recorded in 2002 despite having no approval) nor nicotine, both of which are applied atrelatively high dosage rates, were encountered in <strong>2004</strong>. Lambda-cyhalothrin remained the mostpopular insecticide. Compared with the previous survey, molluscicide use fell by more than a halfdue to the much reduced use on winter oilseed rape in the dry autumn of 2003.16
Fungicide usage increased by 47% when measured by the area of active ingredients, due toincreased frequency of usage on winter varieties, and, to a lesser extent, by increased usage onspring oilseed rape. Total weight increased by 85%, due mainly to the increased use of sulphurwhich is applied predominantly as a foliar feed at disproportionately high dosage rates.Flusilazole replaced carbendazim as the most widely used fungicide.Total herbicide usage increased by 32% when measured by area of active ingredients, slightlyhigher than the increase in area grown. Weights increased by slightly more, 42%, due mainly toincreased usage of metazachlor, applied at relatively high dosage rates.Considerable increases in seed treatments were recorded, particularly in area treated, due tooverall increased usage in conjunction with a larger number of active ingredients applied.● Potatoes (Table 49)The total area of potatoes in <strong>2004</strong> was 29,352 hectares, a 3% fall compared with the previoussurvey.The total area of all pesticides fell slightly, in line with the drop in area grown, whilst the totalweight declined by 14%.Insecticide usage declined by 14% when measured by area of active ingredients, due to reductionof treatments applied to the ware crop. Weights fell by 20%, due mainly to the decrease in usageof the carbamate insecticides, which are applied at a relatively high dosage rates. Pirimicarbremained the most widely used insecticide. Molluscicide usage, applied predominantly to theware crop, increased by 60% when measured by the area of active ingredients, whilst the weightmore than doubled.The total area treated with fungicide active ingredients fell in line with the decline in area grown.Weight declined by 14%, due mainly to decreased usage of mancozeb and sulphur, both of whichare applied at relatively high dosage rates. Mancozeb remained the principal fungicide onpotatoes.Overall use of herbicides and desiccants fell in line with the drop in area grown, although the totalweight applied fell more noticeably by 14%, due largely to the decrease in use of the desiccant,sulphuric acid. When data relating to sulphuric acid is discounted, both the area and weightsapplied rose slightly. Paraquat remained the most widely used herbicide.● Set aside (Table 50)The total area in <strong>2004</strong> was 68,142 hectares, a 20% fall compared with the previous survey. It wasestimated that grass made up almost half set aside land, and replaced natural regeneration as thelargest category.The area treated with insecticide active ingredients, applied exclusively to industrial oilseed rape,increased by 49%, and by 73% in weight, compared with the previous survey. Deltamethrinreplaced lambda-cyhalothrin as the most popular insecticide.Usage of fungicides, applied almost solely to oilseed rape, roughly doubled compared with theprevious survey. Flusilazole was the principal fungicide active ingredient.When measured by the area treated with active ingredients, herbicide use declined by 32%,slightly more than the fall in area of set aside land. Usage on both natural regeneration and grassfell, although it increased on oilseed rape. Reduced usage of glyphosate, mainly applied to naturalregeneration and oilseed rape at relatively high dosage rates, partly explains the larger, 39%, fallin total weight of herbicide recorded. Despite a reduction in use, glyphosate remained by far themost widely used herbicide.17
Q REFERENCES1. Chapman, P.J., Sly, J.M.A. and Cutler, J.R. 1977 Pesticide usage survey report 11, <strong>Arable</strong>Farm <strong>Crops</strong> 1974, London: MAFF.2. Steed, J.M., Sly, J.M.A., Tucker, G.G. and Cutler, J.R. 1979 Pesticide usage surveyreport 18, <strong>Arable</strong> Farm <strong>Crops</strong> 1977, London: MAFF.3. Bowen, H.M. and Wood, J. Pesticide usage survey report 45, <strong>Arable</strong> <strong>Crops</strong> 1982; DAFS,Edinburgh, 1989.4. Snowden, J.P., Bowen, H.M. and Dickson, J.M. Pesticide usage survey report 77, <strong>Arable</strong><strong>Crops</strong> 1988; SOAFD, Edinburgh 1990.5. Snowden, J.P., Bowen, H.M. and Dickson, J.M. Pesticide usage survey report 87, <strong>Arable</strong><strong>Crops</strong> 1990; SOAFD, Edinburgh 1991.6. Snowden, J.P., Bowen, H.M. and Dickson, J.M. Pesticide usage survey report 74,Potatoes 1987; DAFS, Edinburgh 1990.7. Bowen, H.M., Snowden, J.P. and Thomas, L.A. Pesticide usage report, <strong>Arable</strong> <strong>Crops</strong>1992; SOAFD, Edinburgh 1993.8. Snowden, J.P. and Thomas, L.A. Pesticide usage report, <strong>Arable</strong> <strong>Crops</strong> 1994;SOAEFD, Edinburgh 1995.9. Snowden, J.P. and McCreath, M. Pesticide usage report, <strong>Arable</strong> <strong>Crops</strong> 1996;SOAEFD, Edinburgh 1997.10. Snowden, J.P. and Thomas, L.A. Pesticide usage report, <strong>Arable</strong> <strong>Crops</strong> 1998;SERAD, Edinburgh 1999.11. Kerr, J and Snowden, J.P. Pesticide usage report, <strong>Arable</strong> <strong>Crops</strong> 2000; SEERAD,Edinburgh 2001.12. Snowden, J.P. and Thomas, L.A. Pesticide usage report, <strong>Arable</strong> <strong>Crops</strong> 2002; SEERAD,Edinburgh 2003.13. Agricultural Statistics, Scotland <strong>2004</strong>; HMSO, Edinburgh <strong>2004</strong>.14. Wood, H.J. An Agricultural Atlas of Scotland. George Gill and Sons, London 1931.Q ACKNOWLEDGEMENTSThe authors wish to thank all the farmers, agronomists, contractors and seed merchants whoprovided the information for this report. Thanks are also given to Dr C J Griffiths for providingeditorial assistance. In addition, the authors are particularly grateful for input from Dr S Oxley,Scottish Agricultural College, and support from Mr D Garthwaite and colleagues at CentralScience Laboratory, York, from Information Technology Section, <strong>SASA</strong>, and to Mr A Roberts ofBiomathematics & Statistics Scotland.18
● FIGURE 1 Land-Use Regions of Scotland19
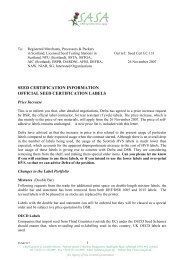
● FIGURE 2 Percentage areas of arable crops grownBarley54%Wheat17%Set aside12%Oilseed rape7%Other Oats1% 4%Potatoes5%● FIGURE 3 Estimated percentage areas of set asideNaturalregeneration44%Grass49%Other2%Industrialrape5%20
● FIGURE 4 Distribution of pesticide types on cropsTreated area of active ingredientsWinter cerealsInsecticideMolluscicideG. reg.2%
● FIGURE 5 Percentage of areas of crops treated with insecticidePercentage crop treated1009080706050403020100Winter Spring Winter Spring Winter Spring Winter Spring Ware Seedbarley barley wheat wheat oats oats rape rape potatoes potatoes● FIGURE 6 Percentage of areas of crops treated with fungicidePercentage crop treated1009080706050403020100Winter Spring Winter Spring Winter Spring Winter Spring Ware Seedbarley barley wheat wheat oats oats rape rape potatoes potatoes● FIGURE 7 Percentage of areas of crops treated with herbicidePercentage crop treated1009080706050403020100Winter Spring Winter Spring Winter Spring Winter Spring Ware Seedbarley barley wheat wheat oats oats rape rape potatoes potatoes22
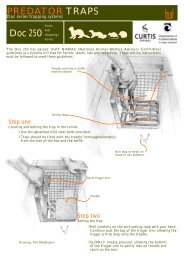
● FIGURE 8 Trends in main insecticide types 1992 - <strong>2004</strong>Area treated with active ingredientsCereals60,000Area treated (ha )50,00040,00030,00020,00010,000OrganophosphatePyrethroidCarbamate01992 1994 1996 1998 2000 2002 <strong>2004</strong>Oilseed rape50,000Area treated (ha )40,00030,00020,00010,000OrganophosphatePyrethroidCarbamate01992 1994 1996 1998 2000 2002 <strong>2004</strong>PotatoesArea treated (ha )80,00070,00060,00050,00040,00030,00020,00010,00001992 1994 1996 1998 2000 2002 <strong>2004</strong>OrganophosphatePyrethroidCarbamate23
24● TABLE 1 Regional distribution of arable crops in <strong>2004</strong> (hectares)Highlands &Islands andCaithness &OrkneyMorayFirthAberdeen Angus EastFifeLothianCentralLowlandsTweedValleyS. Uplands& SolwayWinter barley 674 3,418 19,851 8,562 4,474 3,356 5,429 6,422 4,524 56,709 61,234 -7Spring barley 12,728 33,770 68,351 44,614 15,568 17,637 33,085 19,542 14,035 259,329 263,914 -2Wheat 261 6,487 7,870 21,523 14,126 17,039 9,582 21,537 3,250 101,674 97,192 5Winter oats 81 391 542 930 845 253 1,355 1,500 255 6,152 5,430 13Spring oats 2,373 2,457 3,215 2,675 623 189 2,276 1,572 436 15,814 16,477 -4Triticale 261 101 66 * * 174 182 430 1,284 1,265 1Winter oilseed rape 76 2,508 10,231 8,613 3,016 2,652 1,676 4,844 552 34,167 26,433 29Spring oilseed rape 136 550 1,293 932 472 301 600 748 146 5,178 4,469 16Seed potatoes 124 1,359 1,943 6,077 685 172 1,111 461 92 12,022 13,787 -13Early potatoes 33 72 40 186 142 37 274 35 123 941 951 -1Ware potatoes 333 802 951 6,431 2,346 1,831 1,838 1,663 194 16,389 15,465 6Combine peas * 167 170 501 85 215 190 216 * 1,586 1,451 9Field beans * 31 314 447 269 315 1,359 68 2,802 2,116 32Linseed * 161 137 105 * 22 72 81 * 638 861 -26Lupins 39 176 97 101 25 39 107 61 47 691 0 NASet-aside 1,863 9,200 16,697 11,298 5,339 5,064 8,003 8,369 2,554 68,386 85,580 -20To prevent disclosure of information about individual holdings, entries relating to fewer than 5 holdings have been replaced by a *Scotland<strong>2004</strong>Scotland2002%change
● TABLE 2 Distribution of sampleSize (ha)Highland &Islands andCaithness &OrkneyMorayFirthAberdeen Angus EastFifeLothianCentralLowlandsTweedValleyS. Uplands& Solway0.1-19.9 11 3 6 2 0 1 4 0 3 3020-49.9 4 8 16 8 3 1 9 2 6 5750-99.9 2 9 20 18 8 6 11 5 5 84100-149.9 0 7 11 13 6 7 5 8 1 58150+ 0 10 17 23 8 12 6 18 2 96All sizes 17 37 70 64 25 27 35 33 17 325Scotland<strong>2004</strong>25
26● TABLE 3 Proportion (%) of each crop treated with pesticides (cereals)WinterbarleySpringbarleyWinterwheatSpringwheatWinteroatsSpringoatsTriticaleInsecticides 26 3 35 10 31 3 0Molluscicides 1 + 5 0 1 0 0Fungicides 98 88 98 85 96 61 19Herbicides 100 98 96 85 100 91 88Growth regulators 90 13 95 70 88 49 88Any pesticide 100 98 99 85 100 91 88‘+’ =
● TABLE 5 Cereal seed treatment formulationsArea (ha) and percentage of crop treatedSeed treatments Winter barley Spring barley Winter wheat Spring wheat Winter oats Spring oats *Allcereals*2002(ha) (%) (ha) (%) (ha) (%) (ha) (%) (ha) (%) (ha) (%) (ha) (ha)Bitertanol/fuberidazole 0 0 0 0 36,824 37 102 4 1,043 17 4,811 30 42,868 39,572Bitertanol/fuberidazole/imidacloprid 0 0 0 0 2,541 3 0 0 0 0 0 0 2,544 1,793Carboxin/thiram 1,215 2 6,779 3 5,002 5 271 11 1,038 17 1,903 12 16,257 16,550Fludioxonil 2,831 5 29,725 11 18,712 19 808 32 1,862 30 2,168 14 56,218 27,048Fluquinconazole/prochloraz 0 0 0 0 5,683 6 0 0 0 0 0 0 5,689 5,556Fuberidazole/imidacloprid/triadmenol 0 0 0 0 906 1 0 0 0 0 0 0 907 0Fuberidazole/triadimenol 530 1 8,301 3 3,564 4 0 0 317 5 436 3 13,164 10,249Guazatine 82 + 7,417 3 8,293 8 0 0 443 7 2,312 15 18,581 78,729Guazatine/triticonazole 0 0 0 0 5,924 6 451 18 0 0 0 0 6,399 5,375Imazalil/triticonazole 1,736 3 14,586 6 469 + 0 0 0 0 0 0 16,800 4,950Imidacloprid/tebuconazole/triazoxide 2,809 5 0 0 0 0 0 0 0 0 0 0 2,814 0Prochloraz/triticonazole 181 + 185 + 744 1 0 0 0 0 0 0 1,111 0Silthiofam 0 0 0 0 1,410 1 0 0 0 0 0 0 1,412 0Tebuconazole/triazoxide 40,544 71 174,834 67 0 0 0 0 0 0 128 1 215,645 204,243Tefluthrin 0 0 0 0 1,155 1 0 0 0 0 0 0 1,156 1,114Unspecified seed treatment 882 2 4,231 2 2,919 3 260 10 491 8 1,935 12 10,754 3,889Area grown 56,709 90 259,329 94 99,140 94 2,535 75 6,152 84 15,814 87 440,963 445,512‘*’ includes triticale, ‘+’ =
28● TABLE 6 Cereals insecticide and molluscicide formulationsArea treated (ha) and percentage of crop treatedInsecticides Winter barley Spring barley Winter wheat Spring wheat Winter oats Spring oats *Allcereals*2002(ha) (%) (ha) (%) (ha) (%) (ha) (%) (ha) (%) (ha) (%) (ha) (ha)Alpha-cypermethrin 741 1 1,310 1 1,159 1 0 0 0 0 0 0 3,210 5,299Chlorpyrifos 0 0 5,088 2 1,520 2 0 0 0 0 331 2 6,938 7,581Cypermethrin 4,271 7 680 + 9,438 9 0 0 1,283 21 0 0 15,671 20,478Deltamethrin 1,846 3 0 0 1,570 2 260 10 0 0 0 0 3,675 5,123Dimethoate 0 0 0 0 2,479 3 0 0 0 0 0 0 2,479 549Lambda-cyhalothrin 5,439 10 0 0 15,221 15 0 0 822 10 154 1 21,635 6,932Pirimicarb 0 0 0 0 2,200 2 0 0 0 0 0 0 2,200 5,430Tau-fluvalinate 1,855 3 1,331 1 3,086 3 0 0 0 0 0 0 6,271 0Zeta-cypermethrin 641 1 0 0 3,071 3 0 0 0 0 0 0 3,712 4,164All insecticides 14,792 26 8,409 3 39,742 35 260 10 2,104 31 485 3 65,792 67,368MolluscicidesMetaldehyde 207 + 0 0 3,447 3 0 0 0 0 0 0 3,654 18,980Methiocarb 260 + 0 0 1,078 1 0 0 61 1 0 0 1,399 9,177Thiodicarb 260 + 167 + 668 1 0 0 0 0 0 0 1,096 7,108All molluscicides 728 1 167 + 5,193 5 0 0 61 1 0 0 6,149 35,265Area grown 56,709 259,329 99,140 2,535 6,152 15,814 440,963 445,512‘*’ includes triticale, ‘+’ =
● TABLE 7 Cereals fungicide formulationsArea treated (ha) and percentage of crop treatedFungicidesWinter barley Spring barley Winter wheat Spring wheat Winter oats Spring oats *Allcereals(ha) (%) (ha) (%) (ha) (%) (ha) (%) (ha) (%) (ha) (%) (ha) (ha)Azoxystrobin 10,421 18 28,926 11 24,764 23 711 28 771 13 2,204 14 67,796 96,206Azoxystrobin/chlorothalonil 980 2 5,315 2 10,538 10 0 0 0 0 0 0 16,833 0Azoxystrobin/cyproconazole 323 1 1,359 1 1,301 1 0 0 0 0 0 0 2,982 0Azoxystrobin/fenpropimorph 6,088 10 20,872 8 4,030 4 0 0 0 0 0 0 30,989 39,021Azoxystrobin/flutriafol 0 0 0 0 395 + 0 0 0 0 0 0 395 0Bromuconazole 0 0 2,304 1 931 1 0 0 0 0 0 0 3,235 8,096Carbendazim 1,465 3 8,543 3 4,593 5 102 4 0 0 0 0 14,704 4,952Carbendazim/flusilazole 2,268 4 9,749 3 2,022 1 0 0 0 0 0 0 14,039 20,812Chlorothalonil 44,590 55 153,096 48 151,096 85 2,595 85 0 0 622 4 351,998 14,495Chlorothalonil/cyproconazole 56 + 5,597 2 10,779 8 0 0 0 0 0 0 16,432 8,092Chlorothalonil/flutriafol 0 0 0 0 5,400 5 0 0 0 0 0 0 5,400 786Chlorothalonil/mancozeb 0 0 0 0 1,462 1 0 0 0 0 0 0 1,462 730Chlorothalonil/tetraconazole 0 0 0 0 418 + 0 0 0 0 0 0 418 0Cyproconazole 0 0 0 0 2,540 3 0 0 0 0 56 + 2,597 2,207Cyproconazole/cyprodinil 3,525 6 14,736 6 8,499 9 0 0 0 0 0 0 26,760 32,083Cyproconazole/prochloraz 0 0 0 0 1,505 2 0 0 0 0 0 0 1,505 2,194Cyproconazole/propiconazole 178 + 2,120 1 4,024 4 0 0 0 0 0 0 6,322 3,714Cyproconazole/trifloxystrobin 734 1 5,372 2 1,903 1 0 0 0 0 0 0 8,008 14,144Cyprodinil 29,480 38 26,539 10 32,410 27 362 14 0 0 0 0 88,790 94,635Cyprodinil/picoxystrobin 9,302 16 12,233 5 0 0 0 0 0 0 0 0 21,535 0‘*’ includes triticale, ‘+’ =
30● TABLE 7 Cereals fungicide formulations continuedArea treated (ha) and percentage of crop treatedFungicidesWinter barley Spring barley Winter wheat Spring wheat Winter oats Spring oats *Allcereals(ha) (%) (ha) (%) (ha) (%) (ha) (%) (ha) (%) (ha) (%) (ha) (ha)Dimoxystrobin/epoxiconazole 0 0 0 0 20,454 20 713 28 0 0 0 0 21,166 0Epoxiconazole 10,518 13 15,866 5 68,856 51 95 4 0 0 0 0 95,336 55,536Epoxiconazole/fenpropimorph 7,401 11 30,351 9 18,412 15 102 4 827 7 966 5 58,059 37,317Epoxiconazole/fenpropimorph/kresoxim-methyl 8,354 14 26,917 9 30,307 24 0 0 753 12 618 4 67,189 49,374Epoxiconazole/kresoxim-methyl 3,702 6 14,038 4 24,194 24 1,328 52 1,792 28 1,184 7 46,238 46,382Epoxiconazole/kresoxim-methyl/pyraclostrobin 0 0 0 0 4,001 3 0 0 0 0 0 0 4,001 14,060Epoxiconazole/pyraclostrobin 2,845 3 7,563 3 6,581 7 0 0 0 0 0 0 16,990 12,040Famoxadone/flusilazole 15,702 21 57,222 19 14,810 13 0 0 0 0 501 3 88,236 67,828Fenbuconazole 0 0 1,641 + 0 0 0 0 0 0 0 0 1,641 0Fenbuconazole/propiconazole 0 0 542 + 435 + 0 0 0 0 0 0 977 2,390Fenpropidin 1,575 3 593 + 3,830 4 0 0 0 0 0 0 5,997 10,547Fenpropimorph 28,820 42 49,417 18 8,747 8 711 28 5,690 72 6,266 34 99,650 108,125Fenpropimorph/flusilazole 12,115 20 42,369 15 1,051 1 0 0 0 0 0 0 55,536 75,377Fenpropimorph/kresoxim-methyl 3,448 5 17,122 5 1,343 1 0 0 414 7 672 4 22,999 48,926Fenpropimorph/pyraclostrobin 7,770 14 38,086 14 925 1 0 0 0 0 0 0 46,780 0Fenpropimorph/quinoxyfen 1,778 2 8,280 2 674 1 0 0 436 7 80 1 11,249 12,474Fluquinconazole 0 0 0 0 15,267 14 0 0 0 0 0 0 15,267 12,245Fluquinconazole/prochloraz 1,507 3 0 0 3,088 3 0 0 0 0 0 0 4,595 5,467‘*’ includes triticale, ‘+’ =
● TABLE 7 Cereals fungicide formulations continuedArea treated (ha) and percentage of crop treatedFungicidesWinter barley Spring barley Winter wheat Spring wheat Winter oats Spring oats *All *2002cereals(ha) (%) (ha) (%) (ha) (%) (ha) (%) (ha) (%) (ha) (%) (ha) (ha)Flusilazole 3,186 5 19,692 7 0 0 0 0 0 0 501 3 23,378 34,848Flutriafol 0 0 0 0 3,778 4 0 0 0 0 0 0 3,778 0Mancozeb 119 + 1,105 + 7,372 7 0 0 0 0 576 4 9,172 1,984Maneb 0 0 0 0 3,963 3 0 0 0 0 0 0 3,963 1,710Metconazole 2,650 4 6,466 2 10,405 9 0 0 0 0 0 0 19,522 28,211Metrafenone 289 1 15,009 5 28,339 24 271 11 0 0 0 0 43,907 0Picoxystrobin 12,871 19 13,709 5 0 0 0 0 381 6 284 2 27,245 49,005Prochloraz 2,420 4 731 + 6,423 6 0 0 0 0 0 0 9,575 4,016Prochloraz/propiconazole 3,525 5 2,858 1 3,020 3 0 0 0 0 0 0 9,403 15,123Prochloraz/tebuconazole 0 0 0 0 4,463 4 0 0 0 0 0 0 4,463 5,601Propiconazole 980 2 1,302 1 331 + 0 0 0 0 0 0 2,613 1,437Propiconazole/tebuconazole 185 + 1,292 + 3,468 3 271 11 0 0 0 0 5,216 8,210Propiconazole/trifloxystrobin 0 0 2,732 1 1,739 2 0 0 0 0 0 0 4,471 0Pyraclostrobin 2,239 3 1,255 + 2,856 3 0 0 0 0 162 1 6,512 59,354Quinoxyfen 2,518 2 10,215 4 12,320 9 0 0 1,659 27 5,383 32 32,094 43,544Spiroxamine 6,723 10 20,725 7 9,552 9 0 0 0 0 0 0 37,000 58,247Spiroxamine/tebuconazole 0 0 0 0 4,507 5 790 21 0 0 0 0 5,297 2,835Sulphur 2,234 3 6,451 2 14,560 11 345 14 0 0 891 6 24,481 42,924Tebuconazole 0 0 0 0 25,156 25 543 21 361 6 154 1 26,214 20,871Tebuconazole/triadimenol 851 2 4,448 2 11,316 11 0 0 411 7 0 0 17,026 16,581Trifloxystrobin 14,891 24 22,338 9 21,414 21 0 0 0 0 501 3 59,143 76,128Unspecified fungicides 0 0 0 0 771 1 0 0 0 0 0 0 771 1,117All fungicides 270,622 98 737,097 88 667,338 98 8,938 85 13,494 96 21,622 61 1,719,351 1,393,453Area grown 56,709 259,329 99,140 2,535 6,152 15,814 440,963 445,512‘*’ includes triticale, ‘+’ =
32● TABLE 8 Cereals herbicide and growth regulator formulationsArea treated (ha) and percentage of crop treatedHerbicidesWinter barley Spring barley Winter wheat Spring wheat Winter oats Spring oats *Allcereals(ha) % (ha) % (ha) % (ha) % (ha) % (ha) % (ha) (ha)2,4-DB/benazolin/MCPA 0 0 636 + 0 0 0 0 0 0 0 0 636 8,8222,4-DB/linuron/MCPA 0 0 2,623 1 0 0 0 0 0 0 245 2 2,868 2,036Amidosulfuron 0 0 2,416 1 964 1 0 0 532 9 0 0 3,911 0Amidosulfuron/iodosulfuron-methyl-sodium 0 0 1,379 1 0 0 0 0 0 0 0 0 1,379 4,990Benazolin/bromoxynil/ioxynil 0 0 314 + 0 0 0 0 0 0 0 0 314 14,188Bentazone/MCPA/MCPB 0 0 1,515 1 0 0 0 0 0 0 0 0 1,515 1,391Bromoxynil 0 0 4,842 2 0 0 0 0 0 0 47 + 4,890 591Bromoxynil/diflufenican/ioxynil 82 + 526 + 0 0 0 0 0 0 0 0 608 1,923Bromoxynil/fluroxypyr/ioxynil 0 0 2,564 1 0 0 0 0 0 0 0 0 2,564 2,234Bromoxynil/ioxynil 515 1 28,594 11 2,151 2 102 4 532 9 2,121 13 34,015 46,863Bromoxynil/ioxynil/mecoprop-P 0 0 13,057 5 107 + 0 0 0 0 0 0 13,164 116Bromoxynil/ioxynil/triasulfuron 438 1 0 0 0 0 0 0 0 0 0 0 438 3,574Carfentrazone-ethyl 0 0 0 0 0 0 260 10 0 0 0 0 260 0Carfentrazone-ethyl/flupyrsulfuron- methyl 0 0 0 0 522 1 0 0 2,541 41 0 0 3,063 1,185Carfentrazone-ethyl/metsulfuron-methyl 0 0 0 0 0 0 0 0 0 0 56 + 56 71Chlorotoluron 0 0 0 0 1,786 2 0 0 0 0 0 0 1,786 0Chlorotoluron/isoproturon 2,385 4 0 0 2,417 2 0 0 0 0 0 0 4,802 0Clodinafop-propargyl 0 0 0 0 2,859 3 0 0 0 0 0 0 2,859 2,834‘*’ includes triticale, ‘+’ =
● TABLE 8 Cereals herbicide and growth regulator formulations continuedArea treated (ha) and percentage of crop treatedHerbicidesWinter barley Spring barley Winter wheat Spring wheat Winter oats Spring oats *Allcereals(ha) % (ha) % (ha) % (ha) % (ha) % (ha) % (ha) (ha)Dicamba/MCPA/mecoprop-P 0 0 4,008 2 0 0 0 0 0 0 436 3 4,443 5,351Dicamba/mecoprop-P 177 + 28,540 11 1,149 1 271 11 269 4 2,720 17 33,126 32,844Dichlorprop-P/MCPA/mecoprop-P 0 0 0 0 117 + 0 0 0 0 0 0 117 793Diclofop-methyl/fenoxaprop-P-ethyl 233 + 479 + 0 0 0 0 0 0 0 0 712 1,001Diflufenican/flurtamone 2,490 4 0 0 9,979 10 0 0 0 0 0 0 12,470 2,513Diflufenican/flurtamone/isoproturon 4,179 7 0 0 4,670 5 0 0 0 0 0 0 8,849 10,441Diflufenican/isoproturon 18,380 32 0 0 31,092 31 0 0 188 3 0 0 49,660 43,524Diflufenican/terbuthylazine 74 + 0 0 24 + 0 0 0 0 0 0 97 3,647Diflufenican/trifluralin 3,659 6 0 0 1,941 2 0 0 0 0 0 0 6,193 9,743Fenoxaprop-P-ethyl 0 0 0 0 4,244 4 0 0 0 0 0 0 4,244 7,068Florasulam 515 1 40 + 584 1 0 0 0 0 0 0 1,138 253Florasulam/fluroxypyr 388 1 0 0 5,427 5 0 0 0 0 189 1 6,003 110Flupyrsulfuron-methyl/thifensulfuron-methyl 0 0 0 0 0 0 0 0 878 14 0 0 878 503Flupyrsulfuron-methyl/tribenuron-methyl 0 0 0 0 0 0 0 0 414 7 0 0 414 0Fluroxypyr 1,196 2 363 + 4,314 4 0 0 362 6 101 1 6,854 15,057Fluroxypyr/metosulam 0 0 0 0 305 + 0 0 0 0 0 0 305 0Fluroxypyr/thifensulfuron-methyl/tribenuron-methyl 0 0 647 + 0 0 0 0 0 0 0 0 647 0Glyphosate** 22,937 36 56,655 21 17,960 17 271 11 1,580 24 1,009 6 **100,429 67,180‘*’ includes triticale, ‘+’ =
34● TABLE 8 Cereals herbicide and growth regulator formulations continuedArea treated (ha) and percentage of crop treatedHerbicidesWinter barley Spring barley Winter wheat Spring wheat Winter oats Spring oats *Allcereals(ha) % (ha) % (ha) % (ha) % (ha) % (ha) % (ha) (ha)Isoproturon 29,016 51 5,307 2 56,065 55 102 4 6 + 245 2 90,741 74,409Isoproturon/pendimethalin 2,060 4 0 0 4,555 5 0 0 0 0 0 0 6,615 6,038Isoproturon/simazine 4,109 7 0 0 4,744 5 0 0 0 0 0 0 8,852 1,802Linuron 0 0 1,936 1 0 0 0 0 0 0 0 0 1,936 0MCPA 690 1 22,206 9 548 1 0 0 549 9 2,498 16 26,491 21,040MCPA/MCPB 0 0 478 + 0 0 0 0 0 0 0 0 478 1,311MCPB 0 0 1,806 1 0 0 0 0 0 0 0 0 1,806 66Mecoprop-P 15,096 26 119,420 46 44,884 44 1,877 74 4,118 59 6,632 42 192,026 173,824Mecoprop-P/metsulfuron-methyl 0 0 4,366 2 0 0 0 0 0 0 247 2 4,614 0Metsulfuron-methyl 3,743 7 30,297 12 7,400 7 260 10 1,518 18 7,252 46 50,709 66,352Metsulfuron-methyl/thifensulfuron-methyl 2,249 4 129,686 50 10,605 11 1,785 70 630 10 501 3 145,456 137,017Metsulfuron-methyl/tribenuron-methyl 0 0 21,957 8 331 + 0 0 491 8 0 0 22,778 8,730Pendimethalin 8,253 15 0 0 9,921 10 0 0 6 + 0 0 18,181 9,582Pendimethalin/picolinafen 10,771 19 0 0 22,336 23 0 0 0 0 0 0 33,107 23,221Pendimethalin/simazine 690 1 0 0 906 1 0 0 0 0 0 0 1,596 2,085Propoxycarbazone-sodium 0 0 0 0 82 + 0 0 0 0 0 0 82 25Sulfosulfuron 0 0 0 0 4,927 4 0 0 0 0 0 0 4,927 800‘*’ includes triticale, ‘+’ =
● TABLE 8 Cereals herbicide and growth regulator formulations continuedArea treated (ha) and percentage of crop treatedHerbicidesWinter barley Spring barley Winter wheat Spring wheat Winter oats Spring oats *Allcereals(ha) % (ha) % (ha) % (ha) % (ha) % (ha) % (ha) (ha)Thifensulfuron-methyl 0 0 1,504 1 0 0 0 0 0 0 0 0 1,504 0Thifensulfuron-methyl/tribenuron-methyl 841 1 34,069 13 1,515 2 0 0 0 0 0 0 36,425 41,088Tralkoxydim 4,425 8 34,076 13 1,382 1 105 4 0 0 0 0 39,989 37,510Tribenuron-methyl 2,241 4 7,542 3 4,024 4 0 0 442 7 1,283 8 15,531 39,658Trifluralin 3,132 6 0 0 9,029 9 0 0 173 3 0 0 12,333 6,087Unspecified herbicides 260 0 0 0 1,093 1 0 0 0 0 0 0 1,354 960All herbicides 145,225 100 563,844 98 276,956 96 5,032 85 15,227 100 25,582 91 1,033,235 951,323Growth regulators 0 0 0 0 0 0 0 0 0 0 0 0 0 02-chloroethylphosphonic acid 14,129 25 3,597 1 10,857 11 713 28 0 0 0 0 29,296 18,7852-chloroethylphosphonic acid/chlormequat 15,311 26 0 0 16,602 17 0 0 0 0 0 0 31,913 31,8932-chloroethylphosphonic acid/chlormequat/mepiquat chloride 576 1 0 0 2,934 3 0 0 436 7 0 0 3,945 4,0012-chloroethylphosphonic acid/mepiquat chloride 10,697 19 11,120 4 6,092 6 0 0 0 0 0 0 28,149 15,051Chlormequat 44,139 67 13,480 5 104,077 80 1,073 42 5,496 82 5,012 32 173,814 157,505Chlormequat/imazaquin 0 0 0 0 21,522 18 0 0 0 0 0 0 21,522 36,542Trinexapac-ethyl 30,781 52 6,783 3 38,696 33 0 0 2,716 38 2,404 15 81,972 74,573Unspecified growth regulators 0 0 0 0 0 0 0 0 0 0 1,604 10 1,604 0All growth regulators 115,633 90 34,981 13 200,780 95 1,786 70 8,648 88 9,020 49 372,216 338,350Area grown 56,709 259,329 99,140 2,535 6,152 15,814 440,963 445,512‘*’ includes triticale, ‘+’ =
36 ● TABLE 9 Oilseed rape seed treatment formulationsArea (ha) and percentage of crop treatedSeed treatments Winter oilseed rape Spring oilseed rape All oilseedrape2002(ha) (%) (ha) (%) (ha) (ha)Beta-cyfluthrin/imidacloprid 16,188 47 2,121 41 18,309 3,679Iprodione 28,461 83 3,736 72 32,197 13,215Thiram 27,134 79 4,326 84 31,460 12,601Unspecified seed treatment 1,196 4 448 9 1,644 1,051Area grown 34,167 97 5,178 100 39,345 30,902
● TABLE 10 Oilseed rape insecticide and molluscicide formulationsArea treated (ha) formulations and percentage of crop treatedInsecticidesWinter oilseedrapeSpring oilseedrapeAll oilseedrape2002(ha) (%) (ha) (%) (ha) (ha)Alpha-cypermethrin 760 2 186 4 946 6,217Cypermethrin 5,235 11 100 2 5,335 6,739Deltamethrin 4,439 13 233 5 4,673 1,749Lambda-cyhalothrin 10,568 28 1,973 32 12,541 7,422Pymetrozine 419 1 0 0 419 0Tau-fluvalinate 2,955 9 1,024 20 3,979 0Zeta-cypermethrin 1,548 5 0 0 1,548 2,334All insecticides 25,925 60 3,516 60 29,441 25,234MolluscicidesMetaldehyde 2,347 7 0 0 2,347 6,397Methiocarb 1,358 4 0 0 1,358 3,495Thiodicarb 1,105 3 0 0 1,105 1,172All molluscicides 4,837 12 0 0 4,837 11,063Area grown 34,167 5,178 39,345 30,90237
38 ● TABLE 11 Oilseed rape fungicide formulationsArea treated (ha) and percentage of crop treatedFungicidesWinter oilseedrapeSpring oilseedrapeAll oilseedrape2002(ha) (%) (ha) (%) (ha) (ha)Boscalid 13,761 40 3,747 72 17,509 0Carbendazim 12,384 32 1,721 33 14,105 11,478Carbendazim/flusilazole 19,199 42 0 0 19,199 8,956Carbendazim/prochloraz 779 2 134 3 913 1,232Carbendazim/vinclozolin 410 1 0 0 410 7,642Chlorothalonil 1,077 3 0 0 1,077 772Chlorothalonil/metalaxyl-M 232 1 0 0 232 0Difenoconazole 1,585 5 0 0 1,585 2,453Famoxadone/flusilazole 8,910 26 1,024 20 9,934 0Flusilazole 13,795 33 106 2 13,901 4,628Iprodione/thiophanate-methyl 1,019 3 0 0 1,019 2,729Mancozeb 762 2 0 0 762 0Metconazole 9,048 23 0 0 9,048 15,523Prochloraz 8,282 16 0 0 8,282 0Prochloraz/propiconazole 743 2 0 0 743 455Prochloraz/tebuconazole 250 1 0 0 250 728Sulphur 9,688 23 751 14 10,438 6,525Tebuconazole 15,145 35 0 0 15,145 14,432Vinclozolin 5,952 17 1,721 33 7,673 9,089All fungicides 123,021 99 9,202 80 132,223 89,272Area grown 34,167 5,178 39,345 30,902
● TABLE 12 Oilseed rape herbicide and growth regulator formulationsArea treated (ha) and percentage of crop treatedHerbicidesWinter oilseedrapeSpring oilseedrapeAll oilseedrape(ha) (%) (ha) (%) (ha) (ha)Benazolin 245 1 0 0 245 300Benazolin/clopyralid 1,402 4 0 0 1,402 4,807Carbetamide 602 2 0 0 602 0Clomazone 744 2 0 0 744 0Clopyralid 284 1 148 3 432 594Clopyralid/picloram 83 + 0 0 83 0Cyanazine 548 2 0 0 548 647Cycloxydim 1,037 3 0 0 1,037 0Diquat 711 2 0 0 711 1,001Fluazifop-P-butyl 2,077 6 100 2 2,177 0Glyphosate 9,282 27 3,135 57 12,416 8,927Metazachlor 23,022 67 4,216 81 27,238 17,912Metazachlor/quinmerac 4,309 13 0 0 4,309 2,478Napropamide 77 + 0 0 77 0Propaquizafop 9,527 23 351 7 9,878 5,636Propyzamide 6,748 20 0 0 6,748 5,969Quizalofop-P-ethyl 990 3 0 0 990 163Trifluralin 577 2 475 9 1,052 1,607All herbicides 62,268 100 8,424 95 70,692 50,041Growth regulatorsChlormequat 180 1 0 0 180 36All growth regulators 180 1 0 0 180 36Area grown 34,167 5,178 39,345 30,902‘+’ =
40 ● TABLE 13 Potato seed treatment formulationsArea (ha) and percentage of crop treatedSeed treatments Seed potatoes Ware potatoes Early potatoes Allpotatoes2002(ha) (%) (ha) (%) (ha) (%) (ha) (ha)Flutolanil 789 7 0 0 0 0 789 0Imazalil 5,425 45 4,303 26 407 43 10,135 5,928Imazalil/pencycuron 4,077 34 6,985 43 535 57 11,597 13,912Iprodione 986 8 688 4 0 0 1,674 0Mancozeb 0 0 429 3 0 0 429 0Pencycuron 4,218 35 4,902 30 407 43 9,526 8,594Tolclofos-methyl 648 5 184 1 0 0 832 0Area grown 12,022 97 16,389 86 941 100 29,352 30,203
● TABLE 14 Potato insecticide and molluscicide formulationsArea treated (ha) and percentage of crop treatedInsecticides Seed potatoes Ware potatoes Early potatoes Allpotatoes2002(ha) (%) (ha) (%) (ha) (%) (ha) (ha)Aldicarb 0 0 876 5 0 0 876 1,944Cypermethrin 3,017 8 1,230 6 0 0 4,247 3,717Deltamethrin/pirimicarb 9,119 38 1,926 8 0 0 11,045 26,865Lambda-cyhalothrin 14,627 48 6,942 17 0 0 21,569 14,458Lambda-cyhalothrin/pirimicarb 7,984 28 1,578 5 0 0 9,561 6,960Oxamyl 0 0 175 1 0 0 175 0Pirimicarb 11,727 39 4,361 22 0 0 16,089 14,549Pymetrozine 7,486 43 3,980 17 0 0 11,466 9,307Zeta-cypermethrin 558 2 0 0 0 0 558 187All insecticides 54,518 88 21,068 60 0 0 75,586 78,362MolluscicidesMetaldehyde 2,321 13 25,019 39 0 0 27,339 8,666Methiocarb 4,132 17 7,155 29 0 0 11,287 14,118Thiodicarb 2,332 3 7,683 17 0 0 10,015 7,762Unspecified molluscicides 166 1 0 0 0 0 166 0All molluscicides 8,951 26 39,856 65 0 0 48,807 30,546Area grown 12,022 16,389 941 29,352 30,20341
42● TABLE 15 Potato fungicide formulationsArea treated (ha) and percentage of crop treatedFungicides Seed potatoes Ware potatoes Early potatoes Allpotatoes2002(ha) (%) (ha) (%) (ha) (%) (ha) (ha)Azoxystrobin 0 0 1,362 8 0 0 1,362 0Benalaxyl/mancozeb 4,360 25 6,132 21 0 0 10,492 20,315Chlorothalonil 101 1 384 2 0 0 486 375Chlorothalonil/propamocarb hydrochloride 3,992 25 4,198 14 0 0 8,190 6,508Cyazofamid 8,119 37 16,350 50 0 0 24,468 9,720Cymoxanil 14,206 35 23,374 50 407 43 37,987 9,818Cymoxanil/famoxadone 2,711 15 7,136 23 0 0 9,847 7,278Cymoxanil/mancozeb 29,995 75 43,848 81 0 0 73,844 77,452Dimethomorph/mancozeb 6,800 40 10,285 29 0 0 17,085 11,412Fenamidone/mancozeb 1,761 8 0 0 0 0 1,761 0Fenamidone/propamocarb hydrochloride 1,165 8 3,568 8 0 0 4,733 0Fluazinam 15,754 59 30,395 74 813 43 46,963 32,799Fluazinam/metalaxyl-M 3,801 21 4,357 15 1,348 100 9,506 0Mancozeb 1,574 8 10,957 21 535 57 13,066 9,081Mancozeb/metalaxyl 0 0 110 1 0 0 110 66Mancozeb/metalaxyl-M 3,209 19 4,876 24 0 0 8,085 9,267Cont…
● TABLE 15 Potato fungicide formulations continuedArea treated (ha) and percentage of crop treatedFungicides Seed potatoes Ware potatoes Early potatoes Allpotatoes2002(ha) (%) (ha) (%) (ha) (%) (ha) (ha)Mancozeb/ofurace 225 2 0 0 0 0 225 1,560Mancozeb/propamocarb hydrochloride 806 3 0 0 0 0 806 0Mancozeb/zoxamide 3,586 23 5,743 24 535 57 9,864 10,617Maneb 233 2 0 0 0 0 233 3Sulphur 0 0 1,258 8 0 0 1,258 6,800Zineb-ethylenethiuram disulphide 585 3 0 0 0 0 585 0All fungicides 102,984 100 174,333 100 3,637 100 280,954 268,617Area grown 12,022 16,389 941 29,352 30,20343
44● TABLE 16 Potato herbicide and growth regulator formulationsArea treated (ha) and percentage of crop treatedHerbicides Seed potatoes Ware potatoes Early potatoes Allpotatoes2002(ha) (%) (ha) (%) (ha) (%) (ha) (ha)Carfentrazone-ethyl 146 1 827 5 535 57 1,508 469Cycloxydim 56 + 0 0 0 0 56 0Diquat 2,782 15 4,697 25 813 43 8,292 8,489Diquat/paraquat 5,268 44 13,535 83 0 0 18,803 17,727Flufenacet/metribuzin 225 2 0 0 0 0 225 0Linuron 9,611 80 10,394 63 941 100 20,947 19,892Metribuzin 2,418 20 6,098 37 0 0 8,516 5,402Paraquat 6,384 53 2,224 14 941 100 9,550 11,346Pendimethalin 0 0 1,186 7 0 0 1,186 0Rimsulfuron 0 0 781 5 0 0 781 850Sulphuric acid 17,678 90 21,100 79 0 0 38,778 46,511All herbicides 44,569 100 60,843 100 3,231 100 108,643 113,073Area grown 12,022 16,389 941 29,352 30,203‘+’ =
● TABLE 17 Legume seed treatment formulationsArea (ha) and percentage of crop treatedSeed treatments Combine peas Field beans Lupins All 2002*(ha) (%) (ha) (%) (ha) (%) (ha) (ha)Cymoxanil/fludioxonil/metalaxyl-M 70 4 0 0 0 0 70 174Thiabendazole/thiram 0 0 0 0 31 4 31 0Thiram 539 34 564 20 301 44 1,404 179No information on seed treatments 70 4 0 0 0 0 70 52Unspecified seed treatment 190 12 97 3 0 0 288 0Area grown 1,586 55 2,802 24 691 48 5,079 3,567‘*’ lupins not encountered in 200245
46● TABLE 18 Legume insecticide formulationsArea treated (ha) and percentage of crop treatedInsecticides Combine peas Field beans Lupins All crops 2002*(ha) (%) (ha) (%) (ha) (%) (ha) (ha)Alpha-cypermethrin 0 0 131 5 0 0 131 0Cypermethrin 0 0 160 6 0 0 160 392Deltamethrin 0 0 388 14 0 0 388 0Lambda-cyhalothrin 460 29 748 27 0 0 1,208 224Pirimicarb 0 0 391 14 0 0 391 363Zeta-cypermethrin 0 0 93 3 0 0 93 0All insecticides 460 29 1,911 53 0 0 2,372 979Area grown 1,586 2,802 691 5,079 3,567‘*’ lupins not encountered in 2002
● TABLE 19 Legume fungicide formulationsArea treated (ha) and percentage of crop treatedFungicides Combine peas Field beans Lupins All crops 2002*(ha) (%) (ha) (%) (ha) (%) (ha) (ha)Azoxystrobin 216 14 831 18 0 0 1,047 179Azoxystrobin/chlorothalonil 0 0 160 6 0 0 160 0Benomyl 0 0 29 1 0 0 29 0Carbendazim 48 3 470 13 0 0 518 0Chlorothalonil 264 17 3,146 82 0 0 3,411 616Chlorothalonil/cyproconazole 412 26 262 6 87 13 761 0Chlorothalonil/metalaxyl-M 0 0 666 17 0 0 666 0Iprodione/thiophanate-methyl 175 11 0 0 0 0 175 458Sulphur 414 26 605 22 87 13 1,105 659Vinclozolin 0 0 583 21 0 0 583 0All fungicides 1,529 52 6,751 85 173 13 8,454 3,092Area grown 1,586 2,802 691 5,079 3,567‘*’ lupins not encountered in 200247
48● TABLE 20 Legume herbicide formulationsArea treated (ha) percentage of crop treatedHerbicides Combine peas Field beans Lupins All crops 2002*(ha) (%) (ha) (%) (ha) (%) (ha) (ha)Cyanazine/pendimethalin 196 12 713 25 0 0 909 0Diquat 93 6 195 7 350 51 638 571Fluazifop-P-butyl 0 0 0 0 59 8 59 0Glyphosate 0 0 892 32 173 25 1,066 224MCPA/MCPB 190 12 0 0 0 0 190 363Pendimethalin 0 0 0 0 59 8 59 1,024Propaquizafop 0 0 297 11 0 0 297 0Simazine 0 0 1,511 54 0 0 1,511 499Sulphuric acid 196 12 0 0 0 0 196 0Terbuthylazine/terbutryn 607 38 295 11 633 92 1,535 572All herbicides 1,282 64 3,904 89 1,273 100 6,459 4,466Area grown 1,586 2,802 691 5,079 3,567‘*’ lupins not encountered in 2002
● TABLE 21 Set aside seed treatment formulationsArea (ha) and percentage of crop treatedSeed treatmentsSet aside oilseedrapeSet aside grassSet aside covercropSet aside crambe*Allset aside2002*(ha) (%) (ha) (%) (ha) (%) (ha) (%) (ha) (ha)Beta-cyfluthrin/imidacloprid 1,948 58 0 0 0 0 0 0 1,948 0Iprodione 3,176 95 0 0 0 0 0 0 3,176 1,094Thiram 2,445 73 0 0 0 0 0 0 2,445 1,756Area grown 3,331 100 **33,399 570 504 37,804 38,397‘*’ excluding natural regeneration and woodland‘**’ not all grass in first year49
50● TABLE 22 Set aside insecticide and molluscicide formulationsArea treated (ha) and percentage of crop treatedInsecticidesSet aside oilseedrapeSet asideregenerationSet aside grassSet aside covercropSet aside crambe*Allset aside*2002(ha) (%) (ha) (%) (ha) (%) (ha) (%) (ha) (%) (ha) (ha)Alpha-cypermethrin 71 2 0 0 0 0 0 0 0 0 71 369Cypermethrin 1,038 16 0 0 0 0 0 0 0 0 1,038 418Deltamethrin 1,258 38 0 0 0 0 0 0 154 31 1,412 0Lambda-cyhalothrin 667 18 0 0 0 0 0 0 0 0 667 957Tau-fluvalinate 149 4 0 0 0 0 0 0 0 0 149 0All insecticides 3,183 66 0 0 0 0 0 0 154 31 3,337 2,244MolluscicidesMetaldehyde 209 6 0 0 0 0 0 0 0 0 209 366Methiocarb 55 2 0 0 0 0 0 0 0 0 55 100All molluscicides 264 8 0 0 0 0 0 0 0 0 264 466Area grown 3,331 30,338 33,399 570 504 68,142 85,526‘*’ excluding woodland
● TABLE 23 Set aside fungicide formulationsArea treated (ha) and percentage of crop treatedFungicidesSet aside oilseedrapeSet asideregenerationSet aside grassSet aside covercropSet aside crambe*Allset aside2002(ha) (%) (ha) (%) (ha) (%) (ha) (%) (ha) (%) (ha) (ha)Boscalid 688 21 0 0 0 0 0 0 0 0 688 0Carbendazim 1,474 42 0 0 0 0 0 0 154 31 1,628 1,066Carbendazim/flusilazole 817 16 0 0 0 0 0 0 0 0 817 356Carbendazim/prochloraz 176 5 0 0 0 0 0 0 0 0 176 0Famoxadone/flusilazole 977 29 0 0 0 0 0 0 0 0 977 0Flusilazole 1,927 49 0 0 0 0 0 0 0 0 1,927 302Mancozeb 137 4 0 0 0 0 0 0 0 0 137 0Metconazole 971 29 0 0 0 0 0 0 0 0 971 994Prochloraz 2,028 36 0 0 0 0 0 0 0 0 2,028 0Sulphur 1,655 44 0 0 0 0 0 0 0 0 1,655 1,473Tebuconazole 1,114 23 0 0 0 0 0 0 0 0 1,114 0Vinclozolin 355 11 0 0 0 0 0 0 0 0 355 584All fungicides 12,319 85 0 0 0 0 0 0 154 31 12,473 5,370Area grown 3,331 30,338 33,399 570 504 68,142 85,526‘*’ excluding woodland51
52● TABLE 24 Set aside herbicide formulationsArea treated (ha) percentage of crop treatedHerbicidesSet aside oilseedrapeSet asideregenerationSet aside grassSet aside covercropSet aside crambe*Allset aside*2002(ha) (%) (ha) (%) (ha) (%) (ha) (%) (ha) (%) (ha) (ha)2,4-D 0 0 116 0 77 0 0 0 0 0 193 286Bentazone/MCPA/MCPB 0 0 0 0 111 0 0 0 0 0 111 0Clomazone 71 2 0 0 0 0 0 0 0 0 71 0Clopyralid/triclopyr 0 0 0 0 11 0 0 0 0 0 11 0Dicamba/MCPA/mecoprop-P 0 0 24 0 0 0 0 0 0 0 24 0Dicamba/mecoprop-P 0 0 75 0 42 0 0 0 0 0 117 0Diquat 131 4 0 0 0 0 0 0 0 0 131 0Fluazifop-P-butyl 416 13 0 0 0 0 0 0 0 0 416 0Glyphosate 1,176 35 7,771 24 185 1 40 7 0 0 9,171 15,777MCPA 0 0 0 0 42 0 0 0 0 0 42 238Metazachlor 1,369 41 0 0 0 0 22 4 504 100 1,895 1,482Metazachlor/quinmerac 900 27 0 0 0 0 0 0 0 0 900 0Napropamide 71 2 0 0 0 0 0 0 0 0 71 0Propaquizafop 1,041 27 0 0 0 0 0 0 0 0 1,041 0Propyzamide 541 16 0 0 0 0 0 0 0 0 541 200Trifluralin 118 4 0 0 0 0 0 0 154 31 272 653All herbicides 5,833 89 7,986 24 468 1 62 11 658 100 15,007 20,663Area grown 3,331 30,338 33,399 570 504 68,142 85,526‘*’ excluding woodland
● TABLE 25 Cereals seed treatment active ingredientsArea treated (ha), percentage of crop treated, and weights (kg) of active ingredients for all cropsSeed treatments Winter barley Spring barley Winter wheat Spring wheat Winter oats Spring oats *Allcereals*Allcereals(ha) (%) (ha) (%) (ha) (%) (ha) (%) (ha) (%) (ha) (%) (ha) (kg)Bitertanol 0 0 0 0 39,365 40 102 4 1,043 17 4,811 30 45,321 5,021Carboxin 1,215 2 6,779 3 5,002 5 271 11 1,038 17 1,903 12 16,207 1,877Fludioxonil 2,831 5 29,725 11 18,712 19 808 32 1,862 30 2,168 14 56,107 566Fluquinconazole 0 0 0 0 5,683 6 0 0 0 0 0 0 5,683 786Fuberidazole 530 1 8,301 3 43,836 44 102 4 1,360 22 5,247 33 59,376 419Guazatine 82 + 7,417 3 14,217 14 451 18 443 7 2,312 15 24,923 3,184Imazalil 1,736 3 14,586 6 469 + 0 0 0 0 0 0 16,791 165Imidacloprid 2,809 5 0 0 3,448 3 0 0 0 0 0 0 6,257 443Prochloraz 181 + 185 + 6,427 6 0 0 0 0 0 0 6,794 173Silthiofam 0 0 0 0 1,410 1 0 0 0 0 0 0 1,410 63Tebuconazole 43,353 76 174,834 67 0 0 0 0 0 0 128 1 218,314 1,286Tefluthrin 0 0 0 0 1,155 1 0 0 0 0 0 0 1,155 43Thiram 1,215 2 6,779 3 5,002 5 271 11 1,038 17 1,903 12 16,207 1,877Triadimenol 530 1 8,301 3 4,471 5 0 0 317 5 436 3 14,055 922Triazoxide 43,353 76 174,834 67 0 0 0 0 0 0 128 1 218,314 1,286Triticonazole 1,917 3 14,772 6 7,137 7 451 18 0 0 0 0 24,277 241Unspecified seedtreatment 882 2 4,231 2 2,919 3 260 10 491 8 1,935 12 10,717 0Area grown 56,709 90 259,329 94 99,140 94 2,535 75 6,152 84 15,814 87 440,963‘*’ includes triticale, ‘+’ =
● TABLE 27 Cereals fungicide active ingredientsArea treated (ha), percentage of crop treated, and weights (kg) of active ingredients for all cropsFungicides Winter barley Spring barley Winter wheat Spring wheat Winter oats Spring oats *Allcereals*Allcereals(ha) (%) (ha) (%) (ha) (%) (ha) (%) (ha) (%) (ha) (%) (ha) (kg)Azoxystrobin 17,812 31 56,472 21 41,027 38 711 28 771 13 2,204 14 118,996 12,006Bromuconazole 0 0 2,304 1 931 1 0 0 0 0 0 0 3,235 362Carbendazim 3,733 7 18,292 6 6,615 6 102 4 0 0 0 0 28,743 3,710Chlorothalonil 45,626 57 162,854 51 178,113 91 2,595 85 0 0 622 4 389,810 186,689Cyproconazole 4,815 8 29,184 9 28,579 20 0 0 0 0 56 0 62,634 2,162Cyprodinil 42,306 52 53,509 21 40,909 36 362 14 0 0 0 0 137,085 40,869Dimoxystrobin 0 0 0 0 20,454 20 713 28 0 0 0 0 21,166 2,159Epoxiconazole 32,820 44 94,735 29 160,004 85 2,238 60 3,373 47 2,768 17 296,178 17,017Famoxadone 15,702 21 57,222 19 14,810 13 0 0 0 0 501 3 88,236 5,196Fenbuconazole 0 0 2,183 1 435 0 0 0 0 0 0 0 2,618 93Fenpropidin 1,575 3 593 0 3,830 4 0 0 0 0 0 0 5,997 1,198Fenpropimorph 70,623 87 218,802 61 63,030 47 813 32 7,706 91 7,924 44 369,139 69,635Fluquinconazole 1,507 3 0 0 18,354 17 0 0 0 0 0 0 19,862 1,232Flusilazole 33,271 42 127,243 36 17,449 14 0 0 0 0 1,002 3 178,966 12,621Flutriafol 0 0 0 0 9,573 10 0 0 0 0 0 0 9,573 677Kresoxim-methyl 15,503 25 58,077 18 59,844 51 1,328 52 2,959 47 2,475 16 140,427 8,501‘*’ includes triticaleCont…55
56● TABLE 27 Cereals fungicide active ingredients continuedArea treated (ha), percentage of crop treated, and weights (kg) of active ingredients for all cropsFungicides Winter barley Spring barley Winter wheat Spring wheat Winter oats Spring oats *Allcereals*Allcereals(ha) (%) (ha) (%) (ha) (%) (ha) (%) (ha) (%) (ha) (%) (ha) (kg)Mancozeb 119 + 1,105 + 8,834 8 0 0 0 0 576 4 10,634 10,609Maneb 0 0 0 0 3,963 3 0 0 0 0 0 0 3,963 4,766Metconazole 2,650 4 6,466 2 10,405 9 0 0 0 0 0 0 19,522 666Metrafenone 289 1 15,009 5 28,339 24 271 11 0 0 0 0 43,907 2,856Picoxystrobin 22,173 35 25,942 10 0 0 0 0 381 6 284 2 48,780 5,022Prochloraz 7,453 12 3,589 1 18,500 18 0 0 0 0 0 0 29,541 6,083Propiconazole 4,868 8 10,845 4 13,018 10 271 11 0 0 0 0 29,002 1,887Pyraclostrobin 12,853 19 46,904 18 14,363 13 0 0 0 0 162 1 74,282 5,288Quinoxyfen 4,296 4 18,495 6 12,994 10 0 0 2,094 34 5,463 33 43,343 2,142Spiroxamine 6,723 10 20,725 7 14,059 11 790 21 0 0 0 0 42,297 8,628Sulphur 2,234 3 6,451 2 14,560 11 345 14 0 0 891 6 24,481 71,406Tebuconazole 1,037 2 5,740 2 48,910 47 1,603 42 771 13 154 1 58,215 5,627Tetraconazole 0 0 0 0 418 + 0 0 0 0 0 0 418 20Triadimenol 851 2 4,448 2 11,316 11 0 0 411 7 0 0 17,026 738Trifloxystrobin 15,624 26 30,441 12 25,056 24 0 0 0 0 501 3 71,622 6,303Unspecified fungicides 0 0 0 0 771 1 0 0 0 0 0 0 771 0All fungicides 366,462 98 1,077,631 88 889,464 98 12,141 85 18,467 96 25,585 61 2,390,469 496,169Area grown 56,709 259,329 99,140 2,535 6,152 15,814 440,963‘*’ includes triticale, ‘+’ = < 0.5%
● TABLE 28 Cereals herbicide and growth regulator active ingredientsArea treated (ha), percentage of crop treated, and weights (kg) of active ingredients for all cropsHerbicides Winter barley Spring barley Winter wheat Spring wheat Winter oats Spring oats *Allcereals*Allcereals(ha) (%) (ha) (%) (ha) (%) (ha) (%) (ha) (%) (ha) (%) (ha) (kg)2,4-DB 0 0 3,259 1 0 0 0 0 0 0 245 2 3,504 2,909Amidosulfuron 0 0 3,794 1 964 1 0 0 532 9 0 0 5,290 97Benazolin 0 0 950 + 0 0 0 0 0 0 0 0 950 103Bentazone 0 0 1,515 1 0 0 0 0 0 0 0 0 1,515 1,478Bromoxynil 1,035 2 49,896 19 2,258 2 102 4 532 9 2,169 14 55,993 6,496Carfentrazone-ethyl 0 0 0 0 522 1 260 10 2,541 41 56 + 3,379 47Chlorotoluron 2,385 4 0 0 4,203 4 0 0 0 0 0 0 6,588 5,477Clodinafop-propargyl 0 0 0 0 2,859 3 0 0 0 0 0 0 2,859 68Dicamba 177 + 32,547 13 1,149 1 271 11 269 4 3,156 20 37,569 1,825Dichlorprop-P 0 0 0 0 117 + 0 0 0 0 0 0 117 38Diclofop-methyl 233 + 479 + 0 0 0 0 0 0 0 0 712 356Diflufenican 28,865 51 526 + 47,706 47 0 0 188 3 0 0 77,877 3,744Fenoxaprop-P-ethyl 233 + 479 + 4,244 4 0 0 0 0 0 0 4,956 229Florasulam 902 2 40 + 6,010 6 0 0 0 0 189 1 7,141 15Flupyrsulfuron-methyl 0 0 0 0 522 1 0 0 3,833 62 0 0 4,354 31Fluroxypyr 1,584 3 3,573 1 10,045 10 0 0 362 6 289 2 16,372 1,666Flurtamone 6,669 12 0 0 14,649 14 0 0 0 0 0 0 21,319 2,093‘*’ includes triticale, ‘+’ =
58● TABLE 28 Cereals herbicide and growth regulator active ingredients continuedArea treated (ha), percentage of crop treated, and weights (kg) of active ingredients for all cropsHerbicides Winter barley Spring barley Winter wheat Spring wheat Winter oats Spring oats *Allcereals*Allcereals(ha) (%) (ha) (%) (ha) (%) (ha) (%) (ha) (%) (ha) (%) (ha) (kg)Glyphosate** 22,937 36 56,655 21 17,960 17 271 11 1,580 24 1,009 6 **100,429 74,042Iodosulfuron-methylsodium0 0 1,379 1 0 0 0 0 0 0 0 0 1,379 2Ioxynil 1,035 2 45,054 17 2,258 2 102 4 532 9 2,121 13 51,103 5,031Isoproturon 49,935 88 5,307 2 81,569 79 102 4 194 3 245 2 137,352 120,563Linuron 0 0 4,558 2 0 0 0 0 0 0 245 2 4,804 486MCPA 690 1 27,995 11 665 1 0 0 549 9 2,942 19 32,841 24,857MCPB 0 0 3,799 1 0 0 0 0 0 0 0 0 3,799 4,322Mecoprop-P 15,273 27 168,544 65 46,258 45 2,147 85 4,387 63 10,035 63 246,644 129,758Metosulam 0 0 0 0 305 + 0 0 0 0 0 0 305 3Metsulfuron-methyl 5,992 11 186,305 72 18,335 18 2,045 81 2,451 33 8,057 51 223,425 719Pendimethalin 21,588 38 0 0 36,842 37 0 0 6 + 0 0 58,436 41,243Picolinafen 10,771 19 0 0 22,336 23 0 0 0 0 0 0 33,107 1,051Propoxycarbazonesodium0 0 0 0 82 + 0 0 0 0 0 0 82 6Simazine 4,799 8 0 0 5,650 6 0 0 0 0 0 0 10,449 1,177Sulfosulfuron 0 0 0 0 4,927 4 0 0 0 0 0 0 4,927 70Terbuthylazine 74 + 0 0 24 0 0 0 0 0 0 0 97 8Thifensulfuron-methyl 3,090 5 165,905 64 12,120 12 1,785 70 1,508 25 501 3 184,909 3,995‘*’ includes triticale, ‘+’ =
● TABLE 28 Cereals herbicide and growth regulator active ingredients continuedArea treated (ha), percentage of crop treated, and weights (kg) of active ingredients for all cropsHerbicides Winter barley Spring barley Winter wheat Spring wheat Winter oats Spring oats *Allcereals*Allcereals(ha) (%) (ha) (%) (ha) (%) (ha) (%) (ha) (%) (ha) (%) (ha) (kg)Tralkoxydim 4,425 8 34,076 13 1,382 1 105 4 0 0 0 0 39,989 7,198Triasulfuron 438 1 0 0 0 0 0 0 0 0 0 0 438 3Tribenuron-methyl 3,082 5 64,214 25 5,870 6 0 0 1,347 22 1,283 8 75,795 589Trifluralin 6,791 12 0 0 10,926 11 0 0 173 3 0 0 18,483 13,363Unspecified herbicides 260 + 0 0 1,093 1 0 0 0 0 0 0 1,354 0All herbicides 193,265 100 860,850 98 363,849 96 7,190 85 20,981 100 32,543 91 1,480,640 455,157Growth regulators2-chloroethylphosphonicacid 40,713 70 14,718 5 36,022 36 713 28 436 7 0 0 92,840 15,646Chlormequat 60,026 77 13,480 5 143,656 92 1,073 42 5,932 82 5,012 32 229,716 173,106Imazaquin 0 0 0 0 21,522 18 0 0 0 0 0 0 21,522 23Mepiquat chloride 11,273 20 11,120 4 9,025 9 0 0 436 7 0 0 32,094 7,769Trinexapac-ethyl 30,781 52 6,783 3 38,696 33 0 0 2,716 38 2,404 15 81,972 3,731Unspecified growthregulators 0 0 0 0 0 0 0 0 0 0 1,604 10 1,604 6All growth regulators 142,793 90 46,101 13 248,921 95 1,786 70 9,519 88 9,020 49 459,750 200,280Area grown 56,709 259,329 99,140 2,535 6,152 15,814 440,963‘*’ includes triticale, ‘+’ =
60 ● TABLE 29 Oilseed rape seed treatment active ingredientsArea treated (ha), percentage of crop treated, and weights (kg) of active ingredients for all cropsSeed treatment Winter oilseed rape Spring oilseed rape All oilseedrapeAlloilseed(ha) (%) (ha) (%) (ha) (kg)Beta-cyfluthrin 16,188 47 2,121 41 18,309 159Imidacloprid 16,188 47 2,121 41 18,309 159Iprodione 28,461 83 3,736 72 32,197 352Thiram 27,134 79 4,326 84 31,460 420Unspecified seed treatment 1,196 4 448 9 1,644Area grown 34,167 97 5,178 100 39,345
● TABLE 30 Oilseed rape insecticide and molluscicide active ingredientsArea treated (ha), percentage of crop treated, and weights (kg) of active ingredients for all cropsInsecticidesWinter oilseedrapeSpring oilseedrapeAll oilseedrapeAll oilseedrape(ha) (%) (ha) (%) (ha) (kg)PyrethroidsAlpha-cypermethrin 760 2 186 4 946 13Cypermethrin 5,235 11 100 2 5,335 123Deltamethrin 4,439 13 233 5 4,673 39Lambda-cyhalothrin 10,568 28 1,973 32 12,541 68Tau-fluvalinate 2,955 9 1,024 20 3,979 116Zeta-cypermethrin 1,548 5 0 0 1,548 15All pyrethroids 25,505 3,516 29,022 375OthersPymetrozine 419 1 0 0 419 26All others 419 0 0 0 419 26All insecticides 25,925 60 3,516 60 29,441 401MolluscicidesMetaldehyde 2,374 7 0 0 2,374 740Methiocarb 1,358 4 0 0 1,358 174Thiodicarb 1,105 3 0 0 1,105 142All molluscicides 4,837 12 0 0 4,837 1,055Area grown 34,167 5,178 39,34561
62 ● TABLE 31 Oilseed rape fungicide active ingredientsArea treated (ha), percentage of crop treated, and weights (kg) of active ingredients for all cropsFungicidesWinter oilseedrapeSpring oilseedrapeAll oilseedrapeAll oilseedrape(ha) (%) (ha) (%) (ha) (kg)Boscalid 13,761 40 3,747 72 17,509 3,808Carbendazim 32,772 64 1,854 36 34,626 4,750Chlorothalonil 1,309 4 0 0 1,309 808Difenoconazole 1,585 5 0 0 1,585 84Famoxadone 8,910 26 1,024 20 9,934 790Flusilazole 41,904 71 1,129 22 43,034 4,496Iprodione 1,019 3 0 0 1,019 339Mancozeb 762 2 0 0 762 771Metalaxyl-M 232 1 0 0 232 5Metconazole 9,048 23 0 0 9,048 322Prochloraz 10,054 18 134 3 10,188 2,370Propiconazole 743 2 0 0 743 37Sulphur 9,688 23 751 14 10,438 53,466Tebuconazole 15,395 35 0 0 15,395 2,223Thiophanate-methyl 1,019 3 0 0 1,019 339Vinclozolin 6,079 18 1,721 33 7,800 2,677All fungicides 154,280 99 10,360 80 164,640 77,284Area grown 34,167 5,178 39,345
● TABLE 32 Oilseed rape herbicide and growth regulator active ingredientsArea treated (ha), percentage of crop treated, and weights (kg) of active ingredients for all cropsHerbicidesWinter oilseedrapeSpring oilseedrapeAll oilseedrapeAll oilseedrape(ha) (%) (ha) (%) (ha) (kg)Benazolin 1,647 5 0 0 1,647 335Carbetamide 602 2 0 0 602 1,063Clomazone 744 2 0 0 744 61Clopyralid 1,769 5 148 3 1,917 102Cyanazine 548 2 0 0 548 267Cycloxydim 1,037 3 0 0 1,037 121Diquat 711 2 0 0 711 427Fluazifop-P-butyl 2,077 6 100 2 2,177 163Glyphosate 9,282 27 3,135 57 12,416 13,984Metazachlor 26,144 77 4,216 81 30,359 20,194Napropamide 77 + 0 0 77 74Picloram 83 + 0 0 83 2Propaquizafop 9,527 23 351 7 9,878 351Propyzamide 6,748 20 0 0 6,748 4,019Quinmerac 4,309 13 0 0 4,309 831Quizalofop-P-ethyl 990 3 0 0 990 20Trifluralin 577 2 475 9 1,052 946All herbicides 66,874 100 8,424 95 75,298 42,958Growth regulatorsChlormequat 180 1 0 0 180 143All growth regulators 180 1 0 0 180 143Area grown 34,167 5,178 39,345‘+’ = < 0.5%63
64 ● TABLE 33 Potato seed treatment active ingredientsArea treated (ha), percentage of crop treated, and weights (kg) of active ingredients for all cropsSeed treatments Seed potatoes Ware potatoes Early potatoes AllpotatoesAllpotatoes(ha) (%) (ha) (%) (ha) (%) (ha) (kg)Flutolanil 789 7 0 0 0 0 789 312Imazalil 8,345 69 11,035 67 941 100 20,321 669Iprodione 986 8 688 4 0 0 1,674 533Mancozeb 0 0 429 3 0 0 429 4,243Pencycuron 8,295 69 11,887 73 941 100 21,123 12,744Tolclofos-methyl 648 5 184 1 0 0 832 473Area grown 12,022 97 16,389 86 941 100 29,352
● TABLE 34 Potato insecticide, molluscicide and nematicide active ingredientsArea treated (ha), percentage of crop treated, and weights (kg) of active ingredients for all cropsInsecticides Seed potatoes Ware potatoes Early potatoes All potatoes All potatoes(ha) (%) (ha) (%) (ha) (%) (ha) (kg)PyrethroidsCypermethrin 3,017 8 1,230 6 0 0 4,247 82Deltamethrin 9,119 38 1,926 8 0 0 11,045 69Lambda-cyhalothrin 22,610 59 8,519 20 0 0 31,130 181Zeta-cypermethrin 558 2 0 0 0 0 558 6All pyrethroids 35,305 11,675 0 46,980 337CarbamatesAldicarb 0 0 876 5 0 0 876 782Pirimicarb 28,830 80 7,865 34 0 0 36,695 3,801All carbamates 28,830 8,741 0 37,571 4,583OthersPymetrozine 7,486 43 3,980 17 0 0 11,466 1,412Oxamyl 0 0 175 1 0 0 175 263All others 7,486 4,156 0 11,642 1,675All insecticides 71,621 88 24,571 60 0 0 96,193 6,595MolluscicidesMetaldehyde 2,321 13 25,019 39 0 0 27,339 8,663Methiocarb 4,132 17 7,155 29 0 0 11,287 1,064Thiodicarb 2,332 3 7,683 17 0 0 10,015 1,355Unspecified molluscicides 166 1 0 0 0 0 166 0All molluscicides 8,951 26 39,856 65 0 0 48,807 11,082Area grown 12,022 16,389 941 29,35265
66 ● TABLE 35 Potato fungicide active ingredientsArea treated (ha), percentage of crop treated, and weights (kg) of active ingredients for all cropsFungicides Seed potatoes Ware potatoes Early potatoes All potatoes All potatoes(ha) (%) (ha) (%) (ha) (%) (ha) (kg)Azoxystrobin 0 0 1,362 8 0 0 1,362 941Benalaxyl 4,360 25 6,132 21 0 0 10,492 1,679Chlorothalonil 4,093 25 4,583 17 0 0 8,676 7,053Cyazofamid 8,119 37 16,350 50 0 0 24,468 1,929Cymoxanil 43,066 97 73,234 95 407 43 116,708 10,772Dimethomorph 6,800 40 10,285 29 0 0 17,085 2,385Famoxadone 2,711 15 7,136 23 0 0 9,847 1,271Fenamidone 2,926 16 3,568 8 0 0 6,494 975Fluazinam 19,556 69 34,752 82 2,161 100 56,469 8,129Mancozeb 51,586 95 80,508 94 1,069 57 133,163 172,634Maneb 233 2 0 0 0 0 233 316Metalaxyl 0 0 110 1 0 0 110 16Metalaxyl-M 7,010 40 9,233 38 1,348 100 17,591 1,281Ofurace 225 2 0 0 0 0 225 26Propamocarb hydrochloride 5,962 36 7,767 22 0 0 13,729 11,284Sulphur 0 0 1,258 8 0 0 1,258 7,809Zineb-ethylenethiuram disulphide 585 3 0 0 0 0 585 595Zoxamide 3,586 23 5,743 24 535 57 9,864 1,468All fungicides 160,818 100 262,019 100 5,520 100 428,357 230,563Area grown 12,022 16,389 941 29,352
● TABLE 36 Potato herbicide active ingredientsArea treated (ha), percentage of crop treated, and weights (kg) of active ingredients for all cropsHerbicides Seed potatoes Ware potatoes Early potatoes All potatoes All potatoes(ha) (%) (ha) (%) (ha) (%) (ha) (kg)Carfentrazone-ethyl 146 1 827 5 535 57 1,508 90Cycloxydim 56 + 0 0 0 0 56 18Diquat 8,050 50 18,233 90 813 43 27,096 7,117Flufenacet 225 2 0 0 0 0 225 108Linuron 9,611 80 10,394 63 941 100 20,947 21,304Metribuzin 2,643 22 6,098 37 0 0 8,741 5,208Paraquat 11,652 97 15,759 96 941 100 28,353 9,759Pendimethalin 0 0 1,186 7 0 0 1,186 1,380Rimsulfuron 0 0 781 5 0 0 781 6Sulphuric acid 17,678 90 21,100 79 0 0 38,778 5,428,261All herbicides 50,062 100 74,379 100 3,231 100 127,671 5,473,250Area grown 12,022 16,389 941 29,352‘+’ =
68 ● TABLE 37 Legume seed treatment active ingredientsArea treated (ha), percentage of crop treated, and weights (kg) of active ingredients for all cropsSeed treatments Combine peas Field beans Lupins All crops All crops(ha) (%) (ha) (%) (ha) (%) (ha) (kg)Cymoxanil 70 4 0 0 0 0 70 4Fludioxonil 70 4 0 0 0 0 70 2Metalaxyl-M 70 4 0 0 0 0 70 6Thiabendazole 0 0 0 0 31 4 31 2Thiram 539 34 564 20 332 48 1,435 244No information on seed treatments 70 4 0 0 0 0 70 71Unspecified seed treatment 190 12 97 3 0 0 288 0Area grown 1,586 55 2,802 24 691 48 5,079
● TABLE 38 Legume insecticide active ingredientsArea treated (ha), percentage of crop treated, and weights (kg) of active ingredients for all cropsInsecticides Combine peas Field beans Lupins All crops All crops(ha) (%) (ha) (%) (ha) (%) (ha) (kg)PyrethroidsAlpha-cypermethrin 0 0 131 5 0 0 131 2Cypermethrin 0 0 160 6 0 0 160 4Deltamethrin 0 0 388 14 0 0 388 3Lambda-cyhalothrin 460 29 748 27 0 0 1,208 8Zeta-cypermethrin 0 0 93 3 0 0 93 1All pyrethroids 460 1,520 0 1,981 17CarbamatesPirimicarb 0 0 391 14 0 0 391 38All carbamates 0 391 0 391 38All insecticides 460 29 1,911 53 0 0 2,372 55Area grown 1,586 2,802 691 5,07969
70 ● TABLE 39 Legume fungicide active ingredientsArea treated (ha), percentage of crop treated, and weights (kg) of active ingredients for all cropsFungicides Combine peas Field beans Lupins All crops All crops(ha) (%) (ha) (%) (ha) (%) (ha) (kg)Azoxystrobin 216 14 991 24 0 0 1,207 125Benomyl 0 0 29 1 0 0 29 7Carbendazim 48 3 470 13 0 0 518 136Chlorothalonil 460 29 3,502 84 87 13 4,049 2,698Cyproconazole 412 26 262 6 87 13 761 36Iprodione 175 11 0 0 0 0 175 57Metalaxyl-M 0 0 666 17 0 0 666 26Sulphur 414 26 605 22 87 13 1,105 3,529Thiophanate-methyl 175 11 0 0 0 0 175 57Vinclozolin 0 0 583 21 0 0 583 161All fungicides 1,901 52 7,107 85 260 13 9,268 6,833Area grown 1,586 2,802 691 5,079
● TABLE 40 Legume herbicide active ingredientsArea treated (ha), percentage of crop treated, and weights (kg) of active ingredients for all cropsHerbicides Combine peas Field beans Lupins All crops All crops(ha) (%) (ha) (%) (ha) (%) (ha) (kg)Cyanazine 196 12 713 25 0 0 909 408Diquat 93 6 195 7 350 51 638 347Fluazifop-P-butyl 0 0 0 0 59 8 59 11Glyphosate 0 0 892 32 173 25 1,066 1,374MCPA 190 12 0 0 0 0 190 19MCPB 190 12 0 0 0 0 190 123Pendimethalin 196 12 713 25 59 8 968 777Propaquizafop 0 0 297 11 0 0 297 20Simazine 0 0 1,511 54 0 0 1,511 1,432Sulphuric acid 196 12 0 0 0 0 196 16,615Terbuthylazine 607 38 295 11 633 92 1,535 537Terbutryn 607 38 295 11 633 92 1,535 1,253All herbicides 2,275 64 4,913 89 1,906 100 9,094 22,917Area grown 1,586 2,802 691 5,07971
72● TABLE 41 Set aside seed treatment active ingredientsArea treated (ha), percentage of crop treated, and weights (kg) of active ingredients for all cropsSeed treatmentsSet aside oilseedrapeSet aside grassSet aside covercropSet aside crambe*Allset asideAllsetaside*(ha) (%) (ha) (%) (ha) (%) (ha) (%) (ha) (kg)Beta-cyfluthrin 1,948 58 0 0 0 0 0 0 1,948 18Imidacloprid 1,948 58 0 0 0 0 0 0 1,948 18Iprodione 3,176 95 0 0 0 0 0 0 3,176 39Thiram 2,445 73 0 0 0 0 0 0 2,445 36Area grown 3,331 100 **33,399 570 504 37,804‘*’ excluding natural regeneration and woodland‘**’ not all grass in first year
● TABLE 42 Set aside insecticide and molluscicide active ingredientsArea treated (ha), percentage of crop treated, and weights (kg) of active ingredients for all cropsInsecticidesSet aside oilseedrapeSet asideregenerationSet aside grassSet aside covercropSet aside crambe*Allset asideAllSetaside*(ha) (%) (ha) (%) (ha) (%) (ha) (%) (ha) (%) (ha) (kg)PyrethroidsAlpha-cypermethrin 71 2 0 0 0 0 0 0 0 0 71 1Cypermethrin 1,038 16 0 0 0 0 0 0 0 0 1,038 25Deltamethrin 1,258 38 0 0 0 0 0 0 154 31 1,412 9Lambda-cyhalothrin 667 18 0 0 0 0 0 0 0 0 667 4Tau-fluvalinate 149 4 0 0 0 0 0 0 0 0 149 7All pyrethroids 3,183 0 0 0 0 0 0 0 154 0 3,337 45All insecticides 3,183 66 0 0 0 0 0 0 154 31 3,337 45MolluscicidesMetaldehyde 209 6 0 0 0 0 0 0 0 0 209 16Methiocarb 55 2 0 0 0 0 0 0 0 0 55 11All molluscicides 264 8 0 0 0 0 0 0 0 0 264 27Area grown 3,331 30,338 33,399 570 504 *68,142‘*’excluding woodland73
74● TABLE 43 Set aside fungicide active ingredientsArea treated (ha), percentage of crop treated, and weights (kg) of active ingredients for all cropsFungicidesSet aside oilseedrapeSet asideregenerationSet aside grassSet aside covercropSet aside crambe*Allset asideAllsetaside(ha) (%) (ha) (%) (ha) (%) (ha) (%) (ha) (%) (ha) (kg)Boscalid 688 21 0 0 0 0 0 0 0 0 688 151Carbendazim 2,468 56 0 0 0 0 0 0 154 31 2,622 457Famoxadone 977 29 0 0 0 0 0 0 0 0 977 77Flusilazole 3,721 64 0 0 0 0 0 0 0 0 3,721 366Mancozeb 137 4 0 0 0 0 0 0 0 0 137 109Metconazole 971 29 0 0 0 0 0 0 0 0 971 34Prochloraz 2,204 41 0 0 0 0 0 0 0 0 2,204 508Sulphur 1,655 44 0 0 0 0 0 0 0 0 1,655 10,598Tebuconazole 1,114 23 0 0 0 0 0 0 0 0 1,114 167Vinclozolin 355 11 0 0 0 0 0 0 0 0 355 129All fungicides 14,290 85 0 0 0 0 0 0 154 31 14,444 12,597Area grown 3,331 30,338 33,399 570 504 *68,142‘*’ excluding woodland
● TABLE 44 Set aside herbicide active ingredientsArea treated (ha), percentage of crop treated, and weights (kg) of active ingredients for all cropsHerbicidesSet aside oilseedrapeSet asideregenerationSet aside grassSet aside covercropSet aside crambe*Allset asideAllsetaside*(ha) (%) (ha) (%) (ha) (%) (ha) (%) (ha) (%) (ha) (kg)2,4-D 0 0 116 + 77 + 0 0 0 0 193 329Bentazone 0 0 0 0 111 + 0 0 0 0 111 111Clomazone 71 2 0 0 0 0 0 0 0 0 71 5Clopyralid 0 0 0 0 11 + 0 0 0 0 11 2Dicamba 0 0 99 + 42 + 0 0 0 0 141 10Diquat 131 4 0 0 0 0 0 0 0 0 131 78Fluazifop-P-butyl 416 13 0 0 0 0 0 0 0 0 416 67Glyphosate 1,176 35 7,771 24 185 1 40 7 0 0 9,171 8,799MCPA 0 0 24 + 153 + 0 0 0 0 177 85MCPB 0 0 0 0 111 + 0 0 0 0 111 111Mecoprop-P 0 0 99 + 42 + 0 0 0 0 141 66Metazachlor 2,268 68 0 0 0 0 22 4 504 100 2,794 1,793Napropamide 71 2 0 0 0 0 0 0 0 0 71 68Propaquizafop 1,041 27 0 0 0 0 0 0 0 0 1,041 37Propyzamide 541 16 0 0 0 0 0 0 0 0 541 273Quinmerac 900 27 0 0 0 0 0 0 0 0 900 164Triclopyr 0 0 0 0 11 + 0 0 0 0 11 8Trifluralin 118 4 0 0 0 0 0 0 154 31 272 255All herbicides 6,733 89 8,110 24 743 1 62 11 658 100 16,305 12,261Area grown 3,331 30,338 33,399 570 504 68,142‘*’ excluding woodland, ‘+’ =
● TABLE 45 Principal active ingredientsArea (area treated × 1000) treated with the 50 most used activeingredients, including seed treatments, on all crops surveyedAi Type <strong>2004</strong> 20021 Chlorothalonil F 404 342 Fenpropimorph F 369 3393 Epoxiconazole F 296 2144 Tebuconazole F/S 293 2865 Mecoprop-P H 247 2136 Chlormequat G 230 2267 Flusilazole F 226 2128 Metsulfuron-Methyl H 223 2129 Triazoxide S 218 20410 Thifensulfuron-Methyl H 185 18111 Mancozeb F 145 15112 Kresoxim-Methyl F 140 15913 Isoproturon H 137 11014 Cyprodinil F 137 12715 Glyphosate H 123 9216 Azoxystrobin F 122 13517 Cymoxanil F/S 117 11118 Famoxadone F 109 7519 2-chloroethylphosphonic acid G 93 7020 Trinexapac-Ethyl G 82 7521 Diflufenican H 78 6822 Tribenuron-Methyl H 76 8923 Pyraclostrobin F 74 8524 Trifloxystrobin F 72 9125 Lambda-Cyhalothrin I 67 3726 Carbendazim F 67 6027 Cyproconazole F 63 6328 Pendimethalin H 61 4329 Fuberidazole S 59 5230 Fluazinam F 56 3331 Fludioxonil S 56 2732 Bromoxynil H 56 7033 Thiram S 52 3234 Ioxynil H 51 6935 Picoxystrobin F 49 4936 Prochloraz F/S 49 4337 Bitertanol S 45 4138 Metrafenone F 44 039 Quinoxyfen F 43 5640 Spiroxamine F 42 6141 Tralkoxydim H 40 3842 Pirimicarb I 39 5443 Sulphuric Acid H 39 4744 Sulphur F 39 5845 Iprodione F/S 38 1846 Dicamba H 38 3847 Imazalil S 37 3048 Metaldehyde M 34 3449 MCPA H 33 3450 Metazachlor H 33 22● TABLE 46 Principal active ingredientsQuantity (tonnes) of the 50 most used active ingredients,including seed treatments, on all crops surveyedAi Type <strong>2004</strong> 20021 Sulphuric acid H 5445 63202 Chlorothalonil F 197 173 Mancozeb F 188 1974 Chlormequat G 173 1675 Sulphur F 147 1846 Mecoprop-P H 130 1107 Isoproturon H 121 958 Glyphosate H 98 809 Fenpropimorph F 70 6510 Pendimethalin H 43 2911 Cyprodinil F 41 3512 MCPA H 25 2313 Metazachlor H 22 1414 Linuron H 22 1915 Flusilazole F 17 1616 Epoxiconazole F 17 1117 2-chloroethylphosphonic acid G 16 1118 Trifluralin H 15 1219 Azoxystrobin F 13 1320 Pencycuron S 13 1521 Propamocarb hydrochloride F 11 522 Cymoxanil F/S 11 1023 Metaldehyde M 11 1124 Paraquat H 10 1125 Tebuconazole F/S 9 826 Prochloraz F/S 9 727 Carbendazim F 9 828 Spiroxamine F 9 1229 Kresoxim-methyl F 9 930 Fluazinam F 8 531 Diquat H 8 832 Mepiquat chloride G 8 533 Famoxadone F 7 534 Tralkoxydim H 7 735 Bromoxynil H 6 936 Trifloxystrobin F 6 937 Chlorotoluron H 5 038 Pyraclostrobin F 5 739 Metribuzin H 5 340 Maneb F 5 241 Ioxynil H 5 742 Picoxystrobin F 5 543 Bitertanol S 5 544 Chlorpyrifos I 5 545 MCPB H 5 346 Propyzamide H 4 347 Pirimicarb I 4 548 Thifensulfuron-methyl H 4 449 Boscalid F 4 050 Diflufenican H 4 3For tables 45 and 46 the pesticide type is shown (H: Herbicide, F: Fungicide, I: Insecticide, S: Seed Treatment, G: Growth Regulator& M: Molluscicide)76
● FIGURE 9 Top 5 active ingredients in <strong>2004</strong>: trends in usage 1992 - <strong>2004</strong>Treated area (hectares) of active ingredientsCerealsArea treated (ha)450,000400,000350,000 Chlorothalonil300,000 Fenpropimorph250,000Epoxiconazole200,000150,000 Mecoprop-P100,000 Chlormequat50,00001992 1994 1996 1998 2000 2002 <strong>2004</strong>Oilseed rape60,000Area treated (ha)50,00040,00030,00020,00010,00001992 1994 1996 1998 2000 2002 <strong>2004</strong>FlusilazoleCarbendazimMetazachlorBoscalidTebuconazolePotatoesArea treated (ha)160,000140,000120,000100,00080,00060,00040,00020,00001992 1994 1996 1998 2000 2002 <strong>2004</strong>MancozebCymoxanilFluazinamLambda-cyhalothrinPirimicarb77
78 ● TABLE 47 Cereals, comparison with previous yearsPesticide usage in 2000, 2002 and <strong>2004</strong>, area treated with formulations and active ingredients (a.i.) and the quantities applied2000 2002 <strong>2004</strong>Formulations(ha)a.i.(ha)kgFormulations(ha)a.i.(ha)kgFormulations(ha)a.i.(ha)kgInsecticidesPyrethroids 48,530 49,273 661 53,809 53,809 709 54,174 54,174 707Organophosphates 19,442 19,442 11,592 8,130 8,130 5,269 9,418 9,418 6,217Carbamates 1,834 2,577 167 5,430 5,430 504 2,200 2,200 164Mixed formulations or others 743 0 0 0 0 0 0 0 0All insecticides 70,549 71,291 12,419 67,368 67,368 6,482 65,792 65,792 7,088Molluscicides 31,709 31,709 6,799 35,265 35,265 8,192 6,149 6,149 1,470Fungicides 1,416,961 1,963,152 303,469 1,393,453 1,976,211 349,509 1,719,351 2,390,726 496,420Herbicides 964,635 1,360,824 417,797 951,323 1,387,061 376,639 1,033,235 1,481,070 455,947Growth regulators 346,039 431,766 183,102 338,350 426,160 186,017 372,216 459,750 201,670Seed treatments 427,276 784,331 33,803 420,887 729,187 27,859 411,795 750,033 19,105All pesticides 3,257,169 4,643,073 957,388 3,206,646 4,621,252 954,698 3,608,538 5,153,519 1,181,700Area planted (ha) 448,718 445,512 440,963
● FIGURE 10 Cereals, comparison with previous yearsTreated area of active ingredients of main pesticide types 1992 – <strong>2004</strong> 2,500Area treated (x1,000 ha)2,0001,5001,00050001992 1994 1996 1998 2000 2002 <strong>2004</strong>FungicidesHerbicidesArea grownInsecticides79
80 ● TABLE 48 Oilseed rape, comparison with previous yearsPesticide usage in 2000, 2002 and <strong>2004</strong>, area treated with formulations and active ingredients and the quantities applied2000 2002 <strong>2004</strong>Formulations(ha)a.i.(ha)kgFormulations(ha)a.i.(ha)kgFormulations(ha)a.i.(ha)kgInsecticidesPyrethroids 17,938 17,938 227 24,461 24,461 338 29,022 29,022 375Organophosphates 162 162 109 305 305 76 0 0 0Mixed formulations or others 0 0 0 468 468 44 419 419 26All insecticides 18,099 18,099 335 25,234 25,234 458 29,441 29,441 401Molluscicides 11,600 11,600 2,788 11,063 11,063 2,419 4,837 4,837 1,055Fungicides 93,002 119,491 52,517 89,272 111,718 41,797 132,223 164,640 77,284Herbicides/desiccants 60,698 65,095 37,360 50,041 56,930 30,218 70,692 75,298 42,958Growth regulators 5,147 5,147 4,749 36 36 51 180 180 143Seed treatments 42,945 69,951 1,224 37,439 42,764 732 83,610 102,282 1,111All pesticides 231,491 289,383 98,973 213,085 247,745 75,675 320,983 376,678 122,952Area planted (ha) 36,401 30,902 39,345
● FIGURE 11 Oilseed rape, comparison with previous years250Area treated (x1,000 ha)2001501005001992 1994 1996 1998 2000 2002 <strong>2004</strong>FungicidesHerbicidesArea grownInsecticidesTreated area of active ingredients of main pesticide types 1992 - <strong>2004</strong> 81
82 ● TABLE 49 Potatoes, comparison with previous yearsPesticide usage in 2000, 2002 and <strong>2004</strong>, area treated with formulations and active ingredients and the quantities applied2000 2002 <strong>2004</strong>Formulations(ha)a.i.(ha)kgFormulations(ha)a.i.(ha)kgFormulations(ha)a.i.(ha)kgInsecticides & nematicidesPyrethroids 27,256 58,471 348 18,362 52,186 386 26,374 46,980 337Organophosphates 1,504 1,841 643 376 376 30 0 0 0Carbamates 33,066 63,944 10,212 16,493 50,317 7,061 16,965 37,571 4,583Mixed formulations or others 32,408 1,193 123 43,131 9,307 753 32,247 11,641 1,675All insecticides & nematicides 94,234 125,449 11,326 78,362 112,187 8,229 75,586 96,193 6,595Molluscicides 23,573 23,573 4,339 30,546 30,546 5,376 48,807 48,807 11,109Fungicides 202,153 323,028 208,391 268,617 437,881 266,805 280,954 428,357 230,562Herbicides/desiccants 96,478 112,563 5,590,165 113,073 132,712 6,362,964 108,643 127,671 5,473,250Growth regulators 1,110 1,110 3,253 1,333 1,333 4,000 0 0 0Seed treatments 26,482 34,353 11,221 29,222 43,290 16,178 34,982 45,168 18,975All pesticides 444,029 620,076 5,828,695 521,153 757,949 6,663,552 548,972 746,197 5,740,491Area planted (ha) 29,689 30,203 29,352
● FIGURE 12 Potatoes, comparison with previous yearsTreated area of active ingredients of main pesticide types 1992 - <strong>2004</strong> 450400Area treated (x1,000 ha)3503002502001501005001992 1994 1996 1998 2000 2002 <strong>2004</strong>FungicidesHerbicidesArea grownInsecticides83
84 ● TABLE 50 Set aside, comparison with previous yearsPesticide usage in 2000, 2002 and <strong>2004</strong>, area treated with formulations and active ingredients and the quantities applied2000 2002 <strong>2004</strong>Formulations(ha)a.i.(ha)kgFormulations(ha)a.i.(ha)kgFormulations(ha)a.i.(ha)kgInsecticidesPyrethroids 2,999 2,999 29 2,244 2,244 26 3,337 3,337 45All insecticides 2,999 2,999 29 2,244 2,244 26 3,337 3,337 45Molluscicides 2,007 2,007 425 466 467 267 264 264 27Fungicides 12,552 16,920 6,667 5,370 6,322 6,667 12,473 14,444 12,597Herbicides 26,184 28,279 22,555 20,663 21,620 20,223 15,007 16,305 12,261Growth regulators 113 113 166 0 0 0 0 0 0Seed treatments 5,499 7,802 146 4,648 5,708 100 7,569 9,517 112All pesticides 49,353 58,119 29,988 33,391 36,361 27,283 38,650 43,867 25,042Area (ha) 77,678 85,580 68,142
● FIGURE 13 Set aside, comparison with previous yearsTreated area of active ingredients of main pesticide types 1994 - <strong>2004</strong> 10090Area treated (x1,000 ha)807060504030201001994 1996 1998 2000 2002 <strong>2004</strong>AreaHerbicidesFungicidesInsecticides85
86● TABLE 51 Sampled areaSize (ha)Highlands Caithness Moray Aberdeen Angus East Fife Lothian Central Tweed S. Solway& Islands & Orkney Firth Lowlands Valley Uplands0.1 - 19.9 77 41 38 64 35 0 13 49 0 10 3820 - 49.9 73 29 274 558 244 99 29 264 71 22 13050 - 99.9 68 100 616 1,454 1,227 501 455 821 345 144 188100 - 149.9 0 0 914 1,331 1,381 704 878 494 998 0 136150 + 0 0 2,323 3,328 6,140 1,853 2,506 1,137 4,153 196 153All sizes 219 170 4,164 6,735 9,028 3,156 3,880 2,764 5,566 373 645● TABLE 52 Census areaSize (ha)Highlands& IslandsCaithness&OrkneyMorayFirthAberdeen Angus East Fife Lothian CentralLowlandsTweedValleyS.UplandsSolway0.1 - 19.9 2,953 4,735 4,218 10,636 3,219 857 1,023 8,175 1,174 1,272 4,35520 - 49.9 1,950 2,548 9,989 24,978 11,496 4,340 2,660 14,175 4,470 1,851 6,28250 - 99.9 1,287 2,185 12,940 32,879 27,220 11,834 8,554 15,885 9,627 1,735 3,842100 - 149.9 344 377 9,811 18,255 20,731 9,669 11,372 10,062 14,789 561 1,215150 + 370 312 15,687 28,049 38,963 16,219 20,448 9,828 30,171 1,555 1,570All sizes 6,904 10,157 52,644 114,797 101,629 42,918 44,057 58,125 60,231 6,975 17,264
● TABLE 53 Raising factorsSize (ha)Highlands& IslandsCaithness&OrkneyMorayFirthAberdeen Angus East Fife Lothian CentralLowlandsTweedValleyS.UplandsSolway0.1 - 19.9 38.32 115.26 112.35 166.08 91.51 NA 78.53 166.19 NA 126.82 115.7620 - 49.9 26.70 88.33 36.45 44.77 47.05 44.04 92.91 53.74 63.11 83.13 48.1450 - 99.9 18.80 21.85 20.99 22.61 22.19 23.64 18.79 19.36 27.94 12.01 20.38100 - 149.9 NA NA 10.74 13.72 15.01 13.74 12.96 20.36 14.81 NA 8.92150 + NA NA 6.75 8.43 6.35 8.75 8.16 8.65 7.27 7.92 10.29‘NA’ not applicable87
88● TABLE 54 First and second adjustment factorsHighlands& IslandsCaithness& OrkneyMorayFirthAberdeen Angus EastFifeLothianCentralLowlandsTweedvalleyS.UplandsSolwaySecondadjustmentfactorWinter barley NA 0.31 1.05 1.15 0.99 1.24 1.17 0.97 1.02 1.40 1.40 1.00Spring barley 0.99 1.15 0.96 0.94 1.02 0.91 0.81 1.09 1.02 1.01 1.01 1.00Wheat 0.69 0.38 0.92 0.95 1.05 1.05 1.17 0.98 1.01 0.79 0.79 1.00Winter oats NA NA 1.42 2.16 0.63 0.56 1.36 2.08 1.14 1.14 1.06Spring oats 1.72 1.89 3.32 0.70 0.53 1.99 1.96 0.34 1.41 0.61 0.61 1.00Triticale NA NA 0.21 NA 0.06 NA NA 0.17 NA 0.36 0.36 1.38Winter oilseed rape NA NA 0.93 1.03 0.95 0.82 1.03 1.21 0.76 0.87 0.87 1.00Spring oilseed rape NA NA NA 6.32 4.46 1.12 0.50 NA 1.55 1.04 1.04 1.33Seed potatoes NA NA 0.76 1.76 1.03 NA NA 2.40 3.31 NA NA 1.10Early potatoes NA NA NA NA 1.94 0.63 NA NA NA NA NA 2.87Ware potatoes 1.02 NA 5.91 2.81 1.34 2.96 1.77 1.52 1.47 19.32 19.32 1.00Combine peas NA NA 1.80 NA 0.75 5.92 0.64 0.91 0.64 0.28 0.28 1.14Field beans NA NA 0.16 NA 0.64 2.66 2.90 1.07 0.75 NA NA 1.02Lupins NA NA NA NA NA 0.07 0.21 2.68 0.64 NA NA 2.98Linseed NA NA NA NA NA 0.06 NA NA NA NA NA 24.47All set-aside 0.80 0.58 0.90 1.74 0.86 0.91 1.63 1.14 0.70 2.26 2.26 1.00‘NA’ not applicable