You also want an ePaper? Increase the reach of your titles
YUMPU automatically turns print PDFs into web optimized ePapers that Google loves.
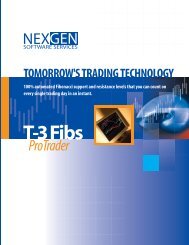
TOMORROW'S TRADING TECHNOLOGY100% automated Fibonacci support and resistance levels that you can count onevery single trading day in an instant.<strong>ProTrader</strong>
Predicting key turning points in advance by using FibonacciBy John Novak –developer T-3 Fibs <strong>ProTrader</strong>Why determining potential turning points in advance is important for every traderA trader needs to know where the potential turning points are going to be in the market inorder to have the foresight to make the proper trading decisions that will yield the highestpossible returns for the least amount of risk. Fibonacci not unlike Elliot Wave analysis isa set of simple rules that provide traders the ability to predict the potential of a moveprior to the move happening by analyzing swings or waves in the market. Elliot waveformations can change as the market progresses while Fibonacci ratios derived fromswings that have already happened will never change. Our experience tells us that 100%objective Fibonacci price projections and retracement methodologies will give you themost consistent way to determine in advance where the market will have the highestpotential to turn when done correctly.Common Fibonacci Ratios and Their QualitiesMany traders today use Fibonacci in their trading. Most of the time this will consist ofretracement levels from major swing and more advanced traders will use extensions ofpast swings into the future. Some common Fibonacci ratios that traders will use are38.2%, 50%, 61.8%, 100%, 138.2%, 161.8%, 200% and 261.8%. Fibonacci ratios willhave a more “exhaustive” quality the larger they get. For example, a 78.6% retracementwill have more chance of stopping a move than a 38.2% retracement will. This is true forextensions as well; a 261.8% extension will have more chance of stopping a market thana 138.2% extension.In addition to the higher exhaustive quality of the higher Fibonacci ratios, in most casesthe higher the timeframe the Fibonacci ratio was generated from the greater the chance itwill have an influence on the market. Knowing this information you are able to give morecredence to higher Fibonacci ratios and from ratios from higher timeframes when doingmanual analysis.This take an even more powerful turn when you are able to find and apply Fibonacciratios from multiple timeframes and multiple swings that land into a relatively small zoneon your charts. The amount of work necessary to do a complete analysis of everypossible Fibonacci line from every swing on every timeframe makes it nearly impossiblefor anyone to achieve consistent results. Those who have learned how to master this artand who are only able to use the “right” ratios from the “right” swings are able toconsistently able to call tops and bottoms using Fibonacci.The T-3 Fibs <strong>ProTrader</strong> has mastered this art, and allows the trader to focus less onanalysis and more on what is important, assessing reward versus risk and making thetrade. Let’s first take a look at the types of Fibonacci projections that the T-3 Fibs<strong>ProTrader</strong> will use in it’s analysis.
How to Set up the Fibonacci ToolHow to do this manually in Tradestation or any other platform your using such asMultiCharts you will need to select the tool from the drawing menu.Then you must format your Fibonacci tool in your platform to have the ratios that youwish to use in your analysis of the market. Below you will see a typical setup using themost common ratios. You may change colors and lines to your personal preferences.The Fibonacci tool is then applied to the charts by dragging and dropping the tool fromyour starting and ending pivots that you wish to analyze.
Fibonacci Projections and Retracements DefinedThere are 4 main Fibonacci projections that we use in our software:1. Extensions- take the range from pivot #1 to pivot #2 multiply that distance by aFibonacci number, add the two numbers together and it will give projections intothe future where a possible turning point could be.2. Expansions- take the range from pivot #2 to pivot #3 multiply that distance by aFibonacci number, add the two numbers together and it will give projections intothe future where a possible turning point could be.
3. Alternates- take the range from pivot #1 to pivot #2 multiply that distance by aFibonacci number, add that to Pivot #3 and it will give projections into the futurewhere a possible turning point could be.4. Retracements- take the distance from a #1 pivot to the #2 pivot and take aportion of that range that is commonly less than 100%. The most common ratiosare 38.2%, 50%, 61.8% and 78.6%. This is usually more beneficial from highertimeframes when determining reversal areas.
Now we are going to use this setup to define a multiple timeframe key Fibonacciconfluence area that we can make trading decisions based on our knowledge.If you look at the following chart of the S&P 500 minis the overall trend is down.
Once we make a bottom and the short-term trend turns back to up by making higher lowswe want to know where this pullback may stop and where we can resume the longer-termdowntrend again.This is a blowup of the chart above… as you can see we have labeled some of the swingsfor you as 1-2-3. Once we have put in the GREEN #3 pivot we have short-term trend upand we are working to anticipate where the trend will end. Once we have the smallerswings of the BLUE 1-2-3 we now have enough information to start our Fibonaccianalysis.
Manually Calculating Fibonacci Confluences Step by StepThe first step will be to go back to where the last major swing down has started andcalculate our retracement levels.As you can see in the following chart with the MAGENTA 1-2-3 we are calculating theRetracements from the #1 to the #2 pivots.
Now we are going to use the GREEN 1-2-3 pivots and do our Extensions, Expansionsand Alternates.
Once we have completed our analysis on the GREEN 1-2-3 we will start our work andrepeat this process on the BLUE 1-2-3. First we will start with Extensions from the 1-2pivots.Once we have our extensions we will do our Expansions from the 2-3 pivots.
Then we will take the distance from 1-2 pivots and do our Alternates.
What we will end up with is a tight range where many different Fibonacci ratios fromseveral different sets of 1-2-3 fall together. This is what we call a Fibonacci confluence.This is where we will look for the overall longer-term trend to continue.
Now that we know where are key areas are let’s take our first look at the T-3 Fibs<strong>ProTrader</strong> and how the software will automatically call key areas of Fibonacci supportand resistance.What makes the T-3 Fibs <strong>ProTrader</strong> so special? The answer is summed up in 3 words,power, accuracy and consistency. The software will do EVERY possible 1-2-3 swingfrom well over 150 days worth of data or more, then it will “synthetically” build 9 highertimeframes and do every possible 1-2-3 from those “higher” timeframes and generateevery possible Fibonacci line for you automatically. The snapshot below will show youthe “raw” number of Fibonacci lines that the software is generating on a single chart. Thebackground color has been changed so you can see each of the lines a bit clearer.
Let’s take a slightly closer look at those lines. As you can see …there is a Fibonacci lineon just about every tick in the market.The power of the T-3 Fibs <strong>ProTrader</strong> is that it is able to take all of the raw Fibonaccilines, rank them according to strength, and strength dictated by timeframe, then filter outthe noise and leave you with a clear picture of where the market has the most powerfulcombination of Fibonacci confluences. Not only will the software give you the areas atwhich to get in, the key Fibonacci areas will also help you to dictate how much potentialthere is on any given trade prior to entry.
The T-3 Fibs <strong>ProTrader</strong> will also give you a level of consistency in your Fibonaccianalysis that is almost impossible to duplicate by hand. Most importantly it will allowyou to focus on being a trader and not an analyst.Now that you know Fibonacci and how the confluences are generated, how can we usethem to make money on a consistent basis? There are two indicators that we will use inaddition to our key Fibonacci areas to assist us in entry timing, the T-3 Macd BB linesand the T-3 Trigger lines.
Trigger Lines represent the quick expected outcome of the market and will be used as oneof our momentum indicators. Notice the chart will coordinate with the numbereddescriptions below.1. MOMENTUM - Price bars pulling away from the Trigger Lines, whilespreading apart, represents strength and momentum.2. LOSS OF MOMENTUM - Price action inside the Trigger Lines, which havestopped spreading apart, show a loss of momentum. This is the first sign thatmomentum is weakening.3. LOSS OF MOMENTUM WITH THE POTENTIAL TO TURN - TriggerLines begin to show the potential to roll, cross and reverse direction when theprice closes on the opposite side.
Strong Macd Reaction to a Key Area - This will often validate that the directionhas changed. Now look to trade in the new direction.
We have established two very simple trades that can be learned in days and when tradedcorrectly can be used on any market, any timeframe with a high winning percentage and ahigh reward to risk ratio.This information will cover how to take advantage of the full potential of theT3Fibonacci Areas, when to trade a Fib Area, and how to anticipate a Reversal in themarket. This will help T3 Traders to achieve two simple things that are needed forsuccess. Number one, trade on the correct side of the market, and number two,trade the proper areas, which are the areas anticipated to hold. The Fib MomentumTrade, the Trend Trade, and the Reversal Trade will be the three setups covered.Fib Momentum Trade (FMT)The large chart will provide the Area for the entries and the direction for trades.The Areas and Macds will be indicative of the direction and entry points. There are fiverules that will be used as guidelines when looking for the Reversal.Rules for the Fib Momentum Trade are as follows:1. The market MUST reach an area of “Blue” Support, or “Red” Resistance. To helpidentify the strongest areas, it is best that the area is on more than one time frame,but not always necessary.2. The Macds on the larger chart MUST show a “Strong” reaction off of the area, orareas.3. The Small Triggers MUST be crossed in the trade direction. It is best, if the SmallTriggers are wide and spread apart. This is another sign of a “Strong” reaction offthe area.4. It is also necessary to see a “Weak” condition in the Large Triggers on the largerchart. Closing inside, or on the trade side of the Large Triggers will show theweakness in the overall trend.5. Upon pulling back to the area(s) anticipated to hold, the Macds MUST show aweak Retracement, also known as Retracement Divergence. This indicates thearea has an even greater potential to hold. Think Big move off the Fib Area, asmall Retracement in the Macds, while pulling back to the entry area, and thenanother big move in the new direction. At this point, look for the entry pattern onthe smaller chart, for low risk, while looking to maximize profits, by holding forthe next key area on the larger chart. Stops are placed behind the Reversal Bar.
Example of Fib Momentum Trade ES Short
Trend Trade (TT)The trend trade is simply a trade that is with the direction of the larger chart. Thebest area for this trade is at the Midband. If the Large Triggers and the Zero Line are alsonear this area, there are more reasons for a bounce. At this time, the trade may be“Viewed” as more conservative. The Trend Trade typically follows a Reversal Trade,when the large chart indicates that the direction may continue.Rules for the Trend Trade are as follows:1. Identify the direction on the large chart2. The Macds should show the potential for the entry area to hold on Large charta. Potential Zero Line Rejectionb. Testing the Bollinger Bands as Support/Resistancec. Macds begin to roll, while on the correct side, and away from ZL3. Look for the short term direction to begin rolling on the smaller chart, at the entryareaa. Closing inside or on trade side of Small Triggersb. Macds rolling in the trade direction4. Stops are placed behind the reversal pattern at the entry areaa. Below the low of the Reversal Bar for longb. Above the high of the Reversal Bar for a short5. Have plenty of room to the target area on the large chartOnce the price has reached the next key area, reevaluate the conditions on thelarge chart. If it is showing the potential for the area to hold, with weakness in the trend, aReversal may be expected. This means continuation of the trend is now limited, and atrend Reversal may occur. Otherwise, if the area on the large chart is anticipated to break,another Trend Trade may take place.
Example of ER2 Trend Trade Short
Example of ES Trend Trade Long
In Summation:• Fibonacci gives us a powerful edge over the market• Multiple timeframe Fibonacci increases that edge• T-3 Fibs <strong>ProTrader</strong> automates this process with a simple to use softwareprogram.• Nexgen <strong>Software</strong> Services has set up step-by-step educational tools toensure that every trader receives as much attention as needed to perfectthe use of the software.• Live market data is used during the learning process to give traders livefeedback in hotcomm chat rooms as they are learning.• Nexgen <strong>Software</strong> Services offers daily recaps, private tutoring, andsmall group seminars for those looking to fine tune their education in theshortest amount of time possible.Thank you for your time and interest in our software and education!John NovakNexgen <strong>Software</strong> Services Inc.3400 Research Forest Drive Suite B-9The Woodlands TX 77381www.nexgent3.com281-419-2110
<strong>ProTrader</strong>www.nss-t3.com3400 Research Forest Dr. Suite B9, The Woodlands, TX. 77381Tel: 281.419.2110