to download user guide - NEXGEN Software Systems
to download user guide - NEXGEN Software Systems
to download user guide - NEXGEN Software Systems
You also want an ePaper? Increase the reach of your titles
YUMPU automatically turns print PDFs into web optimized ePapers that Google loves.
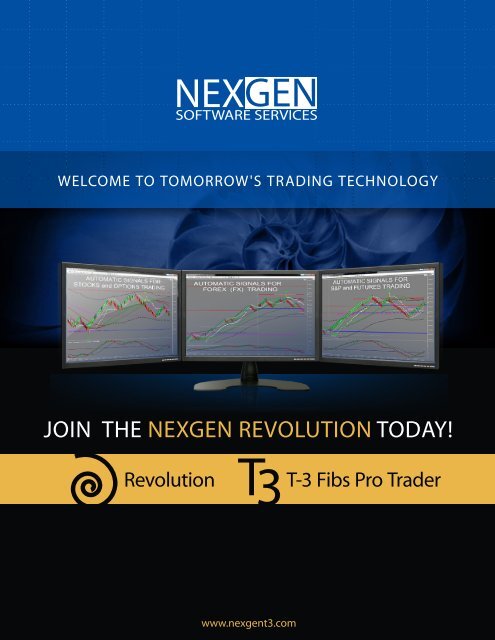
WELCOME TO TOMORROW'S OR TRADING TECHNOLOGYJOIN THE <strong>NEXGEN</strong> REVOLUTION TODAY!RevolutionT-3 Fibs Pro Traderwww.nexgent3.com
<strong>NEXGEN</strong> SOFTWARE SERVICES DEMO SOFTWARE COMPONENTS DETAILS1. A Comprehensive Overview –What is Nexgen, Fibonacci & the trading method about?2. Discretionary Trading Vs. System Trading3. Indica<strong>to</strong>r names, descriptions and basic outcomes for each4. Bar Structure Setup with Renko Spectrum Bars vs. Tick or Minute Charts5. Bloodhound demo Add on during Nexgen Demo – why we use it and what is it?6. Hotcomm educational online chat room softwareLEARNING THE RULES FOR THE REVOLUTION ENTRIES (Discretionary and Au<strong>to</strong>mated)1. Watch Video the setup rules in Revolution for Trend and Momentum Trading2. Watch the Video for indica<strong>to</strong>r nuances and Counter Trend Trading setup rules3. Download PDF with Example Setups and Nuance Pictures for Study Material (100+ examples)4. Download the PDF for Trade Management by clicking here and watching video links on the PDF5. Watch Video on how <strong>to</strong> rank each setup based on indica<strong>to</strong>r look6. Watch Video on how <strong>to</strong> incorporate higher timeframe charts for filteringOPENING NINJA & <strong>NEXGEN</strong> AND APPLYING STRATEGY & INDICATORS FOR FIRST TIME1. Open Ninja workspace, Activating Revolution System and Bloodhound for the first time2. Saving a template with your indica<strong>to</strong>rs and Revolution system settings for later use3. Adding new Symbols, Rolling Contracts & Applying templates and strategies <strong>to</strong> your charts4. I loaded the strategy but don’t see any his<strong>to</strong>rical trades5. Settings for his<strong>to</strong>rical signal testing versus live trading mode and the differences6. How <strong>to</strong> add or remove an “INDICATOR” <strong>to</strong> a chart in Ninja.UNDERSTANDING HOW TO INCORPOPRATE BLOODHOUND TEMPLATES1. How do I select my template for Bloodhound Filters and Signals in the Strategy2. What are the different filters for the Strategy and what do they do?3. How do I get the background <strong>to</strong> display the color my system filter is using?4. Can I write my own entries and filters for the strategy and how?UNDERSTANDING STOPS, TARGETS and LIMIT ORDER SETTINGS DURING LIVE TRADING1. Inputs & S<strong>to</strong>ps- Understanding trailing s<strong>to</strong>ps & profit targets in system settings2. Adjust my Entry S<strong>to</strong>p and Profit target levels and how <strong>to</strong> Exit Now when in a live trade.3. What If I want <strong>to</strong> do my own discretionary trades with system on?HISTORICAL BACK TESTING1. How <strong>to</strong> incorporate simple manual management rules with examples2. How <strong>to</strong> test T3 Revolution Trading System using market replay3. How do I run a strategy report and what are limitations in back testing?
T-3 Fibs ProTrader & Revolution Guide Table of Contents1. Basic AreasA. Fibonacci Confluence Areas……………………………...(Pg.2)B. Outer Bands and Mid band………...………………….…. (Pg.3)C. Large Trigger Lines……………….……………….…….. (Pg.4)D. One <strong>to</strong> Ones…………………...…………………….…… (Pg.5-6)E. Small Triggers…………………………………………… (Pg.7)2. Macd BB LinesA. Basics of the Macd BB Lines………………………….…. (Pg.8)B. Macd BB Strength………………………………………... (Pg.9)C. Recognizing a Strong Macd Reaction <strong>to</strong> a Key Area…..… (Pg.10)D. Macd BB Weak Retracement in Trend ……………..…….(Pg.11)E. Bollinger Band Support and Resistance……………..……(Pg.12)F. Zero Line Rejection…………………………………..….. (Pg.13)G. Divergences between Highs or Lows………………..……(Pg.14-16)H. Retracement Divergence ……………………………..…..(Pg.17)I. T-3 Divergence Potential Indica<strong>to</strong>r ...................................(Pg. 18)3. ABC's and Trend Tick Counter and Profit TakerA. Determining Trend using Trigger lines ……………....…(Pg.19)B. ABC plots inside of ProTrader ………………………..….(Pg.20-26)C. T-3 Tick Counter................... ……………………...….…(Pg.27)D. T-3 Profit Taker ................. …………………………......(Pg 28)4. T-3 Input Settings and MeaningsA. T-3 Fibs ProTrader Settings ……......……………….…...(Pg.29-30)B. T-3 Accumula<strong>to</strong>r Settings....... …………………..........…(Pg. 30)5. GlossaryA. Terms and Terminology …………………………………(Pg 31-32)6. T-3 Revolution Strategy and Indica<strong>to</strong>rA. Inputs and Meanings ………………………………….(Pg 38-43)1
Basic Indica<strong>to</strong>r AreasThe T-3 Fibs ProTrader is the most powerful predictive indica<strong>to</strong>r package available<strong>to</strong>day. Learning when <strong>to</strong> trade long and short from the software’s key stacked areas willgive you the highest reward, lowest risk trades possible.Levels generated by the T-3 Fibs ProTrader are as follows:Fibonacci Confluence Areas - These areas are very powerful clusters of Fibonacciratios that fall in<strong>to</strong> a tight range. They are used as the road map for our trading. Thesekey areas will be extremely reliable for determining potential Reversal points in themarket. Our Fibonacci confluence areas are generated by 10 “synthetically built” highertime frames. This gives us a complete and accurate Fibonacci analysis, which isrepresented by red and blue lines. The solid red lines are resistance and the solid bluelines are support.2
Outer Bands and mid band (T-3Trend Bands) - These areas may create abounce in the market. As such they will often act as areas for entries, as well as areasfor exits.3
Large Trigger Lines –The Large Trigger Lines will represent the overall directionor trend of the market. They provide information such as strength, weakness and thepotential <strong>to</strong> change the direction of the market.The Large Trigger Lines will also act as support and resistance when they arepinching and rolling and after they have crossed.4
One <strong>to</strong> Ones (1:1) - The white 1:1s are 100% alternates projected from the previousswing. (No matter how small the swing) The magenta 1:1s project a new swing whenthe trend changes. They will help <strong>to</strong> make an area stronger, but alone will be lesssignificant.Yellow one <strong>to</strong> ones are 100% alternates of the previous small swing that happened in themarket in that direction.Magenta one <strong>to</strong> ones are 100% alternates of the previous large swing or trend changingswing that has in the market in that direction.To calculate the Larger swing one <strong>to</strong> ones follow these steps.Calculate the distance from the high of PIVOT #1 <strong>to</strong> the low of PIVOT #2Then add that distance <strong>to</strong> the high of the #3 pivot once that pivot is in place.This must have a “TREND CHANGE “ in the middle consisting of higher high pivots orlower low pivots.To calculate the smaller swing one <strong>to</strong> ones follow these steps.Calculate the distance from PIVOT #3 <strong>to</strong> PIVOT #4.Add that distance <strong>to</strong> PIVOT #5General rules, these areas will act as a potential support and or resistance depending onwhich direction the market is headed. They become much more powerful at Fibonaccisupport and resistance areas of if they coincide with the upper or lower trend bands.5
SMALL TRIGGER LINES- Notice the chart will coordinate with the numbereddescriptions below.1. MOMENTUM - Price bars pulling away from the Trigger Lines, whilespreading apart, represents strength and momentum.2. LOSS OF MOMENTUM - Price action inside the Trigger Lines, which haves<strong>to</strong>pped spreading apart, show a loss of momentum. This is the first sign thatmomentum is weakening.3. LOSS OF MOMENTUM WITH THE POTENTIAL TO TURN - TriggerLines begin <strong>to</strong> show the potential <strong>to</strong> roll, cross and reverse direction when theprice closes on the opposite side.7
Macd BB LinesThe Macd BB Lines are an indica<strong>to</strong>r that will offer “insight” in<strong>to</strong> the market’s strengthor weakness. The Macd BB Lines will provide information about the current market,and its expected outcome. This indica<strong>to</strong>r may require the most practice <strong>to</strong> becomeproficient, but once mastered it will be an invaluable <strong>to</strong>ol.Basics of the Macd BB LinesIf the Macd BB Lines are slowing with the bands coming <strong>to</strong>gether, it is indicative ofweakening in the current trend and consolidation or a reversal may take place. Theswing distance on the Macd Bollinger Bands typically indicates momentum of thetrend. If the Macd BBs are moving rapidly in one direction, with very little <strong>to</strong> nopullback, it is a strong move.The distance between the Macd BBs themselves is also a signal that will help you <strong>to</strong>determine the strength of the move. The larger the spacing between the Macd BBs, themore momentum there will be behind the move.8
Macd BB Strength - When Macd BB dots move outside of the Bollinger BandLines, it will indicate that the market has a lot of momentum. Generally, it will continuein the current direction. If in a position, this will help you <strong>to</strong> remain patient <strong>to</strong> maximizeyour profits. If waiting <strong>to</strong> enter a new position, this will keep you from getting in <strong>to</strong>oearly.9
Recognizing a Strong Macd Reaction <strong>to</strong> a Key Area - This will oftenvalidate that the direction has changed. Now look <strong>to</strong> trade in the new direction.10
How <strong>to</strong> recognize a “weak” Macd retracement in a trend- When you arein a trending market you can use the Macd BB lines <strong>to</strong> help you recognize when themarket is making retracements within the trend or of the market is showing the potentialfor a reversal in tend. Notice the highlighted areas below. Each of these will be used inour educational rooms and will be called weak retracements.11
Bollinger Band Support and Resistance - This is expected after a strong movein the Macd BB Lines, and it is followed by a Retracement <strong>to</strong> the opposite BollingerBand. It will seem as though the BBs are sliding along the Bollinger Bands and willgenerally be at key areas.12
Zero Line Rejection (ZLR) - A Zero Line Rejection occurs when the Macd BBLines reach the Zero Line and begin <strong>to</strong> turn. At this point, anticipate the trend <strong>to</strong>continue. If the Macd BB Lines move though the Zero Line, then anticipate that thetrend has changed.13
Divergences between Price and T-3 Macd BB swingsThe job of Divergence is <strong>to</strong> change the trend of the market or <strong>to</strong> cause a majorbounce or stall in the current trend.5 basics of Divergence and the expected outcome for the Fib Areas1. Bearish Divergence occurs when there are higher prices andlower Macd. REVERSAL EXPECTED - RESISTANCE MAYHOLD2. The market is TRENDING UP when there are higher prices andhigher Macd. NO REVERSAL EXPECTED - RESISTANCEMAY BREAK3. Bullish Divergence occurs when there are lower prices andhigher Macd. REVERSAL EXPECTED - SUPPORT MAYHOLD4. The market is TRENDING DOWN when there are lower pricesand lower Macd. NO REVERSAL EXPECTED – SUPPORTMAY BREAK5. When closing past a Divergence high or low, it shows the trendmay continue.*The reading of the Macd BB lines will be a vital part of your Pre-Trade andDuring Trade routine so please make sure you study them.14
With Bearish Divergence at resistance, the area has the potential <strong>to</strong> hold.15
With Bullish Divergence at Support, the area has the potential <strong>to</strong> hold.16
Retracement Divergence - At key areas, compare the swings between the price andthe Macd. Retracement Divergence is typically defined as, less than a 38% retracement inthe Macd, and at least 50% retracement in price. This Divergence is showing that the areais anticipated <strong>to</strong> hold. Below is an example of Bearish Retracement Divergence.17
T-3 Divergence indica<strong>to</strong>r- this indica<strong>to</strong>r when applied will show the price swingsversus Macd BB lines swings. It will plot a POSITIVE Number when the swings of theMacd are greater (as a %) than price swings and will plot a NEGATIVE number showingthe divergence between Macd and Price Swing.18
Determining Trend Direction Using Large Trigger Lines –The LargeTrigger Lines are a simple way <strong>to</strong> give you a quick perspective of the overall directionor trend of the market.They provide information such as strength, weakness and the potential <strong>to</strong> change thedirection of the market. The Market direction will be up if your small triggers areclosing above the large triggers and down if the small triggers are closing below thelarge triggers.19
T-3 Fibs ProTrader ABC's indica<strong>to</strong>rs that plot on charts.The ABCs are a <strong>to</strong>ol that helps <strong>to</strong> understand development of a new trend, or simply atrend continuation. The ABC indica<strong>to</strong>r helps one determine the market has made newhighs/lows, or has failed <strong>to</strong> make new highs/lows. To see what makes each pivot plot, wewill need <strong>to</strong> understand that the purpose of each letter is <strong>to</strong> exceed the previous letter,except for the C…it only needs <strong>to</strong> equal the B pivot.* However, the A and C have the exception that if they do exceed the previous pivot, theprogression will be complete, until the next outer band is reached.A. Expected Outcome of the EXT Pivot- The ABC progression begins witha pivot at or beyond the outer band, resulting in an extreme pivot that the softwarelabels EXT. Once the EXT is plotted, its purpose is <strong>to</strong> drive the market <strong>to</strong> theopposite outer band. Once the market arrives at the opposite outer band andcreates a new pivot, another EXT will plot, signaling the beginning of a new ABCprogression. If a pivot occurs prior <strong>to</strong> reaching the opposite outer band, the APivot will plot.20
B. Expected Outcome of the A Pivot -The A Pivot is expected <strong>to</strong> take theprice back <strong>to</strong> the outer band in order <strong>to</strong> exceed the previous EXT pivot.Completion of the task would exceed the EXT, resulting in a new EXT at theouter band. If the A pivot falls short of the outer band, and doesn’t exceed theprice of the EXT, the B pivot will plot.21
C. Nuance for the A Pivot - Once the A exceeds the EXT, the progression isover, and a new progression will begin as a new EXT forms at the outer band.22
D. Expected Outcome of the B Pivot - The B pivot is expected <strong>to</strong> exceed theA pivot, possibly resulting in a new EXT at the other outer band. The B pivotcompletes its first function as soon as it exceeds the A. If the B does not reach theouter band, the progression is expected <strong>to</strong> continue with a C pivot. The B pivot isthe only letter that has more than one chance. If it does not exceed the A pivot,and does not hit an outer band, then there is still a chance for the C. However, theB pivot MUST exceed the A <strong>to</strong> get the C pivot. As long as the B does not reachthe outer band, then progression is still intact.23
E. Nuance for the B Pivot -The B has more than one chance <strong>to</strong> complete itstask. As long as the outer band is not reached, the B can still provide a C, once theA has been exceeded.24
F. Expected Outcome of the C Pivot -The C is <strong>to</strong> EQUAL THE B, possiblyeven exceed it, thereby completing the progression. If the C reaches the outerband, a new EXT will plot, beginning the progression again. If the C does notequal the B pivot, then it will plot a Failure. This may happen just one tick awayfrom the B pivot.25
G. When the C Pivot Fails -The failure simply completes the progression byrunning back <strong>to</strong> the opposite outer band, exceeding the C pivot. From theopposite outer band a new progression will begin. These are the fundamentals ofwhat makes the pivot points plot in the progression.26
T-3 Ticks Left CounterThe ticks left counter will count backwards <strong>to</strong> zero giving you an indication when aTICK BASED* bar will reach zero. This will be important when timing your entriesbased on the close of the bar or a few ticks short of the close of a bar.* Tick Bars plot the price of each transaction. Tick bars differ from time-based barsbecause tick bars plot prices based on a transaction-by-transaction basis while time-basedbars plot prices during a specified time period. A transaction can represent 100 shares,200 shares, 1,000 shares, and so on. When plotting tick bars, price and number of ticksare the only fac<strong>to</strong>rs used, as time and volume are not considered. ( source Tradestationhelp <strong>guide</strong>).27
T-3 Profit Target – AKA Loss of Momentum ( LOM) indica<strong>to</strong>rThis indica<strong>to</strong>r will plot when we have an overbought or oversold market condition andthere is a loss of momentum LOM with the price bar closing on the other side of the smalltrigger lines, and the Macd BB lines rolling. This may be helpful in spotting areas <strong>to</strong> take aprofit on a trade.28
T-3 Fibs ProTrader Inputs and MeaningsFib_Timeframes(10) - number of timeframes analyzed (1-10 range)Fib_Au<strong>to</strong>FluSetting (22) - First number is Range <strong>to</strong> look for Confluences the higherthe number the larger the range ( 2-4 Usable ) . The Second number is how aggressively<strong>to</strong> "collapse" weaker Fibonacci areas ( 1= Smallest - 4 = Largest usable).Typically this setting should always remain " 22" or "32 " in our experienceFib_CollapseMarginTicks (0), 0 means is au<strong>to</strong>-calculated ( above input) or you canmanually set how many ticks you wish <strong>to</strong> use as a filter. 1 =smallest - 1,000 ... when youuse smaller charts Au<strong>to</strong> Settings usually work well. If you use Daily charts or largertimeframe charts depending on the market you will need that make that numberconsiderably higher. For example a s<strong>to</strong>ck that trades in a large range like Google mayneed 300 as a setting- that would mean you are collapsing fibs within a 3 dollar range or( 300 of the smallest increment the instrument trades in).Fib_NdaysBack (10), number of days back <strong>to</strong> <strong>to</strong> start fibs analysis for each - So ifyour chart has 30 days the fibs will only use data from the last 10 days if set <strong>to</strong> 10. Thisnumber may need <strong>to</strong> be in the hundreds if looking at Daily bars. Note- the first 10 days ofthe 30 day chart will use all data available until it reaches 10 days.Fib_UpdatePeriod (1440), How often in minutes your chart will update theAu<strong>to</strong>mated Fibonacci lines. 360 = every 360 minutes. If you use Daily charts you maywish for your update period <strong>to</strong> be once per week. In that case a (-) negative number isused <strong>to</strong> make the program use DAYS and not minutes. (-14) would be every two weeks.When using Negative numbers you can also specify the DAY of the week <strong>to</strong> update thefibs expressed as a 1-5 representing Monday through Friday.So if you set it <strong>to</strong> -7.5 the Fibs will recalculate after every Friday Once per week.If it is set <strong>to</strong> -14.2 the Fibs will recalculate on Tuesday every other week.Fib_LineWidth (0)- Sets Fibonacci Line thickness ( 0-5 ) usable rangeFib_TextToRightSpace (14)- Plots the value of the fib line on the right edge of yourcharts. If you set it <strong>to</strong> "0" it will turn off the text prices.Plot_OffsetTicks (2)- Controls how many ticks above or below price bars for plots suchas the ABC plots.29
Plot_ABC (true)- Turns on and off EXT-ABC-FAILURE plots as a True/False inputPlot_Abc_Sml_121s (true),- Turns on and off White one <strong>to</strong> one dotted plots as aTrue/False inputPlot_Abc_Lrg_121s (true)- Turns on and off Magenta one <strong>to</strong> one dotted plots as aTrue/False inputPlot_TrendBands (true)- Turns on and off T-3 Trend Band Upper Mid and LowerBands plots as a True/False inputAbc_TextColor (black)- Color option for the ABC plots.AccumulationId (0)- a numerical Expression that tells the T-3 Fibs ProTrader <strong>to</strong> PUSHOUT the fib lines as values in order for the T-3 Fibs Accumula<strong>to</strong>r Indica<strong>to</strong>r <strong>to</strong> plot theFibonacci Lines from ( this chart ) <strong>to</strong> any other chart you set the number the same as. Forexample - if you run the ProTrader on a 5 minute chart and generate Fibonacci lines youcan set the AccumulationId input <strong>to</strong> (1) and that information will be s<strong>to</strong>red in the DLL.When you apply the T-3 Accumula<strong>to</strong>r <strong>to</strong> another chart (say a 576 tick chart) and set theinput <strong>to</strong> (1) after the first complete bar the 5-Minute Fibs will appear on that chart.T-3 Fibs Accumula<strong>to</strong>r Inputs and MeaningsaccumulationId (0), - this will PULL Fibonacci lines from the T-3 Fibs ProTraderthe Fibonacci lines from another chart when the input value is the same.For example - if you run the T-3 Fibs ProTrader on a 5 minute chart and generateFibonacci lines you can set the AccumulationId input <strong>to</strong> (1) and that information will bes<strong>to</strong>red in the DLL.When you apply the T-3 Accumula<strong>to</strong>r <strong>to</strong> another chart (say a 576 tick chart) and set theinput <strong>to</strong> (1) after the first complete bar the 5-Minute Fibs will appear on the 576 tickchart.fluColor (white)- You can manually set Fibonacci areas pulled from another chart <strong>to</strong>a specific color for ease in use. You may use the RBG number or the name. If you setthis <strong>to</strong> a (-1) then the program will au<strong>to</strong>matically pull the color from the parent chart.Red or Blue30
10) GLOSSARYAREA = Lines on the chart that can create a bounce.BEARISH DIVERGENCE = Equal <strong>to</strong> higher price pivots, and lower MacdPivots, and runs at the <strong>to</strong>p of the price.BOLLINGER BANDS = Standard deviation of a Macd aka upper band and lower bandBULLISH DIVERGENCE = Equal <strong>to</strong> lower price pivots, and higher MacdPivots, and runs at the bot<strong>to</strong>m of the price.DIVERGENCE = A difference or a disagreement between prices and Macd. Thisrepresents the potential of a trend change or significant bounce.EXT = An “extreme” pivot that happens at or beyond the Outer Bands.FIBONACCI = Areas of Support and Resistance where a bounce and potential reversalcan be anticipated with supporting indica<strong>to</strong>rs.FIBONACCI AREA/MIDBAND BREAKING = When there is a breakout of the area,and that indica<strong>to</strong>r will change colors.STACKED AREA = An area for a bounce or trade setup.LARGE TRIGGERS = Represent the overall trend of the market.LONG = Taking a trade in anticipation of the market going up.MACD BB LINES = Green, red, and white dots are the Macd calculations.MACD BB SLIDE = A sliding along the Bollinger Band will assist in judging thecontinuation of the current trend.MACD BB TREND = When the Macd BBs cross the upper Bollinger Band, the Macd Trend isup. When the Macd BBs cross the lower Bollinger Band, the Macd Trend is down.MACDS = Stands for moving average, convergence, Divergence.ONE TO ONES = Useful as intermediate Support or Resistance - white and magentadots on the chart. More powerful when combined with other indica<strong>to</strong>rs or on largercharts.RETRACEMENT DIVERGENCE = A discrepancy between the retracementpercentage in price verus the same retracement percentage on the Macd BB lines31
SHORT = Taking a trade in anticipation of the market going down.SMALL TRIGGERS = Represent the short-term expected outcome of themarket.SPRING LOADED (Macd bb lines) – refers <strong>to</strong> the Bollinger bands tightly compressedaround the Macd BB dots and building up power for a “breakout” pop in a direction.STOPS = Protection if the market goes against a trade.TARGETS = Area for potential positive exit.TREND BANDS = A channel for the market, also known as the Keltner-ChannelTREND TRADES = A trade taken when the trend is expected <strong>to</strong> continue.ZERO LINE = The straight line that runs horizontally through the Macd BBs andBollinger Bands with a value of 0.00.ZLR = Zero Line Rejection, or a bounce off of the Zero Line.32
T-3 Revolution Strategy / Indica<strong>to</strong>r <strong>user</strong> Guide.Please read and understand the following disclaimers before proceeding:Futures, FX and SECURITIES and or options trading involve substantial risk. The valuation of futures andoptions may fluctuate, and as a result, clients may lose more than their original investment. In no eventshould the content of Nexgen <strong>Software</strong> Services Website or <strong>Software</strong> be construed as an express of animplied promise, guarantee or implication by Nexgen <strong>Software</strong> Services that you will profit or thatlosses can or will be limited in any manner whatsoever. Past performance is not necessarily indicativeof future results. Information provided on this website, publication and or software program isintended solely for informative purposes and is obtained from sources believed <strong>to</strong> be reliable.Information is in no way guaranteed. No guarantee of any kind is implied or possible where projectionsof future conditions are attempted.No information accessed through this program (s) constitutes a recommendation by Nexgen <strong>Software</strong>Services <strong>to</strong> buy, sell or hold any security, financial product or instrument discussed therein. Thisinformation neither is, nor should be construed, as an offer, or a solicitation of an offer, <strong>to</strong> buy or sellsecurities by Nexgen <strong>Software</strong> Services. Nexgen <strong>Software</strong> Services does not offer or provide anyinvestment advice or opinion regarding the nature, potential, value, suitability, or profitability of anyparticular investment or investment strategy, and you shall be fully responsible for any investmentdecisions you make, and such decisions will be based solely on your evaluation of your financialcircumstances, investment objectives, risk <strong>to</strong>lerance, and liquidity needs.In using the T3 Revolution Strategy you will also need access <strong>to</strong> several other programs such asBloodhound by SharkIndica<strong>to</strong>rs.com, Ninja Trader , Data providers, Internet Connections, RenkoSpectrum Type Bars and any other program deemed necessary for its use. By using the T-3 FibsProTrader and the T3 Revolution Strategy you agree <strong>to</strong> hold harmless Nexgen <strong>Software</strong> Services andany of its agents for any failures caused by third party programs.Maintenance Fee – Nexgen will charge $499 Maintenance Fee every 6 months for the use of the T3Revolution Strategy. In accordance your passwords will only be active for 6 months after purchase and<strong>to</strong> receive new passwords you must make arrangements for the Maintenance fees.The CFTC requires the following disclosure statement in reference <strong>to</strong> hypothetical results.Please read and acknowledge this risk disclosure <strong>to</strong> proceeding. The risk of loss in trading commodityfutures contracts can be substantial. You should therefore carefully consider whether such trading issuitable for you in light of your financial condition. You may sustain a <strong>to</strong>tal loss of the initial marginfunds and any additional funds that you deposit with your broker <strong>to</strong> establish or maintain a position inthe commodity futures market.THE PERFORMANCE TABLES AND RESULTS OF THE TRADING SYSTEMS PRESENTED ARE HYPOTHETICALIN NATURE AND DOES NOT REPRESENT ACTUAL TRADING RESULTS.Required Warning!Hypothetical or simulated performance results have certain inherent limitations. Unlike an actualperformance record, simulated results do not represent actual trading. Also, since the trades have notactually been executed, the results may have under- or over-compensated for the impact, if any, of33
certain market fac<strong>to</strong>rs, such as lack of liquidity. Simulated trading programs in general are also subject<strong>to</strong> the fact that they are designed with the benefit of hindsight. No representation is being made thatany account will or is likely <strong>to</strong> achieve profits or losses similar <strong>to</strong> those shown.HYPOTHETICAL PERFORMANCE RESULTS HAVE MANY INHERENT LIMITATIONS, SOME OF WHICH AREDESCRIBED BELOW. NO REPRESENTATION IS BEING MADE THAT ANY ACCOUNT WILL OR IS LIKELY TOACHIEVE PROFITS OR LOSSES SIMILAR TO THOSE SHOWN. IN FACT, THERE ARE FREQUENTLY SHARPDIFFERENCES BETWEEN HYPOTHETICAL PERFORMANCE RESULTS AND THE ACTUAL RESULTSSUBSEQUENTLY ACHIEVED BY ANY PARTICULAR TRADING PROGRAM.ONE OF THE LIMITATIONS OF HYPOTHETICAL PERFORMANCE RESULTS IS THAT THEY ARE GENERALLYPREPARED WITH THE BENEFIT OF HINDSIGHT. IN ADDITION, HYPOTHETICAL TRADING DOES NOTINVOLVE FINANCIAL RISK, AND NO HYPOTHETICAL TRADING RECORD CAN COMPLETELY ACCOUNT FORTHE IMPACT OF FINANCIAL RISK IN ACTUAL TRADING. FOR EXAMPLE, THE ABILITY TO WITHSTANDLOSSES OR TO ADHERE TO A PARTICULAR TRADING PROGRAM IN SPITE OF TRADING LOSSES AREMATERIAL POINTS WHICH CAN ALSO ADVERSELY AFFECT ACTUAL TRADING RESULTS. THERE ARENUMEROUS OTHER FACTORS RELATED TO THE MARKETS IN GENERAL OR TO THE IMPLEMENTATION OFANY SPECIFIC TRADING PROGRAM WHICH CANNOT BE FULLY ACCOUNTED FOR IN THE PREPARATIONOF HYPOTHETICAL PERFORMANCE RESULTS AND ALL OF WHICH CAN ADVERSELY AFFECT ACTUALTRADING RESULTS.34
First, everyone at Nexgen <strong>Software</strong> Services would like <strong>to</strong> thank you for your interest inour T3 Revolution and T3 Fibs ProTrader au<strong>to</strong>mated platform.We have designed this platform <strong>to</strong> help you immediately see potential trade setupsgenerated by the software, and <strong>to</strong> give you a robust platform that you can grow with yourexperience and personal trading plan.INSTALLATION OF THE SOFTWARE:All installations will be conducted by Nexgen Technical Support. Please contact thendirectly at 281-419-2110 or techsupport@nexgent3.com if you wish <strong>to</strong> be installed.There are MANY programs and moving parts <strong>to</strong> make our software run and we want <strong>to</strong>make sure you are installed properly the first time so you can immediately use theprograms.RUNNING THE SOFTWARE THE FIRST TIME :Click the Ninja Trader Icon on your desk<strong>to</strong>pThis will open the Ninja Trader charting application and will open any pre-loadedworkspaces that the technical support dept. has loaded for you.You will see a control center and a couple of charts:35
For manual trading on the charts using just indica<strong>to</strong>rs you will need <strong>to</strong> turn ON the charttrader feature and use the ARROW drop down box <strong>to</strong> open the order entry screen.36
To Turn on or APPLY the T3 Revolution Strategy, right click on your chart, and thenclick “strategies “. Highlight T3 Revolution Strategy or if already on your workspaceyou may format this strategy from the dialog box on the right.37
BLOODHOUND in<strong>to</strong> REVOLUTION:We have integrated www.sharkindica<strong>to</strong>rs.com Bloodhound software in<strong>to</strong> the Revolutionso that we can build new signals, templates, filters and have the power of multipletimeframes in use with our strategy. Here are the inputs and meanings:• TEMPLATE is the Nexgen supplied logic templates the Revolution will use forsignals.• Confidence Use Compare – MUST ALWAYS BE TRUE or NO SIGNALS!• 13: Use Bloodhound Filter – TRUE = revolution signals will be filtered by theTrade filter - FALSE – no filtering will be applied.• 14 Rev Filter Template – specifies which template is being used by the 3Revolution Signals- Trend Trade , Momentum Trade and Trend ContinuationTrade• 15 Bloodhound Entry Template - This is a 4 th signal that the Revolutionplatform will generate based on bloodhound only logic that Nexgen Creates orYou Create. We have supplied you with a Fibonacci Counter Trend Signal bydefault.- Confidence compare ratioThe following inputs are not used and should not be changed.- Long threshold- Short threshold- Show Racing stripes38
Parameters‣ 01- Show his<strong>to</strong>rical Trades – if False speeds up loading – Set <strong>to</strong> TRUE <strong>to</strong>study the his<strong>to</strong>rical signals generated by the software.‣ 02- This will allow you <strong>to</strong> manipulate the live orders on the chart, entries ,s<strong>to</strong>ps , and targets.‣ 03- Set number of contracts for first profit target‣ 04- Set number of contracts for second profit target‣ 05 – This input sets a FIXED DOLLAR STOP – if the preset s<strong>to</strong>ps in theRevolution which are dynamic is risking LESS than your FIXED DOLLARSTOP then the lesser of the two amounts will be used by the system. IF set <strong>to</strong>“0” then only the Revolution s<strong>to</strong>ps will be used.‣ 06- Fixed Dollar Target – you can set this <strong>to</strong> any number. You will haveoptions later <strong>to</strong> take profit AT a fixed target or dynamic target or <strong>to</strong> engage atrailing s<strong>to</strong>p once that target is hit.‣ 07- This setting allows you <strong>to</strong> adjust at what time the system will start takingtrades.‣ 08- This setting will allow you <strong>to</strong> adjust when the system will s<strong>to</strong>p takingtrades.‣ 09- IF TRUE – The program will generate a limit order a number of ticksfrom the close of the “Signal Bar”. – 2 will be 2 ticks LOWER than close if along signal is generated , OR will be 2 ticks HIGHER if a short signal isgenerated. IF FALSE a market order will be used for entry.‣ 10- Number of ticks <strong>to</strong> offset a limit order entry.‣ 11- Number of “bars” the limit order has <strong>to</strong> get filled before the systemcancels the orders au<strong>to</strong>matically.‣ 12- <strong>to</strong> allow reversals in position this must be set <strong>to</strong> true , it is false bydefault.‣ Ztemplate Save and Load are DEFAULTS TO PUSH INDICATORS TOCHARTS NO CHANGES WILL EVER BE NEEDED.39
Revolution Parameters:‣ 16- Turns ON / OFF the momentum signal “0” = OFF “1” = ACTIVE‣ 17- Turns ON / OFF the Trend Trade signal “0” = OFF “1” = ACTIVE‣ 18- Turns ON / OFF the Continuation signal “0” = OFF “1” = ACTIVE‣ 19- Turns ON / OFF the BLOODHOUND BASED LOGIC signal “0” = OFF“1” = ACTIVE‣ 20- IF ZERO no filter- If there is any number then the program will not generatea signal if you are X TICKS away from the Revolution Profit Target #1.‣ 21- if TRUE the program will trail s<strong>to</strong>p tightly once you reach profit target #1‣ 22- if TRUE the program will trail s<strong>to</strong>p tightly once you reach profit target #2‣ 23- if TRUE the program will trail s<strong>to</strong>p tightly once you reach your PRESETFIXED PROFIT TARGET ( #6 input) from previous section‣ 24- If true – yellow revolution arrow will plot – if false the arrow will notplot but trade information will still be plotted.40
ContinuedFib_Timeframes(10) - number of timeframes analyzed (1-10 range)Fib_Au<strong>to</strong>FluSetting (22) - First number is Range <strong>to</strong> look for Confluences the higherthe number the larger the range (2-4 Usable ) . The Second number is how aggressively<strong>to</strong> "collapse" weaker Fibonacci areas ( 1= Smallest - 4 = Largest usable).Typically this setting should always remain " 22" or "32 " in our experienceFib_CollapseMarginTicks (0), 0 means is au<strong>to</strong>-calculated (above input) or you canmanually set how many ticks you wish <strong>to</strong> use as a filter. 1 =smallest - 1,000 ... when youuse smaller charts Au<strong>to</strong> Settings usually work well. If you use Daily charts or largertimeframe charts depending on the market you will need <strong>to</strong> make that numberconsiderably higher. For example a s<strong>to</strong>ck that trades in a large range like Google mayneed 300 as a setting- that would mean you are collapsing fibs within a 3 dollar range or (300 of the smallest increment the instrument trades in). When in doubt LEAVE at “0”.Fib_NdaysBack (90), number of days back <strong>to</strong> start fibs analysis for each - So if yourchart has 30 days the fibs will only use all the data if set <strong>to</strong> 90. This number may need <strong>to</strong>be in the hundreds if looking at High Timeframe bars. Note- the first 90 days of the anychart will use all data available until it reaches Ndays. So a bigger number is OKFib_UpdatePeriod (1440), How often in minutes your chart will update theAu<strong>to</strong>mated Fibonacci lines. 360 = every 360 minutes. If you use Daily charts you maywish for your update period <strong>to</strong> be once per week. In that case a (-) negative number isused <strong>to</strong> make the program use DAYS and not minutes. (-14) would be every two weeks.When using Negative numbers you can also specify the DAY of the week <strong>to</strong> update thefibs expressed as a 1-5 representing Monday through Friday. So if you set it <strong>to</strong> -7.5 theFibs will recalculate after every Friday Once per week. If it is set <strong>to</strong> -14.2 the Fibs willrecalculate on Tuesday every other week.USEHITSUPHITRESFILTER- if you are <strong>to</strong>uching or withingNUMTICKS<strong>to</strong>StackORFIB ticks away the program will not generate a signal.41
S<strong>to</strong>p SensSF – how wide of an average range the program will use for Trailing s<strong>to</strong>ps.Generally the wider the number the larger the s<strong>to</strong>ps.Ticks <strong>to</strong> Trail - How many ticks behind a potential NEW BAR you wish <strong>to</strong> trail thes<strong>to</strong>p.MinPivotRange – NOT USED AT THIS TIME and is a placeholder for a later signal.42
General Inputs‣Account - Select your Simula<strong>to</strong>r or LIVE ACCOUNT from this drop downmenu‣ Calculate on bar close – THIS MUST ALWAYS BE TRUE –‣ ENABLED – By default this will always come up as FALSE as a safeguard fromunwanted or unexpected trading. You must ALWAYS set this <strong>to</strong> true in order <strong>to</strong>activate the signals generated by the system.‣ Input Series show your data and bar size‣ Label show the name of the strategy‣ Max bars look back – default at 256 no reasy <strong>to</strong> change‣ Min bars required is 20 and no changes needed.HISTORICAL FILL PROCESSING –Fill Type - Default is either MARKET ORDER or you may select RENKO which is asecond type we wrote specifically for testing market order on Renko Spectrum type bars<strong>to</strong> give you a fill at the close of prior bar and one tick WORSE.Slippage is a number of ticks you may add in on your testing.43
Final Inputs:By default we have not changed any of these.44
For your first test of the signals, please use the following settings as a general <strong>guide</strong>.The purpose of these settings is <strong>to</strong> show you the signals and get you out of a tradeimmediately if the market turns against your position. The results are not as important asthe quality of the entry signals initially as we will be teaching you in our classes aboutmanagement of the setups once you are in.45
You will end up with a chart that looks like this. You will see entry signals and trailings<strong>to</strong>ps marked on your charts. You will also see entry and exit prices on your charts.You will notice on the side bar something that is similar <strong>to</strong> the chart trader properties.This will allow you with one click <strong>to</strong> DISABLE your system (such as prior <strong>to</strong> a newsevent) or <strong>to</strong> cancel a limit order working for entry or <strong>to</strong> exit an existing position)46
To change the size of your bars on the chart or <strong>to</strong> remove the Ninja text plots for entriesand exits right click on your chart and select data series.From this screen you can change bar size , type or remove plot execution markers. (remember we plot them <strong>to</strong>o with real fills so you don’t need them twice )47
On your charts you will notice Arrows that are generated by the Revolution. Some of thearrows will be taken as system trades if the filters allow. When the trade rules are metbut s<strong>to</strong>pped by filters the arrows will plot, however no system trades will be taken.All trailing s<strong>to</strong>ps will be “marked “by a blue line regardless if the system moved it, oryou did. This will allow you <strong>to</strong> take pictures of your setups and real world managementand it will help us assist you in our educational classes.48
To view his<strong>to</strong>rical performance numbers simply right click on the chart, and selecthis<strong>to</strong>rical performance and then His<strong>to</strong>rical and Real time.This will bring up a report for the trades from your data sample period. You can alter itin currency and percentage. Keep in mind this is 30 days on CL 2 contracts for 24 hours.49
To adjust inputs while a strategy is running you must first right click on the chart anddisable the strategy from the strategy menu. Select ENABLED <strong>to</strong> FALSE and APPLY.50
Once the strategy is disabled, your inputs will become available for you <strong>to</strong> change as youwish. REMEMBER TO ENABLE IT AGAIN when you would like <strong>to</strong> make it active.51
SAVE YOUR WORK! EARLY AND OFTEN!To save your workspace click FILE > WORKSPACE > SAVE WORKSPACETo close the Ninja Trader Platform, use FILE EXIT menu and save again.When you open Ninja Trader whatever workspace was active, will be the activeworkspace when you open ninja again.For a list of simple Ninja Trader tu<strong>to</strong>rial videos that will be very helpfulfor you with basic Ninja Trader functions.http://www.ninjatrader.com/support/helpGuides/nt7/index.html?video_library.htm52
For a quick start with his<strong>to</strong>rical strategy analyzer if you wish <strong>to</strong> do more comprehensivetesting. From the start menu, click FILE NEW STRATEGY ANALYZER.MAKE SURE YOU SELECT (HIGHLIGHT) ONLY ONE MARKET OR IT WILLTEST THEM ALL!!!! This will pretty much end your day and your computer’s happytime. So be careful.53
Using the Bloodhound Indica<strong>to</strong>r so you can “SEE “what is going on with filters andsignals.From your chart you will want <strong>to</strong> insert the Si Bloodhound indica<strong>to</strong>rs by right clicking ona chart and selecting indica<strong>to</strong>rs, scroll down <strong>to</strong> Si Bloodhound and add new. Then youwill need <strong>to</strong> SELECT the <strong>NEXGEN</strong> TEMPLATE FOR THE TOP INPUT.54
Once you say OK, OK and OK then the software will calculate and your charts will beblank for a while depending on your computer speed. SELECT THE LOGIC, EITHERENTRY RULES OR FILTER YOU WISH TO SEE.You will end up with a chart like this with the revolution filter logic selected. Minimizethe SUB-GRAPHS as you don’t need them.55
Also, you can see that if you select the Higher Timeframe Fibonacci Trade Logic in theSiBloodhound indica<strong>to</strong>r, that is the same template we have in our strategy and you cansee the correlation on the charts.For our Boxed strategies, if you wish <strong>to</strong> alter the higher timeframe chart you can click onthe Bloodhound Template at the <strong>to</strong>p <strong>to</strong> open a dialog box and highlight the highertimeframe and you can make changes here.56
For more bloodhound documentation and for videos and tu<strong>to</strong>rials you may visit thefollowing site. http://www.sharkindica<strong>to</strong>rs.com/documentation/57
THE REAL WORLD!!At Nexgen we have taught traders <strong>to</strong> use and read our software for 13 years. Thepurpose of this au<strong>to</strong>mated program and bloodhound integration is NOT <strong>to</strong> make you gobrain dead! Please do not! Always ask question in our educational room!Our goal is <strong>to</strong> give you a LIGHT YEARS head start with solid signals and a platform thatyou can use <strong>to</strong> start making your trading plan come true as quickly as possible. There isNO SUBSTITUTE FOR COMMON SENSE!Please take the time <strong>to</strong> learn our trading setup rules, learn when you have the bestadvantages over the market and how <strong>to</strong> manage your trades properly and we believe youwill have a long healthy life with your Nexgen software. See www.nexgent3.comfor rules and videos on setups and ranking of trade setups.Here is how we will run it in the room, a $150 per contract s<strong>to</strong>p and $300 dollar profittarget and a limit entry with a 2 tick pullback. This way we can manage our entries andmove the limit <strong>to</strong> become a market order OR let the market pull back <strong>to</strong> our entry. Alsowe can then move our s<strong>to</strong>ps, targets and exits by simply dragging and dropping the ordersas they appear on the screen. Please join us in our Hotcomm room <strong>to</strong> see how this isdone in a live market environment from 8 am – 11 am Central timeThank you again for your time and we look forward <strong>to</strong> helping you reach your goals.John Novak – Developer and all of the Nexgen staff.58
www.nexgent3.com42 Hunnewell Way The Woodlands TX 77382Tel : 281-419-2010info@nexgent3.comJOIN THE <strong>NEXGEN</strong> REVOLUTION TODAY!RevolutionT-3 Fibs Pro Trader


