MacD_Histogram_4r1g_.. - ChartNexus
MacD_Histogram_4r1g_.. - ChartNexus
MacD_Histogram_4r1g_.. - ChartNexus

Create successful ePaper yourself
Turn your PDF publications into a flip-book with our unique Google optimized e-Paper software.
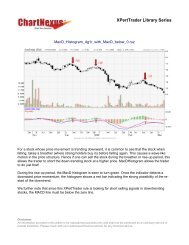
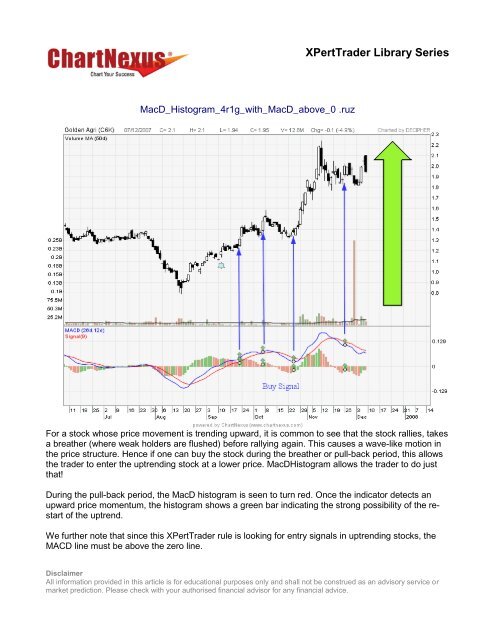
XPertTrader Library Series<strong>MacD</strong>_<strong>Histogram</strong>_<strong>4r1g</strong>_with_<strong>MacD</strong>_above_0 .ruzFor a stock whose price movement is trending upward, it is common to see that the stock rallies, takesa breather (where weak holders are flushed) before rallying again. This causes a wave-like motion inthe price structure. Hence if one can buy the stock during the breather or pull-back period, this allowsthe trader to enter the uptrending stock at a lower price. <strong>MacD</strong><strong>Histogram</strong> allows the trader to do justthat!During the pull-back period, the <strong>MacD</strong> histogram is seen to turn red. Once the indicator detects anupward price momentum, the histogram shows a green bar indicating the strong possibility of the restartof the uptrend.We further note that since this XPertTrader rule is looking for entry signals in uptrending stocks, theMACD line must be above the zero line.DisclaimerAll information provided in this article is for educational purposes only and shall not be construed as an advisory service ormarket prediction. Please check with your authorised financial advisor for any financial advice.
XPertTrader Library Series‣ In the XPertTrader Library, look for<strong>MacD</strong>_Histrogram_<strong>4r1g</strong>_with_<strong>MacD</strong>_above_0.ruz‣ Download this rule.The rule has been configured to track thefollowing:a) <strong>MacD</strong> in Specified Range: this rule filtersstocks with <strong>MacD</strong> line above the zeroreference line.b) <strong>MacD</strong> <strong>Histogram</strong> Cycle: this rule filtersstocks when a green histogram bar occursafter a series of red histogram bar.DisclaimerAll information provided in this article is for educational purposes only and shall not be construed as an advisory service ormarket prediction. Please check with your authorised financial advisor for any financial advice.
XPertTrader Library SeriesUnder the MACD in Specified Range indicator, weconfigured the parameters to the following :‣ Short Period =12‣ Long Period = 26‣ Signal Period = 9‣ „m‟ =1‣ Rule Type = Daily‣ Data Type = CompletedUnder the MACD <strong>Histogram</strong> Cycle Indicator, weconfigured the parameters to the following :‣ Short Period = 12‣ Long Period = 26‣ Signal Period = 9‣ „r‟ = 4‣ „g‟ = 1‣ Rule type = Daily‣ Data Type = CompletedYou may refer to the XPertTrader Quick Start Manual to learn more about the settings andconfigurations. Otherwise, you may view our tutorial video athttp://www.chartnexus.com/support/tutorials/xperttrader/DisclaimerAll information provided in this article is for educational purposes only and shall not be construed as an advisory service ormarket prediction. Please check with your authorised financial advisor for any financial advice.
XPertTrader Library SeriesIn the Stocks Screener taba) Select “<strong>MacD</strong>_Histrogram_<strong>4r1g</strong>_with_<strong>MacD</strong>_above_0.ruz” in the Select Screening Rulessectionb) Select apply rules to “Buy Signal”c) Click start screeningDownload your FREE professional charting software or find out how to automate your stockselection.DisclaimerAll information provided in this article is for educational purposes only and shall not be construed as an advisory service ormarket prediction. Please check with your authorised financial advisor for any financial advice.