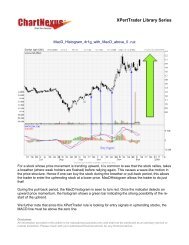
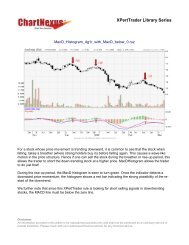
highest and lowest price attained during thespecified period. The value of %D is derived fromtaking the moving average of %K (where the periodof the moving average is commonly set at 3 days).This is also known as the fast Stochastic, %K (fast)and %D (fast). However, the fast Stochastic’sreaction to the price action causes many frequentsignals which then lead to the creation of manyfalse buy/sell signals. Hence, in order to renderthe signals more efficient, the slow Stochastic wasdeveloped. The %K (slow) line is the same as the%D (fast) line whilst the %D (slow) line is the 3days moving average of %K (slow) line. This istermed as the Full Stochastic Oscillator (Full STO)which consist of the %D (fast), %D (slow) and %K(full) and its uniqueness is the usage of “smoothingfactor” for the initial %K line to plot the %K (full)line. While it is important to know how an indicatoris built, this article will focus on the different waysthat Stochastic can be used to find meaningfulsignals.The most basic usage of Stochastic is in theCrossovers theories. A buy/sell signal is generatedwhen %K line crosses up/down %D linerespectively. However the crossover signalsproved to be quite unreliable as their occurrencesare quite frequent. A more reliable usage ofStochastic is in the divergence analysis. Noticethat when a price is making a higher high, theindicator should also be making a higher high whilea lower low in price should be accompanied by alower low in the indicator. However in scenarioswhere the price makes a higher high and theindicator fails to make a higher high or when theprice makes a lower low and the indicator fails tomake a lower low, a divergence is said to havetaken place, the former being termed a bearishdivergence and the latter a bullish divergence.Figure 1:Bullish/BearishDivergences inOversold/Overbought regionFigure 2:Usage of Stochasticwith the GMMAindicatorcontinue on pg 42PULSES JUN 2007 41
from pg 41Figure 3: Use of Stochastic with Trendline AnalysisDuring the period of late September 2006 tomid October 2006, Noble’s stock price was in adown trend. However, Stochastic formed a bullishdivergence and near mid October 2006, a shorttermtrend reversal took place.On the other hand, during the period of March2007 to May 2007, the price engaged in a bullishrun but Stochastic showed sign of weakness byfailing to make higher highs with higher highs inprice. A bearish divergence occurred and soonafterward a downtrend followed.We can enhance the quality of the Stochasticdivergence signal with another indicator to increasethe probability of making a winning trade. A popularindicator that can be used together with theStochastic bullish/bearish divergence is the GuppyMultiple Moving Average (GMMA) which wasdeveloped by Daryl Guppy. GMMA is a powerfulindicator used to understand the nature andcharacter of the trend and it is made up of twosets of exponential moving average (EMA) lines -the shorter-term EMA and the longer-term EMA.The shorter-term EMA are made up of3,5,8,10,12,15 days EMA lines and the longertermEMA are made up of 30,35,40,45,50,60 daysEMA lines. Let us re-visit the earlier chart (Figure1) which illustrated the bullish divergence inOctober 2006. An analysis of the GMMA in Figure2 shows that a crossing up of the shorter-termEMA lines over the longer-term EMA took placearound the 16th October 2006 thereby confirmingthe bullish signal generated by the Stochasticbullish divergence.Instead of using another indicator to confirmthe Stochastic signal, we may use trendlineanalysis to do that. Figure 3 illustrates the usageof trendline analysis to confirm the bearishdivergence in Stochastic. The blue uptrend linesupported the increase in price from $1.27 to$1.80 in the period of March 2007 to early May2007. However the price broke down the uptrendline in late April 2007 and failed in its attempt tomove back up on 7th May 2007. Coupled withthe bearish divergence in Stochastic, this gave astrong indication of an impending trend reversal.This article has highlighted the importance ofhaving a clear timing strategy when trading thestock market. A powerful indicator in technicalanalysis is Stochastic, a momentum indicator bestused to identify bullish and bearish divergenceswhich are signals that warn of an impending trendreversal. To increase the reliability of divergencesignals, a different indicator or trendline analysismay be used. ■<strong>STRATEGIES</strong> <strong>USING</strong> CHART FORMATIONSChart formations such as Double Bottom, Cup & Handle, Head & Shoulder, DoubleTop give powerful bullish and bearish signals. Combining this field of TA with technicalindicators greatly increases the probability of the trading signals being right.Sign up for this seminar where chart formations and the market psychology behindthem will be introduced.Date : 19 July 2007 (Thursday)Time : 7:00pm – 9:00pmVenue : SGX Auditorium, Level 2, SGX Centre 1,2 Shenton Way, Singapore 068804 (Next to Lau Pa Sat)Course fee : S$20A dinner reception will be held for all the participants. To register or to find out moreinformation about this event, please visit http://www.chartnexus.com/eventsor contact us at (65) 64911453 / 6491145442 PULSES JUN 2007