MacD_Histogram_4g1r_.. - ChartNexus
MacD_Histogram_4g1r_.. - ChartNexus
MacD_Histogram_4g1r_.. - ChartNexus

You also want an ePaper? Increase the reach of your titles
YUMPU automatically turns print PDFs into web optimized ePapers that Google loves.
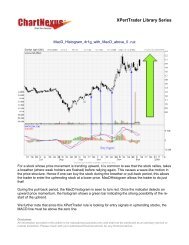
XPertTrader Library Series<strong>MacD</strong>_<strong>Histogram</strong>_<strong>4g1r</strong>_with_<strong>MacD</strong>_below_0.ruzFor a stock whose price movement is trending downward, it is common to see that the stock whenfalling, takes a breather (where strong holders buy in) before falling again. This causes a wave-likemotion in the price structure. Hence if one can sell the stock during the breather or rise-up period, thisallows the trader to short the down-trending stock at a higher price. <strong>MacD</strong><strong>Histogram</strong> allows the traderto do just that!During the rise-up period, the <strong>MacD</strong> histogram is seen to turn green. Once the indicator detects adownward price momentum, the histogram shows a red bar indicating the strong possibility of the restartof the downtrend.We further note that since this XPertTrader rule is looking for short selling signals in downtrendingstocks, the MACD line must be below the zero line.DisclaimerAll information provided in this article is for educational purposes only and shall not be construed as an advisory service ormarket prediction. Please check with your authorised financial advisor for any financial advice.
XPertTrader Library Series‣ In the XPertTrader Library, look for<strong>MacD</strong>_Histrogram_<strong>4g1r</strong>_with_<strong>MacD</strong>_below_0.ruz‣ Download this rule.The rule has been configured to track thefollowing:a) <strong>MacD</strong> <strong>Histogram</strong> Cycle: this rule filtersstocks when a red histogram bar occursafter a series of green histogram bar.b) <strong>MacD</strong> in Specified Range: this rule filtersstocks with <strong>MacD</strong> line below the zeroreference line.DisclaimerAll information provided in this article is for educational purposes only and shall not be construed as an advisory service ormarket prediction. Please check with your authorised financial advisor for any financial advice.
XPertTrader Library SeriesUnder the MACD <strong>Histogram</strong> Cycle Indicator, weconfigured the parameters to the following :‣ Short Period = 12‣ Long Period = 26‣ Signal Period = 9‣ „r‟ = 1‣ „g‟ = 4‣ Rule type = Daily‣ Data Type = CompletedUnder the MACD in Specified Range indicator, weconfigured the parameters to the following :‣ Short Period =12‣ Long Period = 26‣ Signal Period = 9‣ „m‟ = 0‣ Rule Type = Daily‣ Data Type = CompletedYou may refer to the XPertTrader Quick Start Manual to learn more about the settings andconfigurations. Otherwise, you may view our tutorial video athttp://www.chartnexus.com/support/tutorials/xperttrader/DisclaimerAll information provided in this article is for educational purposes only and shall not be construed as an advisory service ormarket prediction. Please check with your authorised financial advisor for any financial advice.
XPertTrader Library SeriesIn the Stocks Screener taba) Select “<strong>MacD</strong>_Histrogram_<strong>4g1r</strong>_with_<strong>MacD</strong>_below_0.ruz” in the Select Screening Rulessectionb) Select apply rules to “Sell Signal”c) Click start screeningDownload your FREE professional charting software or find out how to automate your stockselection.DisclaimerAll information provided in this article is for educational purposes only and shall not be construed as an advisory service ormarket prediction. Please check with your authorised financial advisor for any financial advice.