CLINICAL EEG and NEUROSCIENCE - Dynamic Memory Lab
CLINICAL EEG and NEUROSCIENCE - Dynamic Memory Lab
CLINICAL EEG and NEUROSCIENCE - Dynamic Memory Lab

You also want an ePaper? Increase the reach of your titles
YUMPU automatically turns print PDFs into web optimized ePapers that Google loves.
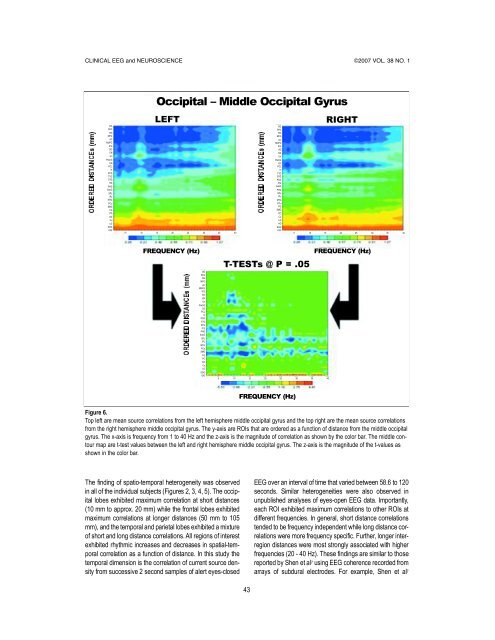
<strong>CLINICAL</strong> <strong>EEG</strong> <strong>and</strong> <strong>NEUROSCIENCE</strong> ©2007 VOL. 38 NO. 1Occipital – Middle Occipital Gyru sLEFTRIGHTOGSFGOGSFGRGRGMFGMFGACMidFGACMidFGIFGIFGSGSGENENUnUnPreCGPreCGCGCGPCLPCLInInPCGTTGTTGSTGSTGPCGITGITGPHGSubGSubGPHGSPLSPLIPLIPLMTGMTGPCuPCuSMGFGFGSMGPCPCAGCuCuLGLGAGSOGSOGIOG5 10 15 20 25 30 35 40IOG5 10 15 20 25 30 35 40F R E QUENCY (Hz)F R E QUENCY (Hz)T-TESTs @ P = .05OGSFGRGMFGACMidFGIFGSGENUnPreCGCGPCLInPCGTTGSTGITGPHGSubGSPLIPLMTGPCuSMGFGPCAGCuLGSOGIOG5 10 15 20 25 30 35 40F R E QUENCY (Hz)Figure 6.Top left are mean source correlations from the left hemisphere middle occipital gyrus <strong>and</strong> the top right are the mean source correlationsfrom the right hemisphere middle occipital gyrus. The y-axis are ROIs that are ordered as a function of distance from the middle occipitalgyrus. The x-axis is frequency from 1 to 40 Hz <strong>and</strong> the z-axis is the magnitude of correlation as shown by the color bar. The middle contourmap are t-test values between the left <strong>and</strong> right hemisphere middle occipital gyrus. The z-axis is the magnitude of the t-values asshown in the color bar.The finding of spatio-temporal heterogeneity was observedin all of the individual subjects (Figures 2, 3, 4, 5). The occipitallobes exhibited maximum correlation at short distances(10 mm to approx. 20 mm) while the frontal lobes exhibitedmaximum correlations at longer distances (50 mm to 105mm), <strong>and</strong> the temporal <strong>and</strong> parietal lobes exhibited a mixtureof short <strong>and</strong> long distance correlations. All regions of interestexhibited rhythmic increases <strong>and</strong> decreases in spatial-temporalcorrelation as a function of distance. In this study thetemporal dimension is the correlation of current source densityfrom successive 2 second samples of alert eyes-closed<strong>EEG</strong> over an interval of time that varied between 58.6 to 120seconds. Similar heterogeneities were also observed inunpublished analyses of eyes-open <strong>EEG</strong> data. Importantly,each ROI exhibited maximum correlations to other ROIs atd i fferent frequencies. In general, short distance correlationstended to be frequency independent while long distance correlationswere more frequency specific. Further, longer interregiondistances were most strongly associated with higherfrequencies (20 - 40 Hz). These findings are similar to thosereported by Shen et al 7 using <strong>EEG</strong> coherence recorded fromarrays of subdural electrodes. For example, Shen et al 743