Climatic Warming due to Overgrazing on the Tibetan Plateau
Climatic Warming due to Overgrazing on the Tibetan Plateau
Climatic Warming due to Overgrazing on the Tibetan Plateau

You also want an ePaper? Increase the reach of your titles
YUMPU automatically turns print PDFs into web optimized ePapers that Google loves.
沙 漠 研 究 22-1, 119 -122 (2012 )Journal of Arid Land Studies"ICAL 1 / DT X"-Refereed Paper-<str<strong>on</strong>g>Climatic</str<strong>on</strong>g> <str<strong>on</strong>g>Warming</str<strong>on</strong>g> <str<strong>on</strong>g>due</str<strong>on</strong>g> <str<strong>on</strong>g>to</str<strong>on</strong>g> <str<strong>on</strong>g>Overgrazing</str<strong>on</strong>g> <strong>on</strong> <strong>the</strong> <strong>Tibetan</strong> <strong>Plateau</strong>- An Example at Damxung in <strong>the</strong> Central Part of <strong>the</strong> <strong>Tibetan</strong> <strong>Plateau</strong> -Mingyuan DU* 1) , Seiichiro YONEMURA 1) , Xianzhou ZHANG 2) , Y<strong>on</strong>gtao HE 2) ,Jingshi LIU 3) and Shige<str<strong>on</strong>g>to</str<strong>on</strong>g> KAWASHIMA 4)Abstract: Many studies have shown that <strong>the</strong> increase in air temperature <strong>on</strong> <strong>the</strong> <strong>Tibetan</strong> <strong>Plateau</strong> is greater than that for <strong>the</strong> Nor<strong>the</strong>rnHemisphere and <strong>the</strong> same latitudinal z<strong>on</strong>e. Recent paper has pointed that this warming; especially warming in wintertime is clearer atlower altitude than at higher altitude <strong>on</strong> <strong>the</strong> <strong>Tibetan</strong> <strong>Plateau</strong> and <strong>the</strong> local envir<strong>on</strong>mental changes such as urbanizati<strong>on</strong> and land coverchange may play very important role for <strong>the</strong> geographical changes of recent climate warming. However, <strong>the</strong>re is no any c<strong>on</strong>creteevidence <str<strong>on</strong>g>to</str<strong>on</strong>g> support this hypo<strong>the</strong>sis. This paper identifies <strong>the</strong> relati<strong>on</strong>ship between overgrazing and climate warming at Damxung in<strong>the</strong> central part of <strong>the</strong> <strong>Tibetan</strong> <strong>Plateau</strong> by using recent 47 years data of Damxung meteorological observa<str<strong>on</strong>g>to</str<strong>on</strong>g>ry stati<strong>on</strong> and 5 yearsintensive observati<strong>on</strong>s data <strong>on</strong> a pasture <strong>on</strong> a mountain slope where overgrazing is occurred in <strong>the</strong> lower part of <strong>the</strong> slope.Meteorological data rec<strong>on</strong>structi<strong>on</strong> of <strong>the</strong> pasture is carried out by using <strong>the</strong> relati<strong>on</strong>ships between <strong>the</strong> observati<strong>on</strong> data <strong>on</strong> a pastureand <strong>the</strong> meteorological observa<str<strong>on</strong>g>to</str<strong>on</strong>g>ry’s data. Annual air temperature both at <strong>the</strong> meteorological observa<str<strong>on</strong>g>to</str<strong>on</strong>g>ry and at <strong>the</strong> overgrazedpasture has increased about 2 degrees during past 47 years and this extreme air temperature increasing at Damxung is mainly causedby <strong>the</strong> degradati<strong>on</strong> of grassland <str<strong>on</strong>g>due</str<strong>on</strong>g> <str<strong>on</strong>g>to</str<strong>on</strong>g> overgrazing. It provides evidence that degradati<strong>on</strong> of grassland <str<strong>on</strong>g>due</str<strong>on</strong>g> <str<strong>on</strong>g>to</str<strong>on</strong>g> overgrazing promote<strong>the</strong> climate warming and <strong>the</strong>reby <strong>the</strong> land and vegetati<strong>on</strong> degradati<strong>on</strong> process.Key Words: <str<strong>on</strong>g>Climatic</str<strong>on</strong>g> warming, Data rec<strong>on</strong>structi<strong>on</strong>, Land degradati<strong>on</strong>, <str<strong>on</strong>g>Overgrazing</str<strong>on</strong>g>, <strong>Tibetan</strong> <strong>Plateau</strong>.1. Introducti<strong>on</strong>It is well known that <strong>the</strong> <strong>the</strong>rmal and dynamical processesof <strong>Tibetan</strong> <strong>Plateau</strong> (TP) have a profound influence both <str<strong>on</strong>g>to</str<strong>on</strong>g>climate and <str<strong>on</strong>g>to</str<strong>on</strong>g> ecosystems of <strong>the</strong> Asian c<strong>on</strong>tinent and even <strong>the</strong>whole world. Research <strong>on</strong> <strong>the</strong> climate and cryosphericchange in <strong>the</strong> TP has received increasing attenti<strong>on</strong> sincemid-1970s as Kang et al. (2010) reviewed. Many worksshowed that <strong>the</strong> main porti<strong>on</strong> of <strong>the</strong> TP has experiencedstatistically significant warming since <strong>the</strong> mid-1950s,especially in winter, which exceed that of its surroundingregi<strong>on</strong>s (e.g. Liu and Chen, 2000, Du et al., 2004, Lu and Liu,2010). Most of <strong>the</strong> works assumed this is <strong>the</strong> global warmingeffects. However, Frauenfeld et al. (2005) pointed out that“The significant trends in stati<strong>on</strong> data may reflect <strong>the</strong> extensiveland use change and industrializati<strong>on</strong> that has occurred <strong>on</strong> <strong>the</strong><strong>Tibetan</strong> <strong>Plateau</strong>” because no trends are observed in ERA-40reanalysis data. Du et al. (2004, 2010) pointed thatdegradati<strong>on</strong> of grassland <strong>on</strong> <strong>the</strong> TP should have been affected<strong>the</strong> climate change <strong>on</strong> <strong>the</strong> TP and may be <strong>on</strong>e of <strong>the</strong> reas<strong>on</strong>swhy climate warming <strong>on</strong> <strong>the</strong> TP is greater than <strong>on</strong> o<strong>the</strong>r placesand why recent warming is clearer at lower altitude than athigher altitude <strong>on</strong> <strong>the</strong> TP. However, <strong>the</strong>re is no anyc<strong>on</strong>fidential evidence <str<strong>on</strong>g>to</str<strong>on</strong>g> support this hypo<strong>the</strong>sis <str<strong>on</strong>g>due</str<strong>on</strong>g> <str<strong>on</strong>g>to</str<strong>on</strong>g> lack ofdata. This paper is an attempt <str<strong>on</strong>g>to</str<strong>on</strong>g> clarify <strong>the</strong> relati<strong>on</strong>shipbetween overgrazing and climate warming at Damxung in <strong>the</strong>central part of <strong>the</strong> TP by using recent 47 years data ofDamxung meteorological observa<str<strong>on</strong>g>to</str<strong>on</strong>g>ry stati<strong>on</strong> and 5 yearsintensive observati<strong>on</strong>s data <strong>on</strong> <strong>the</strong> mountain slope pasture,where overgrazing is occurred in <strong>the</strong> lower part of <strong>the</strong> slope.2. Data and Methods2.1. Observati<strong>on</strong> site descripti<strong>on</strong>In order <str<strong>on</strong>g>to</str<strong>on</strong>g> clarify <strong>the</strong> local climate features, we haveselected a pasture <strong>on</strong> a south facing slope in <strong>the</strong> central part of<strong>the</strong> TP. Figure 1 shows <strong>the</strong> main <str<strong>on</strong>g>to</str<strong>on</strong>g>pography over <strong>the</strong> TP and<strong>the</strong> observati<strong>on</strong> sites. Damxung meteorological observa<str<strong>on</strong>g>to</str<strong>on</strong>g>rystati<strong>on</strong> is located near <strong>the</strong> small <str<strong>on</strong>g>to</str<strong>on</strong>g>wn Damxung in <strong>the</strong> valley(about 4280m a.s.l.). The low and middle part of <strong>the</strong>mountain slope (between 4300 m and 5200 m a.s.l.) is used aspastures, where overgrazing is occurred in <strong>the</strong> lower part (4300m <str<strong>on</strong>g>to</str<strong>on</strong>g> 4600 m) of <strong>the</strong> slope (Ohtsuka et al., 2008). We set up11 observati<strong>on</strong> stati<strong>on</strong>s <strong>on</strong> a south slope of MountNyainqentanglha as shown in Figure 1 (down) at Damxung(30º28-32’N,91º02-03’E) in 2005. One of <strong>the</strong> 11 stati<strong>on</strong>s is abasic au<str<strong>on</strong>g>to</str<strong>on</strong>g>matic stati<strong>on</strong> at about 4300 m in <strong>the</strong> valley. All <strong>the</strong>* Corresp<strong>on</strong>ding Author: dumy@affrc.go.jp3-1-3 Kann<strong>on</strong>dai, Tsukuba, Ibaraki, 305-8604 Japan1) Department of Agro-Meteorology, Nati<strong>on</strong>al Institute for Agro-Envir<strong>on</strong>mental Sciences, Japan2) Institute of Geographic Sciences and Natural Resources Research, Chinese Academy of Sciences, China3) Institute of <strong>Tibetan</strong> <strong>Plateau</strong>, Chinese Academy of Sciences, China4) Kyo<str<strong>on</strong>g>to</str<strong>on</strong>g> University, Japan
Fig. 2. Observed Air temperature variati<strong>on</strong> during 1962 <str<strong>on</strong>g>to</str<strong>on</strong>g> 2010 atDamxung.Fig. 1. The main <str<strong>on</strong>g>to</str<strong>on</strong>g>pography over <strong>the</strong> <strong>Tibetan</strong> <strong>Plateau</strong> (up) andobservati<strong>on</strong> stati<strong>on</strong>s (down). The <strong>Tibetan</strong> <strong>Plateau</strong> is shown as<strong>the</strong> shaded regi<strong>on</strong> where elevati<strong>on</strong> is higher than 3000 m a.s.l..Black c<strong>on</strong><str<strong>on</strong>g>to</str<strong>on</strong>g>ur lines show <str<strong>on</strong>g>to</str<strong>on</strong>g>pography with an interval of 1000 m(up) and 100 m (down). The triangles indicate <strong>the</strong> observati<strong>on</strong>stati<strong>on</strong>s.meteorological elements including short and l<strong>on</strong>g waveradiati<strong>on</strong>s, wind speed and directi<strong>on</strong>, air temperature andhumidity, soil temperature and water c<strong>on</strong>tent etc. weremeasured <strong>the</strong>re by using measurement system of CampbellScientific, Inc. Data were recorded with a data-logger(CR10X; CSI) at 30 min intervals. Measurement system <strong>on</strong><strong>the</strong> o<strong>the</strong>r 10 stati<strong>on</strong>s are Hobo wea<strong>the</strong>r stati<strong>on</strong>s (OnsetComputer Corporati<strong>on</strong>, Bourne, MA, USA) settled at 4300 m,4400 m, 4500 m, 4650 m, 4800 m, 4950 m, 5100 m, 5200 m,5300 m and 5530 m <strong>on</strong> a south slope. Stati<strong>on</strong>s at 4300 m arelocated <strong>on</strong> a wet land. Stati<strong>on</strong>s at 5300 m and 5530 m arelocated <strong>on</strong> a bare land and o<strong>the</strong>rs are located in <strong>the</strong> pasture.Air temperature and humidity at 2 m and soil temperature andsoil water c<strong>on</strong>tent at 5 cm, 20 cm and 50 cm are sampled at 1min intervals and <strong>the</strong> mean value were recorded with adata-logger at 30 min intervals. The air temperature datafrom August, 2005 <str<strong>on</strong>g>to</str<strong>on</strong>g> July, 2010 are used in this study.2.2. Data and methodDaily mean of air temperature (T), minimum andmaximum air temperature (Tmin and Tmax), air pressure (P),absolute and relative humidity (e and RH), low and <str<strong>on</strong>g>to</str<strong>on</strong>g>tal cloudamount (Cl and C), wind speed (V), surface temperature (Ts),precipitati<strong>on</strong> (Rain), sunshine hour (S) and pan evaporati<strong>on</strong>(Et) of <strong>the</strong> Damxung meteorological observa<str<strong>on</strong>g>to</str<strong>on</strong>g>ry stati<strong>on</strong> fromAugust 1, 1962 <str<strong>on</strong>g>to</str<strong>on</strong>g> June 30, 2009 are used.Stepwise linear regressi<strong>on</strong> method was used for gettingrelati<strong>on</strong>ship between daily mean air temperature <strong>on</strong> <strong>the</strong> slopeand <strong>the</strong> meteorological elements of <strong>the</strong> Damxungmeteorological observa<str<strong>on</strong>g>to</str<strong>on</strong>g>ry stati<strong>on</strong> by using SAS software(SAS institute inc., Cary, NC, USA) with t-test at statisticalsignificance determined at <strong>the</strong> P < 0.05 level. Due that <strong>the</strong>mechanism of local temperature varies for different seas<strong>on</strong>s,we get <strong>the</strong> relati<strong>on</strong>ships for each m<strong>on</strong>th. Therefore,Tcalij= aijk m+ ∑ = bk=1ijkwhere, Tcal ij is estimated air temperature for stati<strong>on</strong> i m<strong>on</strong>th j(i=1, 10; j=1, 12) . a ij and b ijk are regressi<strong>on</strong> coefficients ofstati<strong>on</strong> i m<strong>on</strong>th j for meteorological elements E k (E k =T, Tmax,Tmin, P, e, RH, Cl, C, V, Ts, Rain, S, Et).We assume that <strong>the</strong> relati<strong>on</strong>ship between daily mean airtemperature <strong>on</strong> <strong>the</strong> slope and <strong>the</strong> meteorological elements of<strong>the</strong> Damxung meteorological observa<str<strong>on</strong>g>to</str<strong>on</strong>g>ry should reflect <strong>the</strong>effects of land degradati<strong>on</strong> by overgrazing and may be <strong>the</strong>same in <strong>the</strong> past 47 years. Therefore, we can use <strong>the</strong>relati<strong>on</strong>ship <str<strong>on</strong>g>to</str<strong>on</strong>g> rec<strong>on</strong>struct <strong>the</strong> daily mean air temperatureduring 1962 <str<strong>on</strong>g>to</str<strong>on</strong>g> 2004 <strong>on</strong> <strong>the</strong> slope and <strong>the</strong>n <str<strong>on</strong>g>to</str<strong>on</strong>g> calculate <strong>the</strong> 18years mean temperature for 1962-1980 <str<strong>on</strong>g>due</str<strong>on</strong>g> <str<strong>on</strong>g>to</str<strong>on</strong>g> <strong>the</strong>re was almostno temperature increase during this period as shown in Figure2. Therefore, we can compare <strong>the</strong> temperature differencesbetween <strong>the</strong> observed mean of 2005 <str<strong>on</strong>g>to</str<strong>on</strong>g> 2010 and <strong>the</strong> estimatedmean of 1962-1980.3. Results and Discussi<strong>on</strong>3.1. Climate warming at DamxungAs shown in Figure 2, observed air temperature atDamxung meteorological observa<str<strong>on</strong>g>to</str<strong>on</strong>g>ry shows statisticallysignificant increase trend for each m<strong>on</strong>th, especially in wintertime (0.02°C /year in July and 0.087°C /year in January).Increase in daily minimum air temperature is clearer (0.022°C/year in July and 0.114°C /year in January). Annual airEk(1)
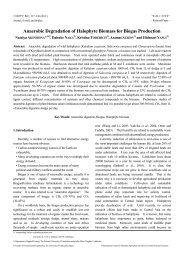
Fig. 3. Vertical distributi<strong>on</strong> of vegetati<strong>on</strong> coverage and root biomassal<strong>on</strong>g <strong>the</strong> south slope (redraw from Ohtsuka et al., 2008 and dataat 4300m is with pers<strong>on</strong>al communicati<strong>on</strong>)temperature at <strong>the</strong> meteorological observa<str<strong>on</strong>g>to</str<strong>on</strong>g>ry has increasedabout 2 degrees during past 47 years. This increase in airtemperature is higher than o<strong>the</strong>r places <strong>on</strong> <strong>the</strong> TP at similaraltitudes and surrounding area.3.2. <str<strong>on</strong>g>Overgrazing</str<strong>on</strong>g> and vegetati<strong>on</strong> cover changeFigure 3 shows <strong>the</strong> distributi<strong>on</strong> of vegetati<strong>on</strong> coverage andand relati<strong>on</strong> between root biomass and elevati<strong>on</strong> al<strong>on</strong>g <strong>the</strong>south slope in 2005. It can be seen that both vegetati<strong>on</strong>coverage and root biomass at <strong>the</strong> lower part of <strong>the</strong> slope(between 4400-4650 m a.s.l.) was smaller than that at <strong>the</strong>middle part of <strong>the</strong> slope and that in <strong>the</strong> valley (4300 m). Thisis <str<strong>on</strong>g>due</str<strong>on</strong>g> <str<strong>on</strong>g>to</str<strong>on</strong>g> <strong>the</strong> overgrazing <strong>the</strong>re. The middle part of <strong>the</strong> slopehas been used as summer pasture and <strong>the</strong> valley wet land hasbeen used as winter pasture, while <strong>the</strong> lower part of <strong>the</strong> slope isbeen used throughout a year because most of herdsmen areliving at <strong>the</strong> lower part of <strong>the</strong> slope. Interviews with <strong>the</strong>herdsmen let us know that this overgrazing was occurredaround 1980 and becoming more and more remarkable with<strong>the</strong> increase in lives<str<strong>on</strong>g>to</str<strong>on</strong>g>ck numbers as shown by Du et al. (2004).3.3. Air temperature distributi<strong>on</strong> al<strong>on</strong>g <strong>the</strong> slope and itschangesAs shown in Figure 4, observati<strong>on</strong> data (mean of 2005 <str<strong>on</strong>g>to</str<strong>on</strong>g>2010) al<strong>on</strong>g <strong>the</strong> slope shows a uniform lapse rate about 0.72ºC/100m al<strong>on</strong>g <strong>the</strong> slope, in summer seas<strong>on</strong>. This lapse rateis greater than that of averaged over <strong>the</strong> TP (Du et al., 2010).However, <strong>the</strong>re is an inversi<strong>on</strong> layer at lower part of slope(below 4800m) and a relatively larger lapse rate about 0.79ºC/100m at higher part of <strong>the</strong> slope in wintertime. This is <str<strong>on</strong>g>due</str<strong>on</strong>g><str<strong>on</strong>g>to</str<strong>on</strong>g> str<strong>on</strong>g radiati<strong>on</strong> cooling based <strong>on</strong> lower humidity and coldair run-off from a higher mountain regi<strong>on</strong> in<str<strong>on</strong>g>to</str<strong>on</strong>g> <strong>the</strong> valley by alocal circulati<strong>on</strong>, <strong>the</strong> air temperature in <strong>the</strong> valley becomeslower and lower during night in wintertime. This processoccurred and a temperature inversi<strong>on</strong> layer exited almos<str<strong>on</strong>g>to</str<strong>on</strong>g>ccurred everyday during wintertime as Du et al. (2009)Fig. 4. Observed and estimated air temperature variati<strong>on</strong> al<strong>on</strong>g <strong>the</strong>slope during 2005 <str<strong>on</strong>g>to</str<strong>on</strong>g> 2010 and 1962 <str<strong>on</strong>g>to</str<strong>on</strong>g> 1980.described. However, air temperature at <strong>the</strong> lower part of <strong>the</strong>slope is little bit higher than <strong>the</strong> lapse rate predicted (right up<strong>the</strong> lapse line shown in Figure 4) in summertime and higher inwinter partly <str<strong>on</strong>g>due</str<strong>on</strong>g> <str<strong>on</strong>g>to</str<strong>on</strong>g> <strong>the</strong> temperature inversi<strong>on</strong>.Figure 4 also shows <strong>the</strong> estimated mean temperature (1962-1980) distributi<strong>on</strong> al<strong>on</strong>g <strong>the</strong> slope. It shows a similardistributi<strong>on</strong> pattern as observed <strong>on</strong>e (mean of 2005 <str<strong>on</strong>g>to</str<strong>on</strong>g> 2010)with significant increase of air temperature throughout <strong>the</strong>slope, especially in January. However, <strong>the</strong>re is evidently highvalue of <strong>the</strong> temperature in <strong>the</strong> overgrazed lower part of <strong>the</strong>slope. Therefore, <strong>the</strong> lapse rate in summer changes from0.72ºC/100m <str<strong>on</strong>g>to</str<strong>on</strong>g> 0.69ºC/100 m. Although this value is stilllarger than that of averaged over <strong>the</strong> TP, this value can betreated as a natural envir<strong>on</strong>mental, which do not induced landdegradati<strong>on</strong>. Lapse rate at higher part of <strong>the</strong> slope changesfrom 0.79ºC/100m <str<strong>on</strong>g>to</str<strong>on</strong>g> 0.72ºC/100m in wintertime.3.4. Relati<strong>on</strong>ship between overgrazing and climatewarming at DamxungLand degradati<strong>on</strong> by overgrazing can affect climate change(e.g. Jacks<strong>on</strong> and Idso, 1975; Balling, 1998; Du, 1996).Many researchers have found that decrease in vegetati<strong>on</strong> coverreduces evapotranspirati<strong>on</strong> <strong>the</strong>reby allowing an increase inlocal temperature levels. Balling (1998) has revealed tha<str<strong>on</strong>g>to</str<strong>on</strong>g>vergrazing and c<strong>on</strong>sequently land degradati<strong>on</strong> in semiaridareas of nor<strong>the</strong>rn Mexico resulted in significantly airtemperatures increase both in nor<strong>the</strong>rn Mexico and in itsadjacent Ariz<strong>on</strong>a, USA. Damxung meteorologicalobserva<str<strong>on</strong>g>to</str<strong>on</strong>g>ry is located very near <str<strong>on</strong>g>to</str<strong>on</strong>g> <strong>the</strong> overgrazing pasture.Therefore, air temperature increase has coincided with <strong>the</strong>progress of overgrazing since 1980 as shown in Figure 2.Moreover, <strong>the</strong> land degradati<strong>on</strong> effect were reflected up<strong>on</strong>not <strong>on</strong>ly <strong>the</strong> air temperature but also all <strong>the</strong> observedmeteorological elements at Damxung meteorologicalobserva<str<strong>on</strong>g>to</str<strong>on</strong>g>ry. For example, humidity (e and RH) and cloudamount (C and Cl) have decreased and sunshine hour (S) has
Stati<strong>on</strong> &m<strong>on</strong>thTable 1. Comparis<strong>on</strong> of regressi<strong>on</strong> coefficients of stati<strong>on</strong> 4400 m and 5300 m.4400m Jan. -1.798 0.829 0.342P T Tmax Tmin e RH5300m Jan. -13.593 0.341 0.804 0.0364400m Jul. -58.451 0.094 0.768 0.1965300m Jul. -182.873 0.287 0.833 0.187 -0.337(C<strong>on</strong>tinue of Table 1.)Stati<strong>on</strong> &m<strong>on</strong>tha ijC Cl V Ts Rain S Et4400m Jan. -0.1825300m Jan. -0.266 -0.0864400m Jul. -0.0185300m Jul. 0.015 -0.027b ijb ijincreased slightly. Air temperature at <strong>the</strong> pasture andsurrounding area has been also affected by <strong>the</strong> land degradati<strong>on</strong>.These variati<strong>on</strong>s have effects <strong>on</strong> air temperature at differentarea of <strong>the</strong> slope pasture with <strong>the</strong> relati<strong>on</strong>ship obtained by <strong>the</strong>stepwise linear regressi<strong>on</strong>. Table 1 shows <strong>the</strong> comparis<strong>on</strong> ofregressi<strong>on</strong> coefficients for July and January of stati<strong>on</strong> 4400 mand stati<strong>on</strong> 5300 m. As shown in Table 1, despite <strong>the</strong>regressi<strong>on</strong> coefficients differences, <strong>the</strong>re are two moreelements (RH and S in January, Tmin and C in July) selectedfor stati<strong>on</strong> 5300 m. Since RH and C are decreased and Tminand S is increased and air temperature at 5300 m is directlyproporti<strong>on</strong>al <str<strong>on</strong>g>to</str<strong>on</strong>g> RH and C and inversely proporti<strong>on</strong>al <str<strong>on</strong>g>to</str<strong>on</strong>g> S andTmin, this is <strong>on</strong>e of <strong>the</strong> reas<strong>on</strong>s of increase amount of airtemperature at 5300 m is smaller than that at 4400 m.4. C<strong>on</strong>clusi<strong>on</strong> (or Recommendati<strong>on</strong>)Both observed air temperature at <strong>the</strong> meteorologicalobserva<str<strong>on</strong>g>to</str<strong>on</strong>g>ry and estimated air temperature at <strong>the</strong> overgrazedpasture at Damxung has increased about 2 degrees during past47 years and this extreme air temperature increase is mainlycaused by <strong>the</strong> land degradati<strong>on</strong> <str<strong>on</strong>g>due</str<strong>on</strong>g> <str<strong>on</strong>g>to</str<strong>on</strong>g> overgrazing byfollowing reas<strong>on</strong>s.(1) 47 years observed air temperature at <strong>the</strong> meteorologicalobserva<str<strong>on</strong>g>to</str<strong>on</strong>g>ry has increased since 1980 which coincideswith <strong>the</strong> progress of <strong>the</strong> overgrazing.(2) 5 year observed air temperature at <strong>the</strong> pasture showsrelative higher value at <strong>the</strong> overgrazed area.(3) Estimated air temperature at <strong>the</strong> pasture shows moreincrease amount at <strong>the</strong> overgrazed area than o<strong>the</strong>r area.ReferencesBalling Jr. R.C., Klopatek J.M., Hildebrandt M.L., Moritz C.K.,Watts C.J. (1998): Impacts of land degradati<strong>on</strong> <strong>on</strong> his<str<strong>on</strong>g>to</str<strong>on</strong>g>ricaltemperature records from <strong>the</strong> S<strong>on</strong>oran Desert. <str<strong>on</strong>g>Climatic</str<strong>on</strong>g>Change, 40: 669– 681.Du M. (1996): Is it a global change impact that <strong>the</strong> climate isbecoming better in <strong>the</strong> western part of <strong>the</strong> arid regi<strong>on</strong> of China?Theor. Appl. Clima<str<strong>on</strong>g>to</str<strong>on</strong>g>l., 55: 139–150.Du M., Kawashima S., Y<strong>on</strong>emura S., Zhang X., Chen S. (2004):Mutual influence between human activities and climate changein <strong>the</strong> <strong>Tibetan</strong> <strong>Plateau</strong> during recent years. Global andPlanetary Change, 41(3-4): 241-249.Du M., Kawashima S., Y<strong>on</strong>emura S., Yamada T., Zhang Z., LiuJ., Li Y., Gu S., Tang Y. (2007): Temperature distributi<strong>on</strong> in<strong>the</strong> high mountain regi<strong>on</strong>s <strong>on</strong> <strong>the</strong> <strong>Tibetan</strong><strong>Plateau</strong>-Measurement and simulati<strong>on</strong>. In Oxley, L. andKulasiri, D. eds., MODSIM 2007, 2146-2152.Du M., Liu J., Zhang X., Li Y., Tang Y. (2010): Changes ofspatial patterns of surface-air-temperature <strong>on</strong> <strong>the</strong> <strong>Tibetan</strong><strong>Plateau</strong>. Latest Trends <strong>on</strong> Theoretical and Applied Mechanics,Fluid Mechanics and Heat & Mass Transfer. MechanicalEngineering Series, WSEAS Press (ISSN: 1792-4359, ISBN:978-960-474-211-0), 42-47.Frauenfeld O.W., Zhang T., Serreze M.C. (2005): Climatechange and variability using European Centre forMedium-Range Wea<strong>the</strong>r Forecasts reanalysis (ERA-40)temperatures <strong>on</strong> <strong>the</strong> <strong>Tibetan</strong> <strong>Plateau</strong>. J. Geophys. Res., 110,D02101, doi:10.1029/2004JD005230.Jacks<strong>on</strong> R.D., Idso S.B. (1975): Surface albedo anddesertificati<strong>on</strong>. Science, 189: 1012-1013.Kang S., Wu Y., You Q., Flugel W.A., Pepin N. , Yao T. (2010):Review of climate and cryospheric change in <strong>the</strong> <strong>Tibetan</strong><strong>Plateau</strong>. Envir<strong>on</strong>mental research letters, 5 015101,doi:10.1088/1748-9326/5/1/015101.Liu X., Chen B. (2000): <str<strong>on</strong>g>Climatic</str<strong>on</strong>g> warming in <strong>the</strong> <strong>Tibetan</strong> <strong>Plateau</strong>during recent decades. Int. J. Clima<str<strong>on</strong>g>to</str<strong>on</strong>g>l., 20(14): 1729-1742.Lu H., Liu G. (2010): Trends in temperature and precipitati<strong>on</strong> <strong>on</strong><strong>the</strong> <strong>Tibetan</strong> <strong>Plateau</strong>, 1961-2005. Climate Research, 43:179-190.Ohtsuka, T., Hirota M., Zhang X., Shim<strong>on</strong>o A., Senga Y., Du M.,Y<strong>on</strong>emura S., Kawashima S., Tang Y. (2008): Soil organiccarb<strong>on</strong> pools in alpine <str<strong>on</strong>g>to</str<strong>on</strong>g> nival z<strong>on</strong>es al<strong>on</strong>g an altitudinalgradient (4400–5300 m) <strong>on</strong> <strong>the</strong> <strong>Tibetan</strong> <strong>Plateau</strong>. Polar Science,2, 4: 277-28