Déformation photoinduite dans les films minces contenant des ...
Déformation photoinduite dans les films minces contenant des ...
Déformation photoinduite dans les films minces contenant des ...

You also want an ePaper? Increase the reach of your titles
YUMPU automatically turns print PDFs into web optimized ePapers that Google loves.
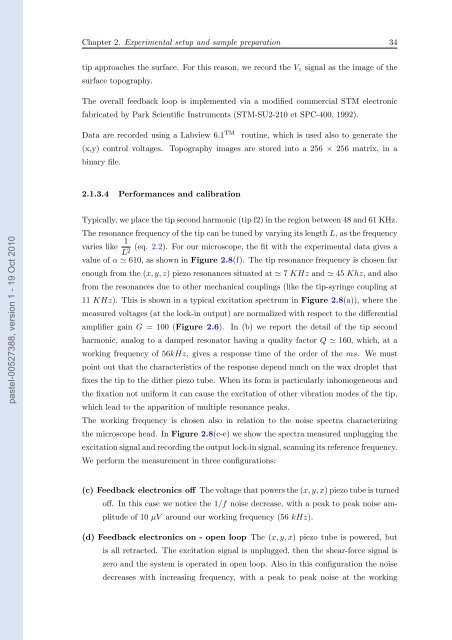
Chapter 2. Experimental setup and sample preparation 34tip approaches the surface. For this reason, we record the V z signal as the image of thesurface topography.The overall feedback loop is implemented via a modified commercial STM electronicfabricated by Park Scientific Instruments (STM-SU2-210 et SPC-400, 1992).Data are recorded using a Labview 6.1 TM routine, which is used also to generate the(x,y) control voltages. Topography images are stored into a 256 × 256 matrix, in abinary file.2.1.3.4 Performances and calibrationpastel-00527388, version 1 - 19 Oct 2010Typically, we place the tip second harmonic (tip f2) in the region between 48 and 61 KHz.The resonance frequency of the tip can be tuned by varying its length L, as the frequencyvaries like1 (eq. 2.2). For our microscope, the fit with the experimental data gives aL2 value of α ≃ 610, as shown in Figure 2.8(f). The tip resonance frequency is chosen farenough from the (x, y, z) piezo resonances situated at ≃ 7 KHz and ≃ 45 Khz, and alsofrom the resonances due to other mechanical couplings (like the tip-syringe coupling at11 KHz). This is shown in a typical excitation spectrum in Figure 2.8(a)), where themeasured voltages (at the lock-in output) are normalized with respect to the differentialamplifier gain G = 100 (Figure 2.6).In (b) we report the detail of the tip secondharmonic, analog to a damped resonator having a quality factor Q ≃ 160, which, at aworking frequency of 56kHz, gives a response time of the order of the ms. We mustpoint out that the characteristics of the response depend much on the wax droplet thatfixes the tip to the dither piezo tube. When its form is particularly inhomogeneous andthe fixation not uniform it can cause the excitation of other vibration mo<strong>des</strong> of the tip,which lead to the apparition of multiple resonance peaks.The working frequency is chosen also in relation to the noise spectra characterizingthe microscope head. In Figure 2.8(c-e) we show the spectra measured unplugging theexcitation signal and recording the output lock-in signal, scanning its reference frequency.We perform the measurement in three configurations:(c) Feedback electronics off The voltage that powers the (x, y, x) piezo tube is turnedoff. In this case we notice the 1/f noise decrease, with a peak to peak noise amplitudeof 10 µV around our working frequency (56 kHz).(d) Feedback electronics on - open loop The (x, y, x) piezo tube is powered, butis all retracted. The excitation signal is unplugged, then the shear-force signal iszero and the system is operated in open loop. Also in this configuration the noisedecreases with increasing frequency, with a peak to peak noise at the working


![[Diffusion-Limited Aggregation - A Model for Pattern Formation].](https://img.yumpu.com/52395246/1/190x245/diffusion-limited-aggregation-a-model-for-pattern-formation.jpg?quality=85)