TableTable1Basic demographic <str<strong>on</strong>g>in</str<strong>on</strong>g>dicators for <str<strong>on</strong>g>Pacific</str<strong>on</strong>g> isl<str<strong>on</strong>g>and</str<strong>on</strong>g> countries <str<strong>on</strong>g>and</str<strong>on</strong>g> territoriesSubregi<strong>on</strong>/ countryTotalpopulati<strong>on</strong>2010Projectedpopulati<strong>on</strong>2020Currentpopulati<strong>on</strong>growth rate(%)Rate ofnatural<str<strong>on</strong>g>in</str<strong>on</strong>g>crease(%)Netmigrati<strong>on</strong>rate (%)Annual<str<strong>on</strong>g>in</str<strong>on</strong>g>crement(number)Percentof annual<str<strong>on</strong>g>in</str<strong>on</strong>g>crement<str<strong>on</strong>g>Pacific</str<strong>on</strong>g> isl<str<strong>on</strong>g>and</str<strong>on</strong>g>s 9,853,023 11,801,200 1.9 2.0 -0.1 183,688 100.0 23Melanesia 8,641,883 10,465,00 2.0 2.1 -0.1 170,169 92.5 19Fiji 847,793 890,400 0.5 1.3 -0.8 4,219 2.3 51New Caled<strong>on</strong>ia 254,525 291,200 1.6 1.1 0.5 4,046 2.2 63Papua New Gu<str<strong>on</strong>g>in</str<strong>on</strong>g>ea 6,744,955 8,267,400 2.2 2.2 0.0 142,876 77.8 13Solom<strong>on</strong> Isl<str<strong>on</strong>g>and</str<strong>on</strong>g>s 549,574 703,500 2.7 2.7 0.0 14,587 7.9 16Vanuatu 245,036 312,500 2.5 2.5 0.0 6,071 3.3 21Micr<strong>on</strong>esia 547,345 624,200 1.4 1.7 -0.3 7,585 4.1 66Micr<strong>on</strong>esia (Fed Sts ) 111,364 116,500 0.4 1.9 -1.5 455 0.2 22Guam 187,140 224,200 2.7 1.4 1.3 4,984 2.7 93Kiribati 100,835 119,900 1.8 1.9 -0.1 1,805 1.0 44Marshall Isl<str<strong>on</strong>g>and</str<strong>on</strong>g>s 54,439 59,500 0.3 2.6 -2.3 176 0.1 65Nauru 9.976 12,000 2.1 2.1 0.0 203 0.1 100Nor<str<strong>on</strong>g>the</str<strong>on</strong>g>rn Mariana Is. 63,072 70,300 0.0 1.6 -1.6 -18 0.0 90Palau 20,516 21,800 0.6 0.6 0.0 119 0.1 77Polynesia 663,795 712,000 0.8 1.6 -0.8 5,086 2.8 37American Samoa 65,906 74,600 1.2 1.9 -0.7 781 0.4 50Cook Isl<str<strong>on</strong>g>and</str<strong>on</strong>g>s 15,529 16,400 0.5 1.2 -0.7 72 0.0 72French Polynesia 268,767 297,600 1.2 1.2 0.0 3,176 1.7 51Niue 1,479 1,200 -2.3 0.6 -2.9 -36 0.0 36Samoa 183,123 188,400 0.3 2.0 -1.7 615 0.3 21T<strong>on</strong>ga 103,365 106,500 0.4 2.1 -1.7 372 0.2 23Tuvalu 11,149 11,800 0.5 1.4 -0.9 58 0.0 47Wallis <str<strong>on</strong>g>and</str<strong>on</strong>g> Futuna 13,256 14,300 -0.3 1.1 --0.8 -43 0.0 0Source: Secretariat of <str<strong>on</strong>g>the</str<strong>on</strong>g> <str<strong>on</strong>g>Pacific</str<strong>on</strong>g> Community, 2009; 2010), <str<strong>on</strong>g>and</str<strong>on</strong>g> authors’ estimates.Note: Pitcairn Isl<str<strong>on</strong>g>and</str<strong>on</strong>g>s (populati<strong>on</strong>: 66) <str<strong>on</strong>g>and</str<strong>on</strong>g> Tokelau Isl<str<strong>on</strong>g>and</str<strong>on</strong>g>s (populati<strong>on</strong>: 1,151) are excluded from <str<strong>on</strong>g>the</str<strong>on</strong>g> table.PercenturbanMost of <str<strong>on</strong>g>the</str<strong>on</strong>g> <str<strong>on</strong>g>in</str<strong>on</strong>g>dependent countries of <str<strong>on</strong>g>the</str<strong>on</strong>g> <str<strong>on</strong>g>Pacific</str<strong>on</strong>g> would beclassified as lower-middle <str<strong>on</strong>g>in</str<strong>on</strong>g>come, but Kiribati, Papua NewGu<str<strong>on</strong>g>in</str<strong>on</strong>g>ea, Solom<strong>on</strong> Isl<str<strong>on</strong>g>and</str<strong>on</strong>g>s <str<strong>on</strong>g>and</str<strong>on</strong>g> Vanuatu are low-<str<strong>on</strong>g>in</str<strong>on</strong>g>comecountries. While some countries have experienced realec<strong>on</strong>omic growth, <str<strong>on</strong>g>in</str<strong>on</strong>g> most of <str<strong>on</strong>g>the</str<strong>on</strong>g>m <str<strong>on</strong>g>the</str<strong>on</strong>g> pace of ec<strong>on</strong>omicgrowth over <str<strong>on</strong>g>the</str<strong>on</strong>g> past two decades has been slow.Fertility levels <str<strong>on</strong>g>and</str<strong>on</strong>g> trendsFertility trendsHas fertility decl<str<strong>on</strong>g>in</str<strong>on</strong>g>e “stalled” <str<strong>on</strong>g>in</str<strong>on</strong>g> <str<strong>on</strong>g>the</str<strong>on</strong>g><str<strong>on</strong>g>Pacific</str<strong>on</strong>g>?Fertility levels <str<strong>on</strong>g>in</str<strong>on</strong>g> most <str<strong>on</strong>g>Pacific</str<strong>on</strong>g> isl<str<strong>on</strong>g>and</str<strong>on</strong>g> countries did notreach <str<strong>on</strong>g>the</str<strong>on</strong>g>ir peak until <str<strong>on</strong>g>the</str<strong>on</strong>g> 1960s or 1970s. In general,fertility peaked at a c<strong>on</strong>siderably higher level <str<strong>on</strong>g>in</str<strong>on</strong>g> <str<strong>on</strong>g>the</str<strong>on</strong>g> <str<strong>on</strong>g>Pacific</str<strong>on</strong>g>than <str<strong>on</strong>g>in</str<strong>on</strong>g> o<str<strong>on</strong>g>the</str<strong>on</strong>g>r develop<str<strong>on</strong>g>in</str<strong>on</strong>g>g regi<strong>on</strong>s. In Kiribati, Samoa <str<strong>on</strong>g>and</str<strong>on</strong>g>T<strong>on</strong>ga, for example, TFR reached well above 7 before itstarted to fall. In <str<strong>on</strong>g>the</str<strong>on</strong>g> Cook Isl<str<strong>on</strong>g>and</str<strong>on</strong>g>s TFR peaked at 7.9 at<str<strong>on</strong>g>the</str<strong>on</strong>g> nati<strong>on</strong>al level <str<strong>on</strong>g>and</str<strong>on</strong>g> at 9.2 <str<strong>on</strong>g>in</str<strong>on</strong>g> some outer isl<str<strong>on</strong>g>and</str<strong>on</strong>g> groups(ESCAP, 1982). This compares with a TFR of 5.9 for <str<strong>on</strong>g>the</str<strong>on</strong>g>less developed countries as a group around <str<strong>on</strong>g>the</str<strong>on</strong>g> same time.Thus, fertility <str<strong>on</strong>g>in</str<strong>on</strong>g> <str<strong>on</strong>g>the</str<strong>on</strong>g> <str<strong>on</strong>g>Pacific</str<strong>on</strong>g> had much fur<str<strong>on</strong>g>the</str<strong>on</strong>g>r to fall than<str<strong>on</strong>g>in</str<strong>on</strong>g> o<str<strong>on</strong>g>the</str<strong>on</strong>g>r less developed regi<strong>on</strong>s of <str<strong>on</strong>g>the</str<strong>on</strong>g> world. Moreover <str<strong>on</strong>g>in</str<strong>on</strong>g>many countries it did fall rapidly from peak levels.An extreme example of <str<strong>on</strong>g>the</str<strong>on</strong>g> speed with which fertility fellafter it peaked <str<strong>on</strong>g>in</str<strong>on</strong>g> <str<strong>on</strong>g>the</str<strong>on</strong>g> 1960s can be seen <str<strong>on</strong>g>in</str<strong>on</strong>g> <str<strong>on</strong>g>the</str<strong>on</strong>g> case of <str<strong>on</strong>g>the</str<strong>on</strong>g>Micr<strong>on</strong>esian country of Kiribati. As illustrated <str<strong>on</strong>g>in</str<strong>on</strong>g> Figure 2,<str<strong>on</strong>g>in</str<strong>on</strong>g> <str<strong>on</strong>g>the</str<strong>on</strong>g> 1960s, TFR fluctuated between 6.5 <str<strong>on</strong>g>and</str<strong>on</strong>g> 7.5. Between<str<strong>on</strong>g>the</str<strong>on</strong>g> late 1960s <str<strong>on</strong>g>and</str<strong>on</strong>g> mid-1970s, however, it dropped byalmost 3 births to 4.5, an extremely rapid decl<str<strong>on</strong>g>in</str<strong>on</strong>g>e. For <str<strong>on</strong>g>the</str<strong>on</strong>g>68
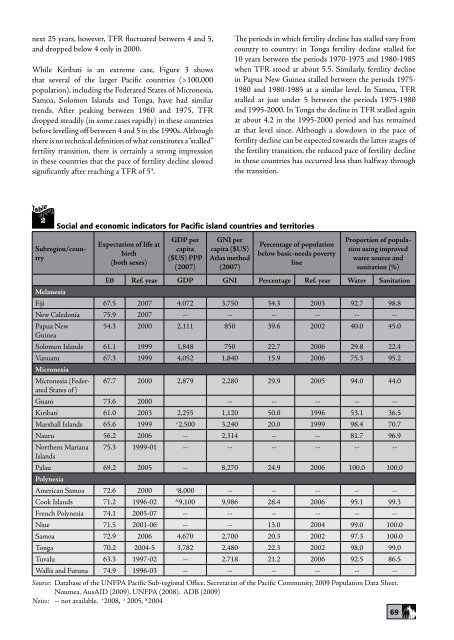
next 25 years, however, TFR fluctuated between 4 <str<strong>on</strong>g>and</str<strong>on</strong>g> 5,<str<strong>on</strong>g>and</str<strong>on</strong>g> dropped below 4 <strong>on</strong>ly <str<strong>on</strong>g>in</str<strong>on</strong>g> 2000.While Kiribati is an extreme case, Figure 3 showsthat several of <str<strong>on</strong>g>the</str<strong>on</strong>g> larger <str<strong>on</strong>g>Pacific</str<strong>on</strong>g> countries (>100,000populati<strong>on</strong>), <str<strong>on</strong>g>in</str<strong>on</strong>g>clud<str<strong>on</strong>g>in</str<strong>on</strong>g>g <str<strong>on</strong>g>the</str<strong>on</strong>g> Federated States of Micr<strong>on</strong>esia,Samoa, Solom<strong>on</strong> Isl<str<strong>on</strong>g>and</str<strong>on</strong>g>s <str<strong>on</strong>g>and</str<strong>on</strong>g> T<strong>on</strong>ga, have had similartrends. After peak<str<strong>on</strong>g>in</str<strong>on</strong>g>g between 1960 <str<strong>on</strong>g>and</str<strong>on</strong>g> 1975, TFRdropped steadily (<str<strong>on</strong>g>in</str<strong>on</strong>g> some cases rapidly) <str<strong>on</strong>g>in</str<strong>on</strong>g> <str<strong>on</strong>g>the</str<strong>on</strong>g>se countriesbefore levell<str<strong>on</strong>g>in</str<strong>on</strong>g>g off between 4 <str<strong>on</strong>g>and</str<strong>on</strong>g> 5 <str<strong>on</strong>g>in</str<strong>on</strong>g> <str<strong>on</strong>g>the</str<strong>on</strong>g> 1990s. Although<str<strong>on</strong>g>the</str<strong>on</strong>g>re is no technical def<str<strong>on</strong>g>in</str<strong>on</strong>g>iti<strong>on</strong> of what c<strong>on</strong>stitutes a “stalled”fertility transiti<strong>on</strong>, <str<strong>on</strong>g>the</str<strong>on</strong>g>re is certa<str<strong>on</strong>g>in</str<strong>on</strong>g>ly a str<strong>on</strong>g impressi<strong>on</strong><str<strong>on</strong>g>in</str<strong>on</strong>g> <str<strong>on</strong>g>the</str<strong>on</strong>g>se countries that <str<strong>on</strong>g>the</str<strong>on</strong>g> pace of fertility decl<str<strong>on</strong>g>in</str<strong>on</strong>g>e slowedsignificantly after reach<str<strong>on</strong>g>in</str<strong>on</strong>g>g a TFR of 5 4 .The periods <str<strong>on</strong>g>in</str<strong>on</strong>g> which fertility decl<str<strong>on</strong>g>in</str<strong>on</strong>g>e has stalled vary fromcountry to country: <str<strong>on</strong>g>in</str<strong>on</strong>g> T<strong>on</strong>ga fertility decl<str<strong>on</strong>g>in</str<strong>on</strong>g>e stalled for10 years between <str<strong>on</strong>g>the</str<strong>on</strong>g> periods 1970-1975 <str<strong>on</strong>g>and</str<strong>on</strong>g> 1980-1985when TFR stood at about 5.5. Similarly, fertility decl<str<strong>on</strong>g>in</str<strong>on</strong>g>e<str<strong>on</strong>g>in</str<strong>on</strong>g> Papua New Gu<str<strong>on</strong>g>in</str<strong>on</strong>g>ea stalled between <str<strong>on</strong>g>the</str<strong>on</strong>g> periods 1975-1980 <str<strong>on</strong>g>and</str<strong>on</strong>g> 1980-1985 at a similar level. In Samoa, TFRstalled at just under 5 between <str<strong>on</strong>g>the</str<strong>on</strong>g> periods 1975-1980<str<strong>on</strong>g>and</str<strong>on</strong>g> 1995-2000. In T<strong>on</strong>ga <str<strong>on</strong>g>the</str<strong>on</strong>g> decl<str<strong>on</strong>g>in</str<strong>on</strong>g>e <str<strong>on</strong>g>in</str<strong>on</strong>g> TFR stalled aga<str<strong>on</strong>g>in</str<strong>on</strong>g>at about 4.2 <str<strong>on</strong>g>in</str<strong>on</strong>g> <str<strong>on</strong>g>the</str<strong>on</strong>g> 1995-2000 period <str<strong>on</strong>g>and</str<strong>on</strong>g> has rema<str<strong>on</strong>g>in</str<strong>on</strong>g>edat that level s<str<strong>on</strong>g>in</str<strong>on</strong>g>ce. Although a slowdown <str<strong>on</strong>g>in</str<strong>on</strong>g> <str<strong>on</strong>g>the</str<strong>on</strong>g> pace offertility decl<str<strong>on</strong>g>in</str<strong>on</strong>g>e can be expected towards <str<strong>on</strong>g>the</str<strong>on</strong>g> latter stages of<str<strong>on</strong>g>the</str<strong>on</strong>g> fertility transiti<strong>on</strong>, <str<strong>on</strong>g>the</str<strong>on</strong>g> reduced pace of fertility decl<str<strong>on</strong>g>in</str<strong>on</strong>g>e<str<strong>on</strong>g>in</str<strong>on</strong>g> <str<strong>on</strong>g>the</str<strong>on</strong>g>se countries has occurred less than halfway through<str<strong>on</strong>g>the</str<strong>on</strong>g> transiti<strong>on</strong>.TableTable2Social <str<strong>on</strong>g>and</str<strong>on</strong>g> ec<strong>on</strong>omic <str<strong>on</strong>g>in</str<strong>on</strong>g>dicators for <str<strong>on</strong>g>Pacific</str<strong>on</strong>g> isl<str<strong>on</strong>g>and</str<strong>on</strong>g> countries <str<strong>on</strong>g>and</str<strong>on</strong>g> territoriesSubregi<strong>on</strong>/countryExpectati<strong>on</strong> of life atbirth(both sexes)GDP percapita($US) PPP(2007)GNI percapita ($US)Atlas method(2007)Percentage of populati<strong>on</strong>below basic-needs povertyl<str<strong>on</strong>g>in</str<strong>on</strong>g>eProporti<strong>on</strong> of populati<strong>on</strong>us<str<strong>on</strong>g>in</str<strong>on</strong>g>g improvedwater source <str<strong>on</strong>g>and</str<strong>on</strong>g>sanitati<strong>on</strong> (%)E0 Ref. year GDP GNI Percentage Ref. year Water Sanitati<strong>on</strong>MelanesiaFiji 67.5 2007 4,072 3,750 34.3 2003 92.7 98.8New Caled<strong>on</strong>ia 75.9 2007 -- -- -- -- -- --Papua New54.3 2000 2,111 850 39.6 2002 40.0 45.0Gu<str<strong>on</strong>g>in</str<strong>on</strong>g>eaSolom<strong>on</strong> Isl<str<strong>on</strong>g>and</str<strong>on</strong>g>s 61.1 1999 1,848 750 22.7 2006 29.8 22.4Vanuatu 67.3 1999 4,052 1,840 15.9 2006 75.3 95.2Micr<strong>on</strong>esiaMicr<strong>on</strong>esia (Federated67.7 2000 2,879 2,280 29.9 2005 94.0 44.0States of )Guam 73.6 2000 -- -- -- -- --Kiribati 61.0 2003 2,255 1,120 50.0 1996 53.1 36.5Marshall Isl<str<strong>on</strong>g>and</str<strong>on</strong>g>s 65.6 1999 +2,500 3,240 20.0 1999 98.4 70.7Nauru 56.2 2006 -- 2,314 -- -- 81.7 96.9Nor<str<strong>on</strong>g>the</str<strong>on</strong>g>rn Mariana 75.3 1999-01 -- -- -- -- -- --Isl<str<strong>on</strong>g>and</str<strong>on</strong>g>sPalau 69.2 2005 -- 8,270 24.9 2006 100.0 100.0PolynesiaAmerican Samoa 72.6 2000 x8,000 -- -- -- -- --Cook Isl<str<strong>on</strong>g>and</str<strong>on</strong>g>s 71.2 1996-02 &9,100 9,986 28.4 2006 95.1 99.3French Polynesia 74.1 2005-07 -- -- -- -- -- --Niue 71.5 2001-06 -- -- 13.0 2004 99.0 100.0Samoa 72.9 2006 4,670 2,700 20.3 2002 97.3 100.0T<strong>on</strong>ga 70.2 2004-5 3,782 2,480 22.3 2002 98.0 99.0Tuvalu 63.3 1997-02 -- 2,718 21.2 2006 92.5 86.5Wallis <str<strong>on</strong>g>and</str<strong>on</strong>g> Futuna 74.9 1996-03 -- -- -- -- -- --Source: Database of <str<strong>on</strong>g>the</str<strong>on</strong>g> UNFPA <str<strong>on</strong>g>Pacific</str<strong>on</strong>g> Sub-regi<strong>on</strong>al Office. Secretariat of <str<strong>on</strong>g>the</str<strong>on</strong>g> <str<strong>on</strong>g>Pacific</str<strong>on</strong>g> Community, 2009 Populati<strong>on</strong> Data Sheet.Noumea. AusAID (2009). UNFPA (2008). ADB (2009)Notes: -- not available. + 2008, x 2005, & 200469
- Page 1:
Family Pla
- Page 7 and 8:
ForewordThe Asia <
- Page 11:
Part 1Part 1Asia <
- Page 14 and 15:
Ensuring that <str
- Page 16 and 17:
of methods for all, in</str
- Page 18 and 19:
and undertake <str
- Page 21 and 22:
Report on the Regi
- Page 23 and 24:
SESSION 1: Changin
- Page 25 and 26:
that improving <st
- Page 31: at a hospital would be offered post
- Page 35: Bounkoung Phichit, Deputy M
- Page 38 and 39: medicines
- Page 40 and 41: Thus, while knowledge of modern met
- Page 42 and 43: Hon. Mr. Malakai Tabar, Chairman, P
- Page 44 and 45: curricula. If the
- Page 47: dialogue as well as regional <stron
- Page 51: BackgroundGlobal development effort
- Page 54 and 55: TableTable1EventNational policyYear
- Page 56 and 57: A third observation is that reporte
- Page 58 and 59: TableTable2Current Contraceptive Pr
- Page 60 and 61: Figure(-1.2), Cook Island</
- Page 62: FigureTableTable3Trends in<
- Page 65 and 66: Nam. Nearly all economies i
- Page 67: 2008 2009% Bilateral % Multilateral
- Page 70 and 71: family planning wi
- Page 73 and 74: IntroductionFamily
- Page 75 and 76: The advent of the
- Page 77: FigureFigure1Oceania and</s
- Page 81 and 82: FigureFigureFigure2Total fertility
- Page 83 and 84: family planning pr
- Page 85 and 86: esponsible for the
- Page 87 and 88: that estimates of CPR for earlier p
- Page 90 and 91: Figuremarried at an older age compa
- Page 92 and 93: As previously mentioned most <stron
- Page 94 and 95: FigureFigure945Relationship between
- Page 96 and 97: The concept of “unmet need” has
- Page 98 and 99: TableTable8Percentage of th
- Page 100 and 101: TableTable9Percentage of reasons fo
- Page 102 and 103: family planning pr
- Page 104 and 105: As far as the supp
- Page 106 and 107: Socio-cultural challenges tofamily
- Page 108 and 109: likely to use contraception than yo
- Page 110 and 111: 15 Tests of statistical significanc
- Page 112 and 113: of the South <stro
- Page 114 and 115: 104
- Page 116: Figurewill exceed the</stro
- Page 119 and 120: in urban (67%) tha
- Page 121 and 122: ased service delivery poin<
- Page 123 and 124: Most FWAs who were recruited two to
- Page 125 and 126: are considered, unmet need for effe
- Page 127 and 128: Households pay the
- Page 129 and 130:
Effective public-private partnershi
- Page 131 and 132:
ConclusionThe Bangladesh Fa
- Page 133 and 134:
the Family
- Page 135 and 136:
National Institute for Population R
- Page 137 and 138:
IndiaIndiaFamily <
- Page 139:
IntroductionThe use of contraceptiv
- Page 142 and 143:
TableTable2Indicators of tra<strong
- Page 144 and 145:
FigureFigureFigure1Contraceptive pr
- Page 146 and 147:
TableTable5Indicators of contracept
- Page 148 and 149:
TableTable6Adjusted odds ratios for
- Page 150 and 151:
FigureFigure3Contraceptive prevalen
- Page 152 and 153:
TableTable7Adjusted and</st
- Page 154 and 155:
the north
- Page 156 and 157:
TableTable10Differences between nor
- Page 158 and 159:
TableTable11 Total fertility rate <
- Page 160 and 161:
End Note1The first camp was success
- Page 162 and 163:
152
- Page 164 and 165:
154
- Page 166 and 167:
Figure1980s and ex
- Page 168 and 169:
health care and ed
- Page 170 and 171:
assistance from UNFPA and</
- Page 172 and 173:
in CPR. Likewise,
- Page 174 and 175:
International supp
- Page 176 and 177:
in development has
- Page 178 and 179:
__________ (2007). Population <stro
- Page 180 and 181:
170
- Page 182 and 183:
TableTable2What has the</st
- Page 184 and 185:
174
- Page 186 and 187:
per cent of women reported us<stron
- Page 188 and 189:
is provider bias that such methods
- Page 190 and 191:
TableTable7skewed distribution of h
- Page 192 and 193:
TableTable8TableTable9182
- Page 194 and 195:
that of the nation
- Page 196 and 197:
TableTable12 7some policies that ex
- Page 198 and 199:
The system guides the</stro
- Page 200 and 201:
FigureFigure4Total donor expenditur
- Page 202 and 203:
FigureFigureagain
- Page 204 and 205:
Impact of family plannin</s
- Page 206 and 207:
marketing of contr
- Page 208 and 209:
United States Agency for In
- Page 210 and 211:
200
- Page 212 and 213:
acceptable. From an NGO perspective
- Page 214 and 215:
FigureThis trend of limited donor f
- Page 216 and 217:
Figureto have the
- Page 218 and 219:
FigureFigure5Percentage change <str
- Page 220 and 221:
FigureFigure6Desire to limit childb
- Page 222 and 223:
coordination betwe
- Page 224 and 225:
the 1980s
- Page 226 and 227:
Policy Management.__________ (n.d.,
- Page 228 and 229:
218
- Page 230 and 231:
Population Activities (UNFPA) for a
- Page 232 and 233:
where family plannin</stron
- Page 234 and 235:
Thus an objective assessment of <st
- Page 236 and 237:
226
- Page 238 and 239:
Figureeconomic growth durin
- Page 240 and 241:
TableTable1TableTable2For spac<stro
- Page 242 and 243:
eflect a provider bias (e.g., <stro
- Page 244 and 245:
The Indonesian delegation was very
- Page 246 and 247:
than in ensur<stro
- Page 248 and 249:
in-country <strong
- Page 250 and 251:
(Ministry of Healt
- Page 252 and 253:
242
- Page 254 and 255:
244
- Page 256 and 257:
FigureTrends and p
- Page 258 and 259:
TableTable3Unmet need for contracep
- Page 260 and 261:
TableTable5TableTable6TableTable725
- Page 262 and 263:
TableTable8TableTable9Malaysia, abo
- Page 264 and 265:
previously mentioned is based on fo
- Page 266 and 267:
TableTable16births and</str
- Page 268 and 269:
FigureFigure3TRF54.5Scatter plots o
- Page 270 and 271:
ReferencesAng, Eng Suan (2007). Stu
- Page 272 and 273:
Demographic data sheet: population
- Page 274 and 275:
population size, with just 336,000
- Page 276 and 277:
NuptialityIn Myanmar nuptiality is
- Page 278 and 279:
FigureIn Myanmar, birth-spac<strong
- Page 280 and 281:
Scope of coverage and</stro
- Page 282 and 283:
FigureIn Myanmar, out of six select
- Page 284 and 285:
equirements. The Min</stron
- Page 286 and 287:
according to <stro
- Page 288 and 289:
Adolescent sexual and</stro
- Page 290 and 291:
FigureHIV/AIDS. An HIV-positive wom
- Page 292 and 293:
National Population PolicyMyanmar i
- Page 294 and 295:
Linkages with o<st
- Page 296 and 297:
TableTable4Achievements of Myanmar
- Page 298 and 299:
monitoring <strong
- Page 300 and 301:
Nay Pyi Taw, 26 October 2010.53 Sit
- Page 302 and 303:
292
- Page 304 and 305:
294
- Page 306 and 307:
TableTableA296
- Page 308 and 309:
dispense and adm<s
- Page 310 and 311:
(1) I am against a
- Page 312 and 313:
FigureFigureFigure3Use of modern co
- Page 314 and 315:
FigureFigure7Traditional method use
- Page 316 and 317:
Figureprojection, and</stro
- Page 318 and 319:
Figure 11 summarizes the</s
- Page 320 and 321:
correlating <stron
- Page 322 and 323:
Figurethe use of c
- Page 324 and 325:
FigureFigure15Sexual behaviour <str
- Page 326 and 327:
track the distribu
- Page 328 and 329:
Figureservices, which should <stron
- Page 330 and 331:
FigureFigureFigure18 Population <st
- Page 332 and 333:
National Statistics Office, <strong
- Page 334 and 335:
TableTable6TableTable7TableTable832
- Page 336 and 337:
TableTable11326
- Page 338 and 339:
TableTable14TableTable15TableTable1
- Page 340 and 341:
TableTable19Laws and</stron
- Page 342 and 343:
worker and hours w
- Page 344 and 345:
334
- Page 346 and 347:
336
- Page 348 and 349:
includin</
- Page 350 and 351:
TableTable1Contraceptive prevalence
- Page 352 and 353:
These results suggest that about 70
- Page 354 and 355:
2 The (period) TFR is the</
- Page 356 and 357:
346
- Page 358 and 359:
FigureThe existence of traditional
- Page 360 and 361:
Guinea case by <st
- Page 362 and 363:
The establishment of provin
- Page 364 and 365:
provide family plannin</str
- Page 366 and 367:
Figurelegal requirement nor a condi
- Page 368 and 369:
FigureTableTable5TableTable6Figure4
- Page 370 and 371:
modern method and
- Page 372 and 373:
married or in unio
- Page 374 and 375:
Figureolder. Both the</stro
- Page 376 and 377:
TableTable15The immediate past Nati
- Page 378 and 379:
out that the “ne
- Page 380 and 381:
Commodity securitySupply cha<strong
- Page 382 and 383:
is able to achieve. In Papua New Gu
- Page 384 and 385:
Qualitative assessments by a number
- Page 386 and 387:
increasin<
- Page 388 and 389:
service delivery poin</stro
- Page 390 and 391:
Population: Views from Men
- Page 392 and 393:
1545-1730Day 2: December 9Session 2
- Page 394 and 395:
Day 3, December 10Session 50830-100
- Page 396 and 397:
15Mr. Tong Sithen1
- Page 398 and 399:
54Ms. Shadiya IbrahimAssistant Repr
- Page 400 and 401:
93Mr. Melkie AntonProject OfficerUn
- Page 402 and 403:
131Dr. John P. SkibiakDirectorRepro
- Page 404:
International <str