You also want an ePaper? Increase the reach of your titles
YUMPU automatically turns print PDFs into web optimized ePapers that Google loves.
TOMORROW'S TRADING TECHNOLOGY100% automated Fibonacci support and resistance levels that you can count onevery single trading day in an instant.<strong>ProTrader</strong>
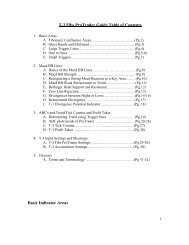
T-3 Fibs <strong>ProTrader</strong> Guide Table of Contents1. Basic AreasA. Fibonacci Confluence Areas……………………………...(Pg.2)B. Outer Bands and Mid band………...………………….…. (Pg.3)C. Large Trigger Lines……………….……………….…….. (Pg.4)D. One to Ones…………………...…………………….…… (Pg.5-6)E. Small Triggers…………………………………………… (Pg.7)2. Macd BB LinesA. Basics of the Macd BB Lines………………………….…. (Pg.8)B. Macd BB Strength………………………………………... (Pg.9)C. Recognizing a Strong Macd Reaction to a Key Area…..… (Pg.10)D. Macd BB Weak Retracement in Trend ……………..…….(Pg.11)E. Bollinger Band Support and Resistance……………..……(Pg.12)F. Zero Line Rejection…………………………………..….. (Pg.13)G. Divergences between Highs or Lows………………..……(Pg.14-16)H. Retracement Divergence ……………………………..…..(Pg.17)I. T-3 Divergence Potential Indicator ...................................(Pg. 18)3. Bar Patterns ABC's and Trend Tick CounterA. Reversal Bar Pattern…………………………………....…(Pg.19-20)B. Double Bar Reversal Pattern…………………………..….(Pg.21-22)C. Determining Trend using Trigger lines .............................(Pg. 23)D. ABC plots inside of <strong>ProTrader</strong>……………………...….…(Pg.24-30)E. T-3 Tick Counter................. …………………………......(Pg 31)4. T-3 Input Settings and MeaningsA. T-3 Fibs <strong>ProTrader</strong> Settings ……......……………….…...(Pg.32-33)B. T-3 Accumulator Settings....... …………………..........…(Pg. 34)C. T-3 Revolution Settings...................………………….….(Pg.35-36 )D. T-3 Revolution TESTING settings...................................(Pg. 37)5. GlossaryA. Terms and Terminology …………………………………(Pg 38-39)1
Basic Indicator AreasThe T-3 Fibs <strong>ProTrader</strong> is the most powerful predictive indicator package availabletoday. Learning when to trade long and short from the software’s key stacked areas willgive you the highest reward, lowest risk trades possible.Levels generated by the T-3 Fibs <strong>ProTrader</strong> are as follows:Fibonacci Confluence Areas - These areas are very powerful clusters of Fibonacciratios that fall into a tight range. They are used as the road map for our trading. Thesekey areas will be extremely reliable for determining potential Reversal points in themarket. Our Fibonacci confluence areas are generated by 10 “synthetically built” highertime frames. This gives us a complete and accurate Fibonacci analysis, which isrepresented by red and blue lines. The solid red lines are resistance and the solid bluelines are support. Click for Video of how they are created2
Outer Bands and Mid band (T-3Trend Bands) - These areas may create abounce in the market. As such they will often act as areas for entries, as well as areasfor exits.3
Large Trigger Lines –The Large Trigger Lines will represent the overall directionor trend of the market. They provide information such as strength, weakness and thepotential to change the direction of the market.The Large Trigger Lines will also act as support and resistance when they arepinching and rolling and after they have crossed.4
One to Ones (1:1) - The white 1:1s are 100% alternates projected from the previousswing. (No matter how small the swing) The magenta 1:1s project a new swing whenthe trend changes. They will help to make an area stronger, but alone will be lesssignificant.White one to ones are 100% alternates of the previous small swing that happened in themarket in that direction.Magenta one to ones are 100% alternates of the previous large swing or trend changingswing that has in the market in that direction.The indicator that plots the one to ones says if this new swing turns out 100% like thatlast swing, Then this is where we need to plot the next one to one because this is wherewe anticipate the market to get to.5
SMALL TRIGGER LINES- Notice the chart will coordinate with the numbereddescriptions below.1. MOMENTUM - Price bars pulling away from the Trigger Lines, whilespreading apart, represents strength and momentum.2. LOSS OF MOMENTUM - Price action inside the Trigger Lines, which havestopped spreading apart, show a loss of momentum. This is the first sign thatmomentum is weakening.3. LOSS OF MOMENTUM WITH THE POTENTIAL TO TURN - TriggerLines begin to show the potential to roll, cross and reverse direction when theprice closes on the opposite side.7
Macd BB LinesThe Macd BB Lines are an indicator that will offer “insight” into the market’s strengthor weakness. The Macd BB Lines will provide information about the current market,and its expected outcome. This indicator may require the most practice to becomeproficient, but once mastered it will be an invaluable tool.Basics of the Macd BB LinesIf the Macd BB Lines are slowing with the bands coming together, it is indicative ofweakening in the current trend and consolidation or a reversal may take place. Theswing distance on the Macd Bollinger Bands typically indicates momentum of thetrend. If the Macd BBs are moving rapidly in one direction, with very little to nopullback, it is a strong move.The distance between the Macd BBs themselves is also a signal that will help you todetermine the strength of the move. The larger the spacing between the Macd BBs, themore momentum there will be behind the move.8
Macd BB Strength - When Macd BB dots move outside of the Bollinger BandLines, it will indicate that the market has a lot of momentum. Generally, it will continuein the current direction. If in a position, this will help you to remain patient to maximizeyour profits. If waiting to enter a new position, this will keep you from getting in tooearly.9
Recognizing a Strong Macd Reaction to a Key Area - This will oftenvalidate that the direction has changed. Now look to trade in the new direction.10
How to recognize a “weak” Macd retracement in a trend- When you arein a trending market you can use the Macd BB lines to help you recognize when themarket is making retracements within the trend or of the market is showing the potentialfor a reversal in tend. Notice the highlighted areas below. Each of these will be used inour educational rooms and will be called weak retracements.11
Bollinger Band Support and Resistance - This is expected after a strong movein the Macd BB Lines, and it is followed by a Retracement to the opposite BollingerBand. It will seem as though the BBs are sliding along the Bollinger Bands and willgenerally be at key areas.12
Zero Line Rejection (ZLR) - A Zero Line Rejection occurs when the Macd BBLines reach the Zero Line and begin to turn. At this point, anticipate the trend tocontinue. If the Macd BB Lines move though the Zero Line, then anticipate that thetrend has changed.13
Divergences between Price and T-3 Macd BB swingsThe job of Divergence is to change the trend of the market or to cause a majorbounce or stall in the current trend.5 basics of Divergence and the expected outcome for the Fib Areas1. Bearish Divergence occurs when there are higher prices andlower Macd. REVERSAL EXPECTED - RESISTANCE MAYHOLD2. The market is TRENDING UP when there are higher prices andhigher Macd. NO REVERSAL EXPECTED - RESISTANCEMAY BREAK3. Bullish Divergence occurs when there are lower prices andhigher Macd. REVERSAL EXPECTED - SUPPORT MAYHOLD4. The market is TRENDING DOWN when there are lower pricesand lower Macd. NO REVERSAL EXPECTED – SUPPORTMAY BREAK5. When closing past a Divergence high or low, it shows the trendmay continue.*The reading of the Macd BB lines will be a vital part of your Pre-Trade andDuring Trade routine so please make sure you study them.14
With Bearish Divergence at resistance, the area has the potential to hold.15
With Bullish Divergence at Support, the area has the potential to hold.16
Retracement Divergence - At key areas, compare the swings between the price andthe Macd. Retracement Divergence is typically defined as, less than a 38% retracement inthe Macd, and at least 50% retracement in price. This Divergence is showing that the areais anticipated to hold. Below is an example of Bearish Retracement Divergence.17
T-3 Retracement Divergence indicator- this indicator when applied will showthe price swings versus Macd BB lines swings. It will plot a POSITIVE Number whenthe swings of the Macd are greater ( as a %) than price swings and will plot aNEGATIVE number showing the divergence between Macd and Price Swing.18
Bar PatternsA. Reversal Bar PatternThese are the simple rules to recognize a Reversal Bar Pattern.When looking for a Reversal Bar, price must make a higher high orlower low than the previous bar.a. Higher high for a short patternb. Lower low for a long pattern2. The Reversal Bar must close higher than the prior bar’s close.a. Lower close for a short patternb. Higher close for a long pattern19
The Reversal Bar must close higher than the prior bar’s close for long (shownbelow).20
B. Double Bar Reversal PatternThese are the rules for a Double Top or a Double Bottom Bar Pattern.1. Bars must have equal highs or equal lows to start this pattern.a. Equal highs for a short patternb. Equal lows for a long pattern2. Neither bar can close at the top, or the bottom of the bar.a. Top of bar for short patternb. Bottom of the bar for long pattern3. A close that exceeds the prior close is best, but not always needed. Itdepends on how powerful the area is that you are trading.21
Bars must have equal highs to start this Double Top Pattern. Neither bar canclose at the top, or the bottom of the bar. A close that exceeds the prior close isbest, but not always needed. It depends on how powerful the area is that you aretrading.22
Determining Trend Direction Using Large Trigger Lines –The LargeTrigger Lines are a simple way to give you a quick perspective of the overall directionor trend of the market.They provide information such as strength, weakness and the potential to change thedirection of the market. The Market direction will be up if your small triggers areclosing above the large triggers and down if the small triggers are closing below thelarge triggers.23
T-3 Fibs <strong>ProTrader</strong> ABC's indicators that plot on charts.The ABCs are an invaluable tool that helps to understand development ofa new trend, or simply a trend continuation. The ABC indicator helps onedetermine the market has made new highs/lows, or has failed to make newhighs/lows. To see what makes each pivot plot, we will need to understand thatthe purpose of each letter is to exceed the previous letter, except for the C…itonly needs to equal the B pivot.* However, the A and C have the exception that if they do exceed theprevious pivot, the progression will be complete, until the next outer band isreached.A. Expected Outcome of the EXT Pivot- The ABC progression begins witha pivot at or beyond the outer band, resulting in an extreme pivot that the softwarelabels EXT. Once the EXT is plotted, its purpose is to drive the market to theopposite outer band. Once the market arrives at the opposite outer band andcreates a new pivot, another EXT will plot, signaling the beginning of a new ABCprogression. If a pivot occurs prior to reaching the opposite outer band, the APivot will plot.24
B. Expected Outcome of the A Pivot -The A Pivot is expected to take theprice back to the outer band in order to exceed the previous EXT pivot.Completion of the task would exceed the EXT, resulting in a new EXT at theouter band. If the A pivot falls short of the outer band, and doesn’t exceed theprice of the EXT, the B pivot will plot.25
C. Nuance for the A Pivot - Once the A exceeds the EXT, the progression isover, and a new progression will begin as a new EXT forms at the outer band.26
D. Expected Outcome of the B Pivot - The B pivot is expected to exceed theA pivot, possibly resulting in a new EXT at the other outer band. The B pivotcompletes its first function as soon as it exceeds the A. If the B does not reach theouter band, the progression is expected to continue with a C pivot. The B pivot isthe only letter that has more than one chance. If it does not exceed the A pivot,and does not hit an outer band, then there is still a chance for the C. However, theB pivot MUST exceed the A to get the C pivot. As long as the B does not reachthe outer band, then progression is still intact.27
E. Nuance for the B Pivot -The B has more than one chance to complete itstask. As long as the outer band is not reached, the B can still provide a C, once theA has been exceeded.28
F. Expected Outcome of the C Pivot -The C is to EQUAL THE B, possiblyeven exceed it, thereby completing the progression. If the C reaches the outerband, a new EXT will plot, beginning the progression again. If the C does notequal the B pivot, then it will plot a Failure. This may happen just one tick awayfrom the B pivot.29
G. When the C Pivot Fails -The failure simply completes the progression byrunning back to the opposite outer band, exceeding the C pivot. From theopposite outer band a new progression will begin. These are the fundamentals ofwhat makes the pivot points plot in the progression.30
T-3 Ticks Left CounterThe ticks left counter will count backwards to zero giving you an indication when aTICK BASED* bar will reach zero. This will be important when timing your entriesbased on the close of the bar or a few ticks short of the close of a bar.* Tick Bars plot the price of each transaction. Tick bars differ from time-based barsbecause tick bars plot prices based on a transaction-by-transaction basis while time-basedbars plot prices during a specified time period. A transaction can represent 100 shares,200 shares, 1,000 shares, and so on. When plotting tick bars, price and number of ticksare the only factors used, as time and volume are not considered. ( source Tradestationhelp guide).31
T-3 Fibs <strong>ProTrader</strong> Inputs and MeaningsFib_Timeframes(10) - number of timeframes analyzed (1-10 range)Fib_AutoFluSetting (22) - First number is Range to look for Confluences the higherthe number the larger the range ( 2-4 Usable ) . The Second number is how aggressivelyto "collapse" weaker Fibonacci areas ( 1= Smallest - 4 = Largest usable).Typically this setting should always remain " 22" or "32 " in our experienceFib_CollapseMarginTicks (0), 0 means is auto-calculated ( above input) or you canmanually set how many ticks you wish to use as a filter. 1 =smallest - 1,000 ... when youuse smaller charts Auto Settings usually work well. If you use Daily charts or largertimeframe charts depending on the market you will need that make that numberconsiderably higher. For example a stock that trades in a large range like Google mayneed 300 as a setting- that would mean you are collapsing fibs within a 3 dollar range or( 300 of the smallest increment the instrument trades in).Fib_NdaysBack (10), number of days back to to start fibs analysis for each - So ifyour chart has 30 days the fibs will only use data from the last 10 days if set to 10. Thisnumber may need to be in the hundreds if looking at Daily bars. Note- the first 10 days ofthe 30 day chart will use all data available until it reaches 10 days.Fib_UpdatePeriod (1440), How often in minutes your chart will update theAutomated Fibonacci lines. 360 = every 360 minutes. If you use Daily charts you maywish for your update period to be once per week. In that case a (-) negative number isused to make the program use DAYS and not minutes. (-14) would be every two weeks.When using Negative numbers you can also specify the DAY of the week to update thefibs expressed as a 1-5 representing Monday through Friday.So if you set it to -7.5 the Fibs will recalculate after every Friday Once per week.If it is set to -14.2 the Fibs will recalculate on Tuesday every other week.Fib_LineWidth (0)- Sets Fibonacci Line thickness ( 0-5 ) usable rangeFib_TextToRightSpace (14)- Plots the value of the fib line on the right edge of yourcharts. If you set it to "0" it will turn off the text prices.Plot_OffsetTicks (2)- Controls how many ticks above or below price bars for plots suchas the ABC plots.32
Plot_ABC (true)- Turns on and off EXT-ABC-FAILURE plots as a True/False inputPlot_Abc_Sml_121s (true),- Turns on and off White one to one dotted plots as aTrue/False inputPlot_Abc_Lrg_121s (true)- Turns on and off Magenta one to one dotted plots as aTrue/False inputPlot_TrendBands (true)- Turns on and off T-3 Trend Band Upper Mid and LowerBands plots as a True/False inputAbc_TextColor (black)- Color option for the ABC plots.AccumulationId (0)- a numerical Expression that tells the T-3 Fibs <strong>ProTrader</strong> to PUSHOUT the fib lines as values in order for the T-3 Fibs Accumulator Indicator to plot theFibonacci Lines from ( this chart ) to any other chart you set the number the same as. Forexample - if you run the <strong>ProTrader</strong> on a 5 minute chart and generate Fibonacci lines youcan set the AccumulationId input to (1) and that information will be stored in the DLL.When you apply the T-3 Accumulator to another chart (say a 576 tick chart) and set theinput to (1) after the first complete bar the 5-Minute Fibs will appear on that chart.33
T-3 Fibs Accumulator Inputs and MeaningsaccumulationId (0), - this will PULL Fibonacci lines from the T-3 Fibs <strong>ProTrader</strong>the Fibonacci lines from another chart when the input value is the same.For example - if you run the T-3 Fibs <strong>ProTrader</strong> on a 5 minute chart and generateFibonacci lines you can set the AccumulationId input to (1) and that information will bestored in the DLL.When you apply the T-3 Accumulator to another chart (say a 576 tick chart) and set theinput to (1) after the first complete bar the 5-Minute Fibs will appear on that chart.fluColor (white)- You can manually set Fibonacci areas pulled from another chart toa specific color for ease in use. You may use the RBG number or the name. If you setthis to a (-1) then the program will automatically pull the color from the parent chart.Red or Blue34
T-3 Revolution Inputs and MeaningsxUseStackedTT(1) -Default Signal will always be "1" set to zero for offUseMarketOrderEntry (1) - will enter this bar if a buy or sell signal is trueUseHitSupHitResFilter (1)- will not plot arrow for the trade unless Distance toFibonacci Support or Fibonacci Resistance lines are > Ticks2FibResist inputUseMinTicks2StackFilt (1)- will not plot arrow for the trade unless Distance toFibonacci Support or Fibonacci Resistance lines are > Ticks2FibResist inputNumTicksToStackOrFib(4) -how many ticks away from a support or resistance to filterout trades from for each of the above filters.UseBandFilter (0)- If large triggers have made it to T-3 Trend Bands outer bands thiswill stop the program from buying or selling due to overbought or oversold conditions.UseSTConditionFilter (0) -This will force BOTH small triggers to be above BOTHlarge triggers or BELOW before buying or sellingUseMacdTrendFilter (0)- Macd trend from small timeframe chart CODE= if bbMacdcrosses over upper Band then macdTrend = +1 else // set Macd trend if bbMacd crossesunder lower Band then macdTrend2 = -1 ;UseMacdLocFilter (0), Force a Macd bb location before taking a trade- +1 = abovezero -1 = below zero ---- +2 outside upper Bollinger - 2= below lower BollingerUseCycleBlockFilter (0) -If the small triggers are TOO far away from the LargeTriggers this will Block a tradeUseCongBlockFilter (0)- If the large triggers are too tight for too long you must have abreakout of the compressed range to start trades againUse5MinSTDirFilter(0)- Synthetically generated 5 Minute Small triggers must becrossed in your favor for trades to be takenUse5MinSTCLocFilter (0)- You must Close on the "trade" side of your 5 minute smalltriggers in order for trades to happenUse5MinMacdTrFilter (0)- Macd Trend must be with you on 5 minute chart. MACDcrossing above or below Bollinger sets the trend for synthetic 5 minute Macd bb linesUseDivrgMblockFilter(0) 4 times tick chart timeframe divergence is present so notrades if true.35
Plot_PaintBars ( true) - This will plot a blue( buy) or red (sell) paint bar on the currentprice data if there is a potential trade setup with the trend as a warning. You can turn thisoff by changing input to False.Plot_Arrow(true)- Plots trade arrows on the chart as a true / false input.StopSensSF (4); stop sensitivity setting for how wide to make the trailing stop whenactive. 2-12 is the usable range.StackMult(.3)- This will determine how wide to scan for stacked areas of indicators. (.2-.4) is useable range.Plot_Trail_Stop (true);- this will turn on or off ( if set to false) the automated trailingstop for the active trade setup.Plot_All_Stacks (true); - This will plot all Stacked areas of indicators on your chart.( see T-3 Fibs <strong>ProTrader</strong> Section for information)Fib_Timeframes (10)Fib_AutoFluSetting (22)Fib_CollMarginTicks (0)Fib_HitMarginTicks (0)Fib_NdaysBack (10)Fib_UpdatePeriod (1440)AreaOffsetTicks (0)36
T-3 Revolution Settings for Testing Trading IdeasWe have included in this version of the Revolution the ability to do some testing so thatyou may understand the full potential of the software in your journey to gain as much ofthat potential as possible. We understand that no one will ever achieve 100% efficiencybut understanding what 100% efficiency is we hope will help you along the way.There are several inputs that are below PLOT_ARROWPlotMaxProfit will plot on your screen a number based on Close of the entry bar tothe BEST POSSIBLE CLOSE throughout the position before the trailing stops have beenhit.PrintSignalData will push to Tradestation print log some vital information you willbe able to use in your testing.Date- Time- Trade#-Long or Short -Symbol- Maximum Risk to Stop dot initially- MaxDrawdown which will tell you how negative the trade went against you before the end ofthe trade - Max Profit Possible in trade ( based on close of best bar) and the running totalfor best possible closing price of a bar in the trade.PrintSigDatatoFile will place a file of this information on your C:\ drive for thosewho are running ninja trader and do not have the ability to view a print log.Our hopes in providing you this information is to give you insight into the total profit andrisk potential of the software and to help you focus in on indicator conditions that arerelated to trades that lose or do not make much money. Also focus in on how to bestcreate your trading plan for taking profits as the trade relates to the indicators. Also tohelp you in assessing WHICH markets and timeframes will help you reach your tradingobjectives.37
10) GLOSSARYAREA = Lines on the chart that can create a bounce.BAR PATTERNS = Helps to pinpoint entries and exits.BEARISH DIVERGENCE = Equal to higher price pivots, and lower MacdPivots, and runs at the top of the price.BOB = Break out Bar, or the first full bar not touching the area on the opposite side ofthe area.BOLLINGER BANDS = Standard deviation of a Macd aka upper band and lower bandBULLISH DIVERGENCE = Equal to lower price pivots, and higher MacdPivots, and runs at the bottom of the price.COB = Confirmation of a Breakout, or the first close completely beyond thehigh/low of the BOB.DIVERGENCE = A difference or a disagreement between prices and Macd. Thisrepresents the potential of a trend change or significant bounce.EXT = An “extreme” pivot that happens at or beyond the Outer Bands.FIBONACCI = Areas of Support and Resistance where a bounce and potential reversalcan be anticipated with supporting indicators.FIBONACCI AREA/MIDBAND BREAKING = When there is a BOB/COB of thearea, and that indicator will change colors.FTP = Floor Trader Pivot, shown as the dotted lines on the minute charts.STACKED AREA = An area for a bounce.LARGE TRIGGERS = Represent the overall trend of the market.LONG = Taking a trade in anticipation of the market going up.MACD BB LINES = Green, red, and white dots are the Macd calculations.MACD BB SLIDE = A sliding along the Bollinger Band will assist in judging thecontinuation of the current trend.38
MACD BB TREND = When the Macd BBs cross the upper Bollinger Band, the Macd Trend isup. When the Macd BBs cross the lower Bollinger Band, the Macd Trend is down.MACDS = Stands for moving average, convergence, Divergence.ONE TO ONES = Useful as intermediate Support or Resistance - white and magentadots on the chart. More powerful when combined with other indicators or on largercharts.RETRACEMENT DIVERGENCE = A discrepancy between the retracementpercentage in price verus the same retracement percentage on the Macd BB linesROLL and GO – is a signal from an “AREA” that have both large triggers and smalltriggers rolling over and strong macd bb dots outside the Bollinger bands.SHORT = Taking a trade in anticipation of the market going down.SMALL TRIGGERS = Represent the short-term expected outcome of themarket.SPRING LOADED (Macd bb lines) – refers to the Bollinger bands tightly compressedaround the Macd BB dots and building up power for a “breakout” pop in a direction.STOPS = Protection if the market goes against a trade.SUPER DIVERGENCE = A regular Divergence where the Macds never violate theopposite Bollinger Band.TARGETS = Area for potential positive exit.TREND BANDS = A channel for the market, also known as the KeltnerChannel.TREND TRADES = A trade taken when the trend is expected to continue.ZERO LINE = The straight line that runs horizontally through the Macd BBs andBollinger Bands with a value of 0.00.ZLR = Zero Line Rejection, or a bounce off of the Zero Line.39
<strong>ProTrader</strong>www.nss-t3.com3400 Research Forest Dr. Suite B9, The Woodlands, TX. 77381Tel: 281.419.2110