GETTING STARTED USER GUIDE - ChartNexus
GETTING STARTED USER GUIDE - ChartNexus
GETTING STARTED USER GUIDE - ChartNexus

Create successful ePaper yourself
Turn your PDF publications into a flip-book with our unique Google optimized e-Paper software.
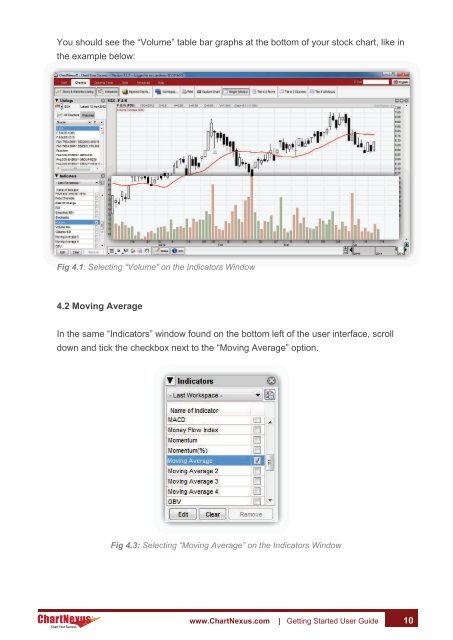
You should see the “Volume” table bar graphs at the bottom of your stock chart, like inthe example below:Fig 4.1: Selecting “Volume” on the Indicators Window4.2 Moving AverageIn the same “Indicators” window found on the bottom left of the user interface, scrolldown and tick the checkbox next to the “Moving Average” option.Fig 4.3: Selecting “Moving Average” on the Indicators WindowChart Your Successwww.<strong>ChartNexus</strong>.com | Getting Started User Guide 10