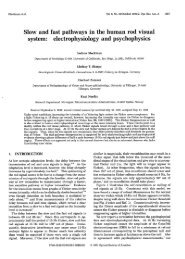
<strong>Journal</strong> <strong>of</strong> <strong>Vision</strong> (2005) 5, 702–716 Stockman & Plummer 707essary their relative modulation to find the best flicker null.Subjects could also reverse the relative phase <strong>of</strong> the twostimuli by 180- to help them find the correct nulling phase.Except where noted, all data points are averaged fromthree or four settings made on at least four separate runs.Other details <strong>of</strong> the experimental procedures are given inthe Results section.18090ASSubjects0The two observers in this work were the authors (ASand DP). Both observers were male, had normal colorvision, and were emmetropic. These studies conform tothe standards set by the Declaration <strong>of</strong> Helsinki, and theprocedures have been approved by local ethics committeesin the United Kingdom and United States.ResultsPhase delaysDelay <strong>of</strong> 520 nm stimulus (deg)-90-180180902.5 Hz7.5 Hz15 Hz22.5 HzDPThe phase delays <strong>of</strong> 520-nm flicker required to null the650-nm equichromatic flicker are shown in Figure 3 for AS(top panel) and DP (bottom panel), measured as a function<strong>of</strong> the radiance <strong>of</strong> the 658-nm background. Flicker frequencies<strong>of</strong> 2.5 (circles), 7.5 (squares), 15 (triangles),and 22.5 (inverted triangles) Hz were used. Below 11.21log 10 quanta s 1 deg 2 (highlighted by the pink area) andabove 12.13 log 10 quanta s 1 deg 2 (highlighted by thegreen area), the phase delays are relatively constant. Inbetween, there are substantial phase shifts.The black symbols show the M-cone phase delays measuredat the corresponding frequencies at Levels 3 and4 replotted from Figure 1 (2.5 Hz phase delays could notbe measured at the highest level). The phase differencesbelow 11.21 log 10 quanta s 1 deg 2 are similar to theM-cone phase delays measured at Level 3, whereas thoseabove 12.13 log 10 quanta s 1 deg 2 are similar to theM-cone phase delays measured at Level 4. In most cases,the 520-nm phase delays are slightly less than those forthe M-cones. This difference arises because the 520-nmtarget generates a small L-cone signal, which is also foundfor 500 and 540 nm targets (see Stockman & Plummer,2005; Stockman et al., 2005).The abrupt changes in the phase delay in the unshadedarea are largest at 2.5 Hz but then fall <strong>of</strong>f as the frequencyincreases. They are close to 180- at 2.5 Hz for both ASand DP. For AS, they then fall to c. 130- at 7.5 and 15 Hz,and to 50- at 22.5 Hz. For DP, they remain large at 170- at7.5 Hz and 200- at 15 Hz and then fall to 40- at 22.5 Hz.The differences between AS and DP are consistent withprevious measurements that indicate that the <strong>slow</strong> M-conesignals for DP are stronger (relative to his fast M-cone0-90-18010.5 11.0 11.5 12.0 12.5Log 10 background intensity (quanta s -1 deg -2 )Figure 3. Phase advances <strong>of</strong> a 520-nm target required to nulla 650-nm target measured as a function <strong>of</strong> the radiance <strong>of</strong> the658-nm background. Data are shown for 2.5 (dotted white circles),7.5 (dotted white squares), 15 (dotted white triangles), and22.5 (dotted white inverted triangles) Hz flicker. The pink area(here and in Figures 4 and 5) indicates the lower radiance rangewithin which the phase delays are consistent with the 520-nmflicker generating mainly a sM signal, whereas the green areaindicates the higher radiance range within which the phases areconsistent with it generating mainly a <strong>slow</strong> +sM signal. The filledsymbols are the corresponding M-cone phase delays fromFigure 1 for 2.5 (dotted black circles), 7.5 (dotted black squares),15 (dotted black triangles), and 22.5 (dotted white invertedtriangles) Hz. Top panel: AS. Bottom panel: DP.signals) than they are for AS (Stockman & Plummer, 2005;Stockman et al., 2005).According to our model, the changes in phase delaybetween 520 and 650 nm flicker should reflect the
<strong>Journal</strong> <strong>of</strong> <strong>Vision</strong> (2005) 5, 702–716 Stockman & Plummer 708transition from the 520-nm flicker generating predominantlysM+fM(+fL) signals at low levels to it generatingpredominantly +sM+fM(+fL) signals at highlevels. Our data are broadly consistent with such a reversal<strong>of</strong> the <strong>slow</strong> M-cone signal because the phaseadjustments change by c. 180- at low to moderate frequencies.At 22.5 Hz, however, the change is only 40- or50-. There are two likely reasons for the shortfall at thisfrequency. First, the <strong>slow</strong> +sM sL signals above thetransition are <strong>slow</strong>er than the sM+sL signals below it(compare the phase delay slopes in Figure 1 and the Dtestimates in Table 1 for Levels 3 and 4). As a result, thetwo opposing pairs <strong>of</strong> <strong>slow</strong> signals ( sM+sL versus+sM sL) are only about 90Y120- apart at 22.5 Hz.Second, the <strong>slow</strong> signals lose sensitivity with increasingfrequency more quickly than the fast signals, so that by22.5 Hz the measured phase delays are closer to those <strong>of</strong>the fast signal (i.e., closer to 0-) (Stockman & Plummer,2005; Stockman et al., 2005).Notice that the required phase adjustments fall to closeto 0- at a Bcritical[ radiance, which lies between 11.60and 11.70 log 10 quanta s 1 deg 2 for AS and between11.65 and 11.75 log 10 quanta s 1 deg 2 for DP. Giventhat the +sM sL signals grow relative to the sM+sLsignals as the background radiance increases, there shouldbe a critical background radiance at which the <strong>slow</strong>signals produced by the 520-nm target all cancel, with theresult that the phase delays will then be those <strong>of</strong> the fastsignals and therefore close to 0-Vas we find.the L-cones by 12.9 times more than the sensitivity <strong>of</strong> theM-conesVwith the result that the two adapted cone typesbecome equally sensitive to 658 nm. The Weber limitsshown in the figure are calculated by normalizing theL- and M-cone spectral sensitivities at 658 nm and thenLog 10 quantal sensitivity ratio (520/650)2.0 ASM-cone1.51.00.5WeberL-cone2.5 Hz7.5 Hz15 Hz22.5 Hz2.0 DP1.5M-coneWeberSpectral sensitivityIf, as our previous work suggests, the predominant signalschange from sM, +sL, +fM, and +fL below the transitionto +sM, sL, +fM, and +fL above it, there shouldbe clear evidence for both intensity- and frequency-dependentchanges in spectral sensitivity across the transition. Moreover,the direction <strong>of</strong> spectral sensitivity changes shouldindicate which cone signals destructively or constructivelyinterfere at a particular intensity level.Figure 4 shows the logarithmic quantal sensitivity ratiosfor detecting 520 and 650 nm flicker at 2.5, 7.5, 15,and 22.5 Hz for AS (upper panel) and DP (bottom panel).The M- and L-cone sensitivity ratios are shown by theupper and lower horizontal lines, respectively (Stockman& Sharpe, 2000). Two horizontal dashed lines are shown.They represent the spectral sensitivity predictions, ifboth the M- and the L-cone sensitivities are independentlycontrolled according to Weber’s Law, for an additiveBluminance[ mechanism with L:M cone input weights <strong>of</strong>1:1 (upper dashed line) and 2:1 (lower dashed line). IfWeber’s Law applies, the sensitivity losses for each conemechanism increase in proportion to the effective background<strong>adaptation</strong>. Consequently, if the L-cones are 12.9times more sensitive to the 658-nm field than theM-cones, the 658-nm field will reduce the sensitivity <strong>of</strong>1.00.5L-cone10.5 11.0 11.5 12.0 12.5Log 10 background intensity (quanta sec -1 deg -2 )Figure 4. Logarithmic quantal sensitivity ratios for detecting 520-and 650-nm flicker measured as a function <strong>of</strong> 658-nm backgroundradiance at 2.5 (dotted white circles), 7.5 (dotted whitesquares), 15 (dotted white triangles), and 22.5 (dotted whiteinverted triangles) Hz. The pink and green areas correspond tothe areas similarly highlighted in Figures 3 and 5. The continuoushorizontal lines labeled M- and L-cone are, respectively, the M-and L-cone sensitivity ratios for detecting 520 and 650 nm, andthe dashed lines are the Weber’s Law predictions. The Weber’sLaw predictions are calculated by scaling the linear L- and M-conespectral sensitivities to be equal at the adapting <strong>wavelength</strong> <strong>of</strong>658 nm, and then adding them together in the ratio <strong>of</strong> 1L:1M(upper dashed lines) or 2L:M (lower dashed lines). All spectralsensitivities are based on the Stockman and Sharpe (2000) conefundamentals. Upper panel: AS. Lower panel: DP.