Long-wavelength adaptation reveals slow ... - Journal of Vision
Long-wavelength adaptation reveals slow ... - Journal of Vision
Long-wavelength adaptation reveals slow ... - Journal of Vision

Create successful ePaper yourself
Turn your PDF publications into a flip-book with our unique Google optimized e-Paper software.
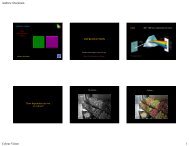
<strong>Journal</strong> <strong>of</strong> <strong>Vision</strong> (2005) 5, 702–716 Stockman & Plummer 704Phase delay <strong>of</strong> resultant (deg)180900-90Slow and fastsignals <strong>of</strong> thesame signSlow-1800 5 10 15 20 25 30∆tFastm∞421.3310.750.50.2500.250.50.7511.3324∞180900-90Slow∆tFastSlow and fastsignals <strong>of</strong> theopposite sign-1800 5 10 15 20 25 30m∞421.3310.750.50.2500.250.50.7511.3324∞Relative amplitude <strong>of</strong> resultant1.000.750.500.250.000 5 10 15 20 25 30m∞ or 04 or 0.252 or 0.51.33 or 0.7511.21.00.80.60.40.20.00 5 10 15 20 25 30m∞ or 04 or 0.252 or 0.51.33 or 0.751Frequency (Hz)Figure 2. Model predictions <strong>of</strong> the phase delay (upper panels) and relative amplitude (lower panels) <strong>of</strong> the resultant <strong>of</strong> the combination <strong>of</strong><strong>slow</strong> and fast signals <strong>of</strong> the same sign (left panels) and <strong>of</strong> opposite sign (right panels). Predictions are shown for <strong>slow</strong> to fast signal ratios,m, ranging from 0 to V, and for a time delay, Dt, between the <strong>slow</strong> and fast signals <strong>of</strong> 33.33 ms.generates a univariant flicker signal, although its severalinput signals can be substantially delayed relative to eachother and can be <strong>of</strong> either positive or negative sign. Thus,two flickering lights <strong>of</strong> any <strong>wavelength</strong> composition detectedsolely by that channel can be flicker-photometricallycancelled or nulled by adjusting their relative amplitudeand phase. Under the conditions <strong>of</strong> our experiments, wefind that nulls are generally possible near-flicker-thresholdat all frequencies above c. 5 Hz. Flicker nulls can also beset at 2.5 Hz under most conditions. In our previouswork, we found evidence for multiple cone inputs to theachromatic flicker channel, which we refer to as BM[ orBL[, according to the cone type from which the inputsignals originate, prefixed by Bf[ or Bs[ for fast or <strong>slow</strong>,and by B+[ or B [ according to their polarity withrespect to the fast signals. For a given condition, theresultant signal from a particular cone type is assumedto be the vector sum <strong>of</strong> its <strong>slow</strong> and fast signal components,which have some fixed ratio <strong>of</strong> signal amplitudes(m) and are separated by a delay <strong>of</strong> Dt (ms). Importantly,the <strong>slow</strong> cone signal can be <strong>of</strong> the same or opposite signas the fast cone signal. Some examples <strong>of</strong> the model predictionsare shown in Figure 2 for <strong>slow</strong> and fast signals<strong>of</strong> the same polarity (left panels) or <strong>of</strong> the opposite polarity(right panels). The horizontal and diagonal lines inthe upper panels, respectively, represent the phase delays<strong>of</strong> the fast signal alone (m ¼ 0) and the <strong>slow</strong> signal alone(m ¼ V) signals. The relative delay <strong>of</strong> the <strong>slow</strong> signal(Dt) in these examples is 33.3 ms, as a result <strong>of</strong> which<strong>slow</strong> and fast signals <strong>of</strong> the same polarity become oppositein phase at 15 Hz and destructively interfere (leftpanel), whereas <strong>slow</strong> and fast <strong>of</strong> the opposite polarity becomethe same in phase at 15 Hz and constructively interfere(right panel). Predictions are shown in Figure 2for several values <strong>of</strong> m.The upper panels show the predicted phase delay <strong>of</strong>the combined <strong>slow</strong> and fast signals, and the lower panelsshow their amplitudes. The phase delays are related to thephase adjustments required to null flickering lights(Figures 1 and 3), whereas the amplitudes are related tothe flicker detection sensitivities (Figures 4 and 5). Theamplitude predictions illustrate the effects <strong>of</strong> destructiveand constructive interference and its dependence on flickerfrequency. The phase predictions are characteristic