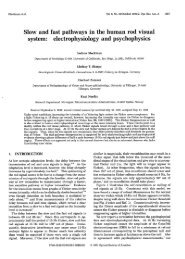
<strong>Journal</strong> <strong>of</strong> <strong>Vision</strong> (2005) 5, 702–716 Stockman & Plummer 703Figure 1. Phase advances <strong>of</strong> M-cone (green dotted circles) or L-cone (red dotted squares) stimuli required to null a 656-nm targetmeasured on 658-nm backgrounds <strong>of</strong> 8.93 (Level 1), 10.16 (Level 2), 11.18 (Level 3), or 12.50 (Level 4) log 10 quanta s 1 deg 2 . TheM-cone stimuli were alternating pairs <strong>of</strong> L-cone-equated 540 and 650 nm targets; and the L-cone stimuli were pairs <strong>of</strong> M-cone-equated650 and 550 nm targets. The continuous lines are fits <strong>of</strong> a model in which the cone signals are assumed to be the resultant <strong>of</strong> a fastsignal and a delayed <strong>slow</strong> signal <strong>of</strong> the same or opposite sign. Left panels: AS. Right panels: DP. For further details, see Stockman et al.(2005) and Stockman & Plummer (2005). At Levels 1, 2, and 3, the dominant cone signals underlying the phase data are assumed to be+fM+fL and sM+sL (lower right circuit), whereas at Level 4 they are assumed to be +fM+fL and +sM sL (upper right circuit).frequencies <strong>of</strong> between 2.5 and 25 Hz were used. Initially,the flickering stimuli were alternated, and the subjectswere asked to adjust their relative phase (and amplitude)to null or cancel the perception <strong>of</strong> flicker. The data inFigure 1 show the phase adjustments away from oppositephase that are required to null either M-cone flicker (greendotted circles) or L-cone flicker (red dotted squares) withthe 656-nm flicker (i.e., flicker Bequichromatic[ with thebackground, and which is thus unlikely to generate asubstantial spectrally opponent or chromatic flickersignal; see also below). Zero degree on these plots meansthat the two lights cancelled when they were physically inopposite phase (i.e., when they were alternated), whereasT180- means that they cancelled when they were in the samephase. Thus, the plotted phase delays indicate those delaysintroduced within the visual system. As can be seen, some<strong>of</strong> the phase adjustments are substantial even at moderatelyhigh temporal frequencies. They are inconsistentwith the conventional model <strong>of</strong> luminance, which, apartfrom phase differences that arise because <strong>of</strong> the selective<strong>adaptation</strong> <strong>of</strong> the L-cones by the long-<strong>wavelength</strong> field,predicts that no phase adjustments should be required.The data shown in Figure 1 illustrate another intriguingeffect. In our previous papers, we emphasized that some <strong>of</strong>the phase adjustments are large, particularly for the nullsinvolving M-cone flicker. What we did not emphasize isthe abrupt change in the signs <strong>of</strong> the M- and L-cone phasedelays that occurs between two critical level (Levels 3 and4). That change is the focus <strong>of</strong> the measurements andanalysis presented in this paper.Working modelFor the interpretation <strong>of</strong> our data, we assume that thechannel that underlies the perception <strong>of</strong> achromatic flicker
<strong>Journal</strong> <strong>of</strong> <strong>Vision</strong> (2005) 5, 702–716 Stockman & Plummer 704Phase delay <strong>of</strong> resultant (deg)180900-90Slow and fastsignals <strong>of</strong> thesame signSlow-1800 5 10 15 20 25 30∆tFastm∞421.3310.750.50.2500.250.50.7511.3324∞180900-90Slow∆tFastSlow and fastsignals <strong>of</strong> theopposite sign-1800 5 10 15 20 25 30m∞421.3310.750.50.2500.250.50.7511.3324∞Relative amplitude <strong>of</strong> resultant1.000.750.500.250.000 5 10 15 20 25 30m∞ or 04 or 0.252 or 0.51.33 or 0.7511.21.00.80.60.40.20.00 5 10 15 20 25 30m∞ or 04 or 0.252 or 0.51.33 or 0.751Frequency (Hz)Figure 2. Model predictions <strong>of</strong> the phase delay (upper panels) and relative amplitude (lower panels) <strong>of</strong> the resultant <strong>of</strong> the combination <strong>of</strong><strong>slow</strong> and fast signals <strong>of</strong> the same sign (left panels) and <strong>of</strong> opposite sign (right panels). Predictions are shown for <strong>slow</strong> to fast signal ratios,m, ranging from 0 to V, and for a time delay, Dt, between the <strong>slow</strong> and fast signals <strong>of</strong> 33.33 ms.generates a univariant flicker signal, although its severalinput signals can be substantially delayed relative to eachother and can be <strong>of</strong> either positive or negative sign. Thus,two flickering lights <strong>of</strong> any <strong>wavelength</strong> composition detectedsolely by that channel can be flicker-photometricallycancelled or nulled by adjusting their relative amplitudeand phase. Under the conditions <strong>of</strong> our experiments, wefind that nulls are generally possible near-flicker-thresholdat all frequencies above c. 5 Hz. Flicker nulls can also beset at 2.5 Hz under most conditions. In our previouswork, we found evidence for multiple cone inputs to theachromatic flicker channel, which we refer to as BM[ orBL[, according to the cone type from which the inputsignals originate, prefixed by Bf[ or Bs[ for fast or <strong>slow</strong>,and by B+[ or B [ according to their polarity withrespect to the fast signals. For a given condition, theresultant signal from a particular cone type is assumedto be the vector sum <strong>of</strong> its <strong>slow</strong> and fast signal components,which have some fixed ratio <strong>of</strong> signal amplitudes(m) and are separated by a delay <strong>of</strong> Dt (ms). Importantly,the <strong>slow</strong> cone signal can be <strong>of</strong> the same or opposite signas the fast cone signal. Some examples <strong>of</strong> the model predictionsare shown in Figure 2 for <strong>slow</strong> and fast signals<strong>of</strong> the same polarity (left panels) or <strong>of</strong> the opposite polarity(right panels). The horizontal and diagonal lines inthe upper panels, respectively, represent the phase delays<strong>of</strong> the fast signal alone (m ¼ 0) and the <strong>slow</strong> signal alone(m ¼ V) signals. The relative delay <strong>of</strong> the <strong>slow</strong> signal(Dt) in these examples is 33.3 ms, as a result <strong>of</strong> which<strong>slow</strong> and fast signals <strong>of</strong> the same polarity become oppositein phase at 15 Hz and destructively interfere (leftpanel), whereas <strong>slow</strong> and fast <strong>of</strong> the opposite polarity becomethe same in phase at 15 Hz and constructively interfere(right panel). Predictions are shown in Figure 2for several values <strong>of</strong> m.The upper panels show the predicted phase delay <strong>of</strong>the combined <strong>slow</strong> and fast signals, and the lower panelsshow their amplitudes. The phase delays are related to thephase adjustments required to null flickering lights(Figures 1 and 3), whereas the amplitudes are related tothe flicker detection sensitivities (Figures 4 and 5). Theamplitude predictions illustrate the effects <strong>of</strong> destructiveand constructive interference and its dependence on flickerfrequency. The phase predictions are characteristic