Relocation Survey - Atlas Van Lines
Relocation Survey - Atlas Van Lines
Relocation Survey - Atlas Van Lines

Create successful ePaper yourself
Turn your PDF publications into a flip-book with our unique Google optimized e-Paper software.
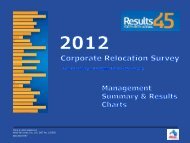
Corporate<strong>Relocation</strong><strong>Survey</strong>ResultsFORTY-FIFTH ANNUAL45• In 2012, percentages of firms offering full reimbursement totransferees or new hires return to levels near 2003-2005highs. While the use of lump sums for both transfereesand new hires has generally increased over the past tenyears, it dips slightly in 2012 but remains at elevated levelscompared to 2003-2007. The use of partial reimbursementdrops significantly compared to last year for both transfereesand new hires, remaining markedly above 2003-2007 fortransferees, but near historic lows for new hires over thepast ten years.• The percentages of small and large firms offering fullreimbursement to transferees or new hires approach orexceed the highest levels in ten years, while the percentageof mid-size firms offering this increased only slightly andremains significantly below historic highs. Among mid-sizeand large firms, the use of lump sums remains near historichighs, roughly double or more its lowest levels over thepast ten years, while at small firms it remains at its highestlevel of use among transferees, but declines in favor slightlyfor new hires.• The use of partial reimbursement compared to last yearfalls across company size for both transferees and newhires, with the most pronounced drops occurring for newhires at large and small firms (38% vs. 50%, 34% vs. 47%).This matches the ten-year low for new hires among smallfirms, although usage remains well above historic lowsat both mid-size and large firms for new hires and acrosscompany size for transferees.• Approximately half or more relocations last year were fullyreimbursed across company size, but a significantly higherpercentage of relocations by large firms were fully reimbursedthan at small to mid-size companies (67% vs. 49% and 53%).Question 32a: Lump Sum Payment ApplicationFor what types of relocation costs are lump sum paymentstypically offered to relocating employees?Miscellaneous AllowancesEntire <strong>Relocation</strong> CostTravel ExpensesTemporary HousingHousehold Goods Shipping/StorageRental Assistance/TransactionsReal Estate Assistance/TransactionsOther16%11%4%41%38%30%51%63%0 10 20 30 40 50 60 70 80Lump Sum Application:For the second year, the survey included additionalquestions about the costs covered under lump sumsand the employees to whom they are offered. Amongfirms using lump sums, far more firms offered them forthe entire relocation compared to last year (51% vs. 39%).Small firms were the most likely to do this in 2011 (49%vs. 38% mid-size and 29% large firms), but now roughlyhalf of all firms across company size indicate doing so in2012. Despite this change, some trends remained. Similarto last year, more than a third of firms use lump sumpayments for temporary housing and more than a fourthoffer them for shipping and storing household goods.Small and mid-size firms remain much more likely to uselump sums for shipping and storage expenses than largefirms (44% and 30% vs. 17%). Large firms are more likelythan small or mid-size companies to use lump sums formiscellaneous allowances (79% vs. 42% and 64%) aswell as for temporary housing expenses (55% vs. 31%and 30%).Some shifts in lump sum application may be relatedto shifts in who is commonly receiving them. In 2011,nearly half or more firms reported using lump sumsfor nearly every type of employee with the exceptionof homeowners (31%). This year, the gaps between whoreceives these benefits widen. Entry level employeesare much more likely than executives to be offered alump sum (52% vs. 32%), new hires are more likely thantransferees (65% vs. 43%), and renters are more likelythan homeowners (48% vs. 30%). In general, employeesthat would typically cost less to relocate are more likely tobe offered lump sums (i.e. entry level employees, renters,etc.), while those that typically receive more expensivepackages are less likely (i.e. transferees, executives, etc.).The greatest decrease in lump sum offers compared tolast year occurs for executives (32% vs. 43%).This year, new hires are much more likely thantransferees to receive lump sums across company size(56% to 71% vs. 37% to 48%), a change from 2011 whenthere was far less discrimination between new hires andtransferees at mid-size (60% vs. 53%) and large firms(55% vs. 52%). However, similar to last year, mid-size andlarge firms more commonly offer lump sums to entrylevel employees than to experienced professionals orexecutives (53% vs. 38% and 24%, 72% vs. 45% and 40%,respectively), while small firms remain more likely to offerthem to experienced professionals than to entry levelemployees (48% vs. 29%).Cost CoverageOn average, as in the previous nine years, nine out often companies reimburse or pay some relocation costsfor transferees or new hires. Overall, coverage of corerelocation expenses (i.e. pack all items, move unlimitedweight, unpack all items, etc.) remains nearly identical tolast year or increases slightly. The percentages of firmsreimbursing core relocation expenses nearly meet orexceed historically high levels, similar to last year aswell. Across company size, the percentages of firms thatreimburse core relocation expenses remain similar tolast year and to most of the past nine years with oneexception: the percentage of small firms covering thecost of relocating an automobile is the highest in tenyears and is significantly higher than in 2003-2010(69% vs. 51%+).Half or more of companies reimburse/pay to:Pack all items (82%)Move an automobile (80%)Move exercise equipment (52%)Move a second automobile (52%)• Unpack all items (49%)While the percentages of firms covering some noncorerelocation benefits remain well below historic peaksand nearly match or surpass ten-year lows, those offeringto cover costs associated with relocating a secondautomobile, picking up items from a second home,permanent/extended storage, moving pets, and movingvia containerized shipment remain the same or increaseover last year overall, rising to levels significantly abovehistoric lows and approaching, meeting or exceeding thehighs of the past nine years.Specialized Assistance for Homeowners/RentersMost firms offer specialized relocation assistance forhomeowners, however, small firms remain less likely todo so than mid-size or large firms. Similar to the pastfour years, the percentage of firms offering loss-on-salereimbursement remains significantly elevated over 2007(31% vs. 20%). The percentages of firms offering qualifiedhome-sale programs and bonuses/incentives foremployee-generated home sales stay significantly above2007-2008 as well, similar to the past two years (39% vs.31%+, 28% vs. 21%+). Additionally, the percentage offeringmortgage subsidies/allowances remains significantlylower than in 2008-2009 for the second straight year(14% vs. 22%+). Also similar to last year, significantly morefirms reimbursed employees for home sale costs thanResultsFORTY-FIFTH ANNUAL45did in 2010 (57% vs. 50%). Two shifts of note occur in 2012:significantly more firms are offering home marketingassistance compared to the past five years (53% vs.40%+) and significantly more are offering storage (61% vs.50%+) compared to ResultsFORTY-FIFTH 2007, 2010-2011.ANNUAL45For homeowners, more than half of firms offerthe following to transferees or new hires:Temporary housing allowance (72%)Home-finding trips (68%)Storage (61%)Reimburse/pay for home sale costs (57%)Reimburse/pay for home purchase costs (55%)• Home marketing assistance (53%)Most firms offer specialized relocation assistance forrenters, however, small firms remain less likely to do sothan mid-size or large firms. Overall, percentages of firmsoffering each type of renter-specific assistance increasecompared to last year with one exception: fewer firmsallow temporary living allowances to be applied towardrent (19% vs. 23%), and this is the lowest level in ten yearsoverall. Compared to the past nine years, significantlymore firms say they reimburse/pay for lease cancellation(68% vs. 55%+ 2003, 2005-2011), home-finding trips (66%vs. 55%+ 2006-2007, 2010), storage (54% vs. 41%+ 2003-2007, 2010-2011), and apartment search/finder’s fees (39%vs. 27%+ 2003, 2006-2008, 2010).For renters, more than half of firms offer thefollowing to transferees or new hires:Temporary housing allowance (70%)Reimburse/pay for lease cancellation (68%)Home-finding trips (66%)• Storage (54%)Manufacturing/processing firms are more likely thanfor-profit service firms to offer specialized assistanceto homeowners in general (95% vs. 82%), as wellas across specific assistance categories, with twoexceptions: qualified home sale program (42% vs. 35%)and storage (65% vs. 62%). Both types of firms sharesimilar likelihoods of offering renter-specific assistanceoverall (93% vs. 90%), as well as across categories withone exception: manufacturing/processing firms aremore likely to offer renters home-finding trips (74% vs.58%). International firms are more likely than regional ornational firms to offer nearly all of the specific types ofhomeowner assistance listed, and are more likely to offerrenter-specific assistance overall (94% vs. 88%+).9 10