european incoherent scatter scientific association - EISCAT
european incoherent scatter scientific association - EISCAT
european incoherent scatter scientific association - EISCAT

You also want an ePaper? Increase the reach of your titles
YUMPU automatically turns print PDFs into web optimized ePapers that Google loves.
<strong>EISCAT</strong> SCIENTIFIC ASSOCIATION<strong>EISCAT</strong>EUROPEAN INCOHERENT SCATTERSCIENTIFIC ASSOCIATIONANNUAL REPORT 2009
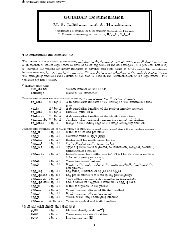
<strong>EISCAT</strong> Radar SystemsLocation Tromsø Kiruna Sodankylä LongyearbyenGeographic coordinates 69 ◦ 35’N 67 ◦ 52’N 67 ◦ 22’N 78 ◦ 09’N19 ◦ 14’E 20 ◦ 26’E 26 ◦ 38’E 16 ◦ 01’EGeomagnetic inclination 77 ◦ 30’N 76 ◦ 48’N 76 ◦ 43’N 82 ◦ 06’NInvariant latitude 66 ◦ 12’N 64 ◦ 27’N 63 ◦ 34’N 75 ◦ 18’NBand VHF UHF UHF UHF UHFFrequency (MHz) 224 931 931 931 500Maximum bandwidth (MHz) 3 8 8 8 10Transmitter 1 klystron 2 klystrons - - 16 klystronsChannels 8 8 8 8 6Peak Power (MW) 1.6 2.0 - - 1.0Average power (MW) 0.20 0.25 - - 0.25Pulse duration (ms) 0.001–2.0 0.001–2.0 - - 0.0005–2.0Phase coding binary binary binary binary binaryMinimum interpulse (ms) 1.0 1.0 - - 0.1Receiver analog analog analog analog analogSystem temperature (K) 250–300 90–110 50 50 65–80Digital processing 14 bit ADC, 32 bit complex, autocorrelation functions, parallel channels 12 bit ADC, lag profiles32 bit complexAntenna 1 Antenna 2Antenna parabolic cylinder parabolic dish parabolic dish parabolic dish parabolic dish parabolic dish120 m×40 m steerable 32 m steerable 32 m steerable 32 m steerable 32 m steerable 42 m fixedFeed system line feed Cassegrain Cassegrain Cassegrain Cassegrain Cassegrain128 crossed dipolesGain (dBi) 46 48.1 48.1 48.1 42.5 44.8Polarisation circular circular any any circular circular<strong>EISCAT</strong> Heating Facility in TromsøFrequency range: 4.0–8.0 MHz, Maximum transmitter power: 12×0.1 MW, Antennas: Array 1 (5.5–8.0 MHz)30 dBi, Array 2 (4.0–5.5 MHz) 24 dBi, Array 3 (5.5–8.0 MHz) 24dBi.Additionally, a Dynasonde is operated at the heating facility.Cover picture: Artist’s view of a future <strong>EISCAT</strong>_3D active site.
<strong>EISCAT</strong> SCIENTIFIC ASSOCIATION<strong>EISCAT</strong> Scientific Association2009
<strong>EISCAT</strong>, the European Incoherent Scatter Scientific Association, is established to conduct research onthe lower, middle and upper atmosphere and ionosphere using the <strong>incoherent</strong> <strong>scatter</strong> radar technique.This technique is the most powerful ground-based tool for these research applications. <strong>EISCAT</strong> is alsobeing used as a coherent <strong>scatter</strong> radar for studying instabilities in the ionosphere, as well as for investigatingthe structure and dynamics of the middle atmosphere and as a diagnostic instrument inionospheric modification experiments with the heating facility.There are eleven <strong>incoherent</strong> <strong>scatter</strong> radars in the world, and <strong>EISCAT</strong> operates three of the higheststandardfacilities. The experimental sites of <strong>EISCAT</strong> are located in the Scandinavian sector, northof the Arctic Circle. They consist of two independent radar systems on the mainland, together witha further radar constructed on the island of Spitzbergen in the Svalbard archipelago — the <strong>EISCAT</strong>Svalbard Radar — Scandinavia (see schematic and operating parameters on the inside of the frontcover).The <strong>EISCAT</strong> UHF radar operates in the 931 MHz band with a peak transmitter power of 2.0 MW and32 m, fully steerable parabolic dish antennas. The transmitter and one receiver are in Tromsø (Norway).Receiving sites are also located near Kiruna (Sweden) and Sodankylä (Finland), allowing continuoustri-static measurements to be made.The monostatic VHF radar in Tromsø operates in the 224 MHz band with a peak transmitter powerof 1.6 MW and a 120 m × 40 m parabolic cylinder antenna, which is subdivided into four sectors. Itcan be steered mechanically in the meridional plane from vertical to 60 ◦ north of the zenith; limitedeast-west steering is also possible using alternative phasing cables.The <strong>EISCAT</strong> Svalbard radar (ESR), located near Longyearbyen, operates in the 500 MHz band witha peak transmitter power of 1.0 MW, a fully steerable parabolic dish antenna of 32 m diameter, and afixed field aligned antenna of 42 m diameter. The high latitude location of this facility is particularlyaimed at studies of the cusp and polar cap region.The basic data measured with the <strong>incoherent</strong> <strong>scatter</strong> radar technique are profiles of electron density,electron and ion temperature, and ion velocity. Subsequent processing allows a wealth of further parameters,describing the ionosphere and neutral atmosphere, to be derived. A selection of well-designedradar pulse schemes are available to adapt the data-taking routines to many particular phenomena,occurring at altitudes between about 50 km and more than 2000 km. Depending on geophysical conditions,a best time resolution of less than one second and an altitude resolution of a few hundred meterscan be achieved.Operations of 3–4000 hours each year are distributed equally between Common Programmes (CP)and Special Programmes (SP). At present, six well-defined Common Programmes are run regularly,for between one and three days, typically about once per month, to provide a data base for long termsynoptic studies. A large number of Special Programmes, defined individually by Associate scientists,are run to support national and international studies of both specific and global geophysical phenomena.Further details of the <strong>EISCAT</strong> system and operation can be found in various <strong>EISCAT</strong> reports, includingillustrated brochures, which can be obtained from <strong>EISCAT</strong> Headquarters in Kiruna, Sweden.The investments and operational costs of <strong>EISCAT</strong> are shared between:China Research Institute of Radiowave Propagation, Peoples Republic of ChinaDeutsche Forschungsgemeinschaft, GermanyNational Institute of Polar Research, JapanNorges forskningsråd, NorwayScience and Technology Facilities Council, United KingdomSolar-Terrestrial Environment Laboratory, Nagoya University, JapanSuomen Akatemia, FinlandVetenskapsrådet, Sweden4
Studies of the thermosphere . . . . . . . . . . . . . . . . . . . . . . . . . . . . . . . . . . . . . . . 30Temperature enhancements and vertical winds in the lower thermosphere associatedwith auroral heating during the Dynamics and Energetics of the Lower Thermospherein Aurora (DELTA) campaign . . . . . . . . . . . . . . . . . . . . . . . . . . 30Meso-scale thermospheric response . . . . . . . . . . . . . . . . . . . . . . . . . . . . . . . 31Acceleration mechanism of high-speed neutral wind observed in the polar lower thermosphere. . . . . . . . . . . . . . . . . . . . . . . . . . . . . . . . . . . . . . . . . . 31DELTA-2 campaign: Study of the energetics and the wind dynamics in the polar lowerthermosphere . . . . . . . . . . . . . . . . . . . . . . . . . . . . . . . . . . . . . . . . 32Studies of dust and meteorites . . . . . . . . . . . . . . . . . . . . . . . . . . . . . . . . . . . . . . 32Measurements of meteor smoke particles during the ECOMA-2006 campaign . . . . . . . 32High statistics radar meteor studies at <strong>EISCAT</strong> . . . . . . . . . . . . . . . . . . . . . . . . . 33Signatures of mesospheric particles in ionospheric data . . . . . . . . . . . . . . . . . . . . 34Solar wind studies . . . . . . . . . . . . . . . . . . . . . . . . . . . . . . . . . . . . . . . . . . . . . 34Interaction a between medium-scale transient in the solar wind and a stream interactionregion . . . . . . . . . . . . . . . . . . . . . . . . . . . . . . . . . . . . . . . . . . . . 34Theoretical studies of <strong>incoherent</strong> <strong>scatter</strong>ing spectra . . . . . . . . . . . . . . . . . . . . . . . . . . 3520-moment approximation for ion velocity distribution and its application in calculationsof <strong>incoherent</strong> <strong>scatter</strong> spectra . . . . . . . . . . . . . . . . . . . . . . . . . . . . . . . . 35Incoherent <strong>scatter</strong> spectra of collisional plasma . . . . . . . . . . . . . . . . . . . . . . . . . 35List of publications 2009 37<strong>EISCAT</strong> Operations 2009 40Beynon medals 44<strong>EISCAT</strong> organisational diagram 2009 45Committee Membership and Senior Staff 46Appendix: <strong>EISCAT</strong> Scientific Association Annual Report, 2009 49The <strong>EISCAT</strong> Associates, December 2009 63Contact Information 646
The Council Chairperson’s sectionThe transition from the traditional <strong>EISCAT</strong> activitiesto preparatory work for a new radar system— including major upgradings both in themainland radars and in Svalbard — was the mostimportant topic in the work of the <strong>EISCAT</strong> Councilduring 2009. The performance of the VHF radarcontinued to be below optimal as only one of theklystrons was in use. On the other hand, the plansfor renovation work were in fair wind. The EIS-CAT_3D concept was accepted to the ESFRI RoadMap at the end of 2008 and the EU-funded DesignStudy for the 3D concept ended successfullyin spring 2009. In addition, China made a very fascinatingproposal to extend the ESR system with athird antenna dish.The composition of the <strong>EISCAT</strong> Association andits management structures were discussed severaltimes in the Council meetings. In particular,the role of the <strong>EISCAT</strong> Management Committee(EMC) was reconsidered. The wish from the newDirector, Dr. Esa Turunen, was that this Committeewould provide him a link towards the Councilnot only during the Council meetings. The discussionsin the Council and EMC finally led to a solutionwhere EMC was renamed Council AdvisoryGroup (CAG) and its tasks in the Statutes were reformulated.CAG’s role is to advice the Councilon matters related to administrative issues, developmentof facilities and the Association, finances,legal issues, planned operations and other itemsrelevant for the Council. Both the Director andthe Council chairperson participate in the CAGwork. The Council supporting roles of SOC (ScientificOversight Committee) and CAG are different:SOC can give its recommendations entirely fromthe basis of <strong>scientific</strong> argumentation while CAG’stask is to evaluate SOC’s recommendations fromthe viewpoint of the available resources in the Association.For this reason it was recommendedthat both SOC and CAG would arrange their gatheringsbefore the Council meetings and in such atimeframe that CAG can take into account the SOCoutput in its recommendations to the Council.The criteria for full versus associate membershipare under continuous discussion because duringrecent years some old member countries havedecided to leave <strong>EISCAT</strong> and new partners arestepping in. The re-organization of UK sciencefunding structures in 2009 had an impact also tothe <strong>EISCAT</strong> management and economy situationwhich further complicated the picture. In an additionalCouncil meeting arranged as a telecomat the end of 2009, the opportunities for the UKto make some changes in its representatives andcommitments for the Association were discussedextensively. The negotiations for Ukraine’s membershipin <strong>EISCAT</strong> continued in 2009 and as a transitionperiod solution <strong>EISCAT</strong> made a one-yearcollaboration agreement with this country. Russiacontinued collaboration with the Associationby buying significant amount of observing timeand the links towards the Russian science communitywere strengthened by inviting a Russian representativeto SOC. In the Council discussions itwas noted that the long-term commitments are essentialfor the core operations of the Associationand for this reason they can be considered as thecornerstone criterion for a full membership status.On the other hand, joining <strong>EISCAT</strong> should be attractiveand easy also for countries whose sciencefunding is organized in shorter cycles than the fiveyear cycle used in the <strong>EISCAT</strong> membership rules.In this controversial situation it is still importantto guarantee fair and equal treatment for all membersin the Association.The practice where a staff representative participatesin the Council meetings was tested duringthe year 2008. This practice ended in 2009because the staff had expressed the opinion thatthe presence of their representative is needed onlywhen the Council needs the staff opinion to guideits solutions. The Council decided to accept thischange, but on the other hand it encouraged thestaff to continue the biennial selection of a staffrepresentative. The wish is to continue the dialoguebetween staff and the Council and the messagefrom the Council Chairperson is that bothsides can serve as the initiator in this discussion.Dr. Kirsti KauristieChairperson of the <strong>EISCAT</strong> Council7
Director’s pagesAs in January 2009 I was handed over the responsibilityof the daily management and operationof the facilities of the <strong>EISCAT</strong> Scientific Association,as the new Director, I felt strong confidence:first, on the continuing capacity of the Associationbeing able to serve its users for their <strong>scientific</strong>needs in providing measurement opportunitiesat the modern ISR operational level, and second,in inspiring and motivating its user communityto develop the ISR method towards a brandnew future. The future had been outlined duringthe achievements in the soon to be finished EIS-CAT_3D Design Study. This confidence was notonly based on my earlier experience as a user ofthe <strong>EISCAT</strong> radars; having been the PI of manyFinnish radar campaigns through the years, I hadmet devoted, committed and skilful staff at thesites. Similar feelings were passed to me whilemeeting the enthusiasm and guidance given bythe various active <strong>EISCAT</strong> Committee members,starting at the last year’s Council meeting in Kunming,China, throughout the year in the ScienceOversight and <strong>EISCAT</strong> Management Committeemeetings. Specially the previous director Tony vanEyken, Prof. Asgeir Brekke and Dr. Kirsti Kauristie,the previous and new Council chairs respectively,stood by my side as immediate support, usinga lot of their time when guiding me into howthe activities of the <strong>association</strong> are to be seen in internationalcontext.But the most significant strengthening of myconfidence on the strengths of <strong>EISCAT</strong> appeared inthe beginning of the year, when the <strong>EISCAT</strong> staffgathered for its Annual Review meeting in Pallastunturiin Finland on 11–13 February. Staff reportsof the technical status of the various parts of ourdistributed facilities impressed me in dedication,detail and honest evaluation. I was confirmed that<strong>EISCAT</strong> has its most important resource in the existingstaff, all doing their best at highest possiblelevel of expertise and with experience gainedthrough many, many years of operation and maintenancetasks. As <strong>EISCAT</strong> had gone through severalsuccessful upgrades during the history, thecore competence to take similar renewal actionsfor the future, is at place already. It would bemy task to ensure that this competence would notbe lost with possibly restricted financial resourcesforeseen in the near future and that there wouldbe ways to find new resources, which could be directedtowards the next renewal. The total numberof <strong>EISCAT</strong> staff however had been cut duringthe recent years to a minimum, which wouldnot last too many unexpected losses. Even nowsome part of preventive maintenance had to beabandoned, simply due to less manpower available.However, all technical problems appearingat the sites during the year were solved with minimumdelays, and the overall maintenance task appearedto be manageable at all the sites. As EIS-CAT is a distributed facility located in the territoryof three different countries, Sweden, Finland, Norwayand Svalbard, the large distances set up somespecific demands in internal communication. Wedecided to establish some new meetings, such astwice a year a site leader meeting, where leadingstaff from Headquarters and from all the siteswould meet physically for one day discussions.Naturally the internal site meetings were encouraged.These were regularly held at the sites butwere missing at the Headquarters and were introducedthere. Also the <strong>EISCAT</strong> scientists decided tohave virtual meetings, testing a few times internetbasedconference solutions. However, the conclusionof these tests was that with our various connectionsand hardware set-ups, still at this phase astandard teleconference by ordinary phones is themost reliable virtual meeting method.The <strong>association</strong> is facing some changes, whichshould be seen as opportunities to renew significantlywithin few years in future. Russia successfullyconducted <strong>EISCAT</strong> experiments during theiraffiliate agreement, where they essentially buy experimenttime similar to what France is doing. TheRussian contribution is at an essential level financiallyand an agreement is written for three years.With Ukraine we had a minor level agreement,which made the first purely Ukrainian <strong>EISCAT</strong> experimentspossible. This was a one year arrangementat this stage, but continuation is expected.8
The long-standing <strong>EISCAT</strong> Associate Science andTechnology Facilities Council (STFC) in the UK informed<strong>EISCAT</strong> that by end of 2009, the UK associateshipwould be transferred to the National EnvironmentResearch Council (NERC). At this stageof the transfer, which includes some negotiationswithin Council, an agreement with NERC is beingsigned to start as the UK associate from 2010.We thank STFC for the extensive work during theyears, as generally known, the UK has led manydevelopments in <strong>EISCAT</strong> in the past. At the sametime we welcome NERC to continue the work andpossibly bring in new fields of their interests to the<strong>EISCAT</strong> activities.European Union has been funding access to EIS-CAT facilities in the TransNational Access program,which ended in 2009. The TNA programdid not reach its planned target, there were fewerusers than anticipated. As there is currently noforeseen similar funding appearing in Europe, onecould ask if there could be an <strong>EISCAT</strong> fundedTNA-type program available in the future? An optionwould be combine this somehow with the currentthird party proposals. In any case TNA hassucceeded in bringing new countries to the userlist of <strong>EISCAT</strong>. One should continue in creatingopportunities for these research groups who havelearnt to know <strong>EISCAT</strong>, in order to be able to createan enlarging and collaborating <strong>EISCAT</strong> user communitysimply because the ISR method, data analysisand sophisticated combined use of ISR datawith other measurements, are concepts which willtake some time for any individual to master.Operations in 2009 were reduced as comparedto the previous year. This occurred naturally, sincein 2008 one still had the International Polar Yearoperations running. The annual measurementhours were 3688 in total. The Tromsø VHF radaris running with one klystron only. The repairedone is kept as a reserve currently, since the EIS-CAT Site Leaders meeting in May 2009 estimateda 7 months break in operations to be the result ifthe second klystron would be taken into use. TheTromsø site has suffered from limited engineeringmanpower, but this is now helped by hiring a newengineer Jan Børre Henriksen. The Tromsø scientistDr. Lisa Baddeley left <strong>EISCAT</strong> in July 2009, inorder to work as the SPEAR scientist at UNIS. Atthe heating upgrade in Tromsø, there are still issuesto be solved, but the work is ongoing. Heatingsuffers from small amount of technical supportstaff, which would be needed to help the responsibleSenior Scientist. The Tromsø engineers are devotingpart of their time in order to support Heatingmaintenance. It should be also noted here thatin addition to the Dynasonde in Tromsø, <strong>EISCAT</strong>also has a Dynasonde in operation on Svalbard,and all the Dynasonde data are available on the internet.At the remote sites Kiruna and Sodankylä,we are still having three persons at each site, butthere is a reduction foreseen soon, as in 2010 wewill have one staff retirement at both sites. Refillingthese positions is not anticipated since weexpect diminishing operations. The receiver frequencyprotections will end at both sites in 2010.<strong>EISCAT</strong> continued some exceptional observationsin 2009. Beyond standard ISR operationsone could mention the space debris detections afterthe Iridium-Cosmos satellite collision in spring2009. The Iridium cloud orbital plane passes aswell as the Cosmos cloud passes are clearly identifiablein data, which could be used to improvethe current statistical model. The Finnish <strong>EISCAT</strong>user group introduced also the use of non-uniforminterpulse periods to receive echoes from all altitudes.In these experiments efficient space debrisand ISR measurements can be combined. Typical<strong>EISCAT</strong> measurements leave over 50% of theranges blank because the transmission and groundclutter always block echoes from the same rangesfor each transmission. Just now we are not foreseeingany more space debris measurements, unlessEuropean Space Agency is requesting relatedoperations.<strong>EISCAT</strong> users are in the process of setting upsome extraordinary instrumentation at the radarsites: The Japanese lidar installation at the Tromsøsite includes three container houses. When in operationthe lidar laboratory would be a major opticalinstrument to be used with <strong>EISCAT</strong> radars for9
the next ten years. The interferometer at ESR site iscurrently under refurbishment and a new data acquisitionis being installed. First operational datais expected next year.Year 2009 marked the successful finishing ofthe 4-year long EU-funded Design Study of the<strong>EISCAT</strong>_3D radar concept. In December 2008,the European Strategy Forum on Research Infrastructures,ESFRI, had selected <strong>EISCAT</strong>_3D onits Roadmap of strategically important infrastructures.As proposed facilities on this Roadmapshould be attractive for the global science communityfor the next 20–30 years, but located inEurope, <strong>EISCAT</strong> had gained a good science politicalstarting point with the <strong>EISCAT</strong>_3D concept.The proposal was submitted by Swedish ResearchCouncil as the initiator, and interestingly, EIS-CAT_3D was placed in the Environmental groupof RI projects. A similar ESFRI status was given atthe same time to a Norwegian proposal, The SvalbardIntegrated Arctic Earth Observation System,SIOS, where research activities from the bottom ofthe sea up to the upper atmosphere and geospace,based on the existence of measurements and measurementsites in the Svalbard area, were proposedto be strengthened and coordinated internationallyas a concerted but interdisciplinary effort. The<strong>EISCAT</strong> Svalbard radar would be an essential partof the upper atmospheric research programme ofSIOS. SIOS was in a very similar developmentstage as the <strong>EISCAT</strong>_3D proposal, the next stepwould be to apply funds for a preparatory phaseaction with selected partner institutions. Such apreparatory phase should solve all issues beforeconstruction of the new research infrastructure: legal,governance, strategic, financial and, if necessary,technical work should be directed towardsmaking it possible to go to construction phase directlyafter the preparatory phase. As EU opened afinancing call to support preparatory phases of theESFRI Roadmap projects, <strong>EISCAT</strong> decided to hireDr. Ian McCrea from Rutherford Appleton Laboratoryin part time, in order to coordinate writinga targeted funding application. A full time positionof a project assistant was also established andDr. Anders Tjulin started to work at <strong>EISCAT</strong> Headquartersin Kiruna in September 2009. The finalisingof a 6 Me funding application was conductedduring an intensive workshop with a small teamof international contributors, and the applicationwas sent to EU in December 2009.A dedicated first international <strong>EISCAT</strong>_3D UserMeeting was organised in Uppsala on 27–29 May2009, hosted by the Swedish Institute of SpacePhysics, Uppsala, in the premises of the ÅngströmLaboratory. The purpose of the meeting wastwofold: first, to offer opportunity to <strong>EISCAT</strong>users to show their plans and needs for measurementsin their science fields, second, to publishthe results of the <strong>EISCAT</strong>_3D Design Study tothe wide user community. The results of the DesignStudy were formally handed over to <strong>EISCAT</strong>in the meeting by the partner consortium representative,the technical coordinator of the study:Dr. Gudmund Wannberg from Swedish Instituteof Space Physics in Kiruna. Final reports of theStudy were submitted to EU afterwards and thesereports are available to anyone via the <strong>EISCAT</strong>and <strong>EISCAT</strong>_3D web pages. Dr. Wannbergs earlierwork for the <strong>EISCAT</strong> radars in general aswell as the recent work for the <strong>EISCAT</strong>_3D DesignStudy were given a recognition in the 73rd<strong>EISCAT</strong> Council meeting in Lillehammer on 27–28 November 2009, when he was awarded withthe 7th Beynon medal.In spring 2009 we restarted discussion with thefrequency authorities of all <strong>EISCAT</strong> Host Countries,Norway, Sweden and Finland. Our main discussionwas of course in order to ensure future operationsof <strong>EISCAT</strong>_3D, but also current facilitieswere discussed, specially because timing the possibleending of current frequency licenses shouldmatch opportunity to use the new <strong>EISCAT</strong>_3D frequency.Norway is currently offering the 229.9–236.6 MHz to <strong>EISCAT</strong>, as a response to the applicationsent out during the <strong>EISCAT</strong>_3D DesignStudy. We have replied this to be fine for us, butso far there is no confirmation from the authority.Finland shows support to protect the band inNorthern Finland for <strong>EISCAT</strong>, provided the location(s)of measurement site(s) are in areas wherethis would be possible. Sweden has future allocationto DAB (digital audio broadcast) development,but there are several authorities involvedin making decisions. Swedish Research Counciloffers to coordinate discussions with these authorities.The frequency allocation of <strong>EISCAT</strong>_3Dshould be solved as soon as possible, since this isone of the prerequisites before the technical realisationof the new generation radar can be broughtforward.A showcase of all the <strong>EISCAT</strong> science wasthe 14th <strong>EISCAT</strong> Workshop on 3–7 August 2009,in Tromsø, Norway. The number of participantswas this time slightly less than during previousworkshops, in total 85, but included avery international mix of participants from allover the world. Among more traditional ses-10
sions such as, space weather and solar windmagnetosphere-ionosphere-atmospherecoupling,high-latitude ionospheric response, mesosphereand thermosphere, meteors and space debris,ionospheric modification, and new techniques,also sessions on the future with <strong>EISCAT</strong>_3D anduse of the enhancing global ISR network were organised.During the latter, the workshop participantswere introduced a new conceptual need infuture geosciences: a more system-oriented approachand holistic view of the whole geospace environmentand Earth itself as a composite system,where one finally needs a more global approachboth to measurements and modelling efforts. Atthe <strong>EISCAT</strong> workshop in Tromsø, the user communityof <strong>EISCAT</strong> had a discussion on how to developfurther the access to <strong>EISCAT</strong> data archive.Parallel to the standard MADRIGAL database use,<strong>EISCAT</strong> had started in 2008 to introduce a new opportunity,based on dedicated extensive softwaredevelopment on a hardware platform consistingof six computers transferred to <strong>EISCAT</strong> Kirunasite from Rutherford Appleton Laboratory. A softwareconsultant had worked on this system for5.5 months to March 2009, in order to create amore elegant data access system, with extensivemetadata searches to access raw data, re-analysisof data collected by these metadata searches etc.As <strong>EISCAT</strong> itself did not allocate more resourcesto the combined software/hardware platform development,the next step was agreed to be taken bythe user community, by applying and developingthe system to fulfil needs of their selected sciencecases. It remains to be seen if such an alternativeresource via user engagement is enough to bringthe system to be a standard user level tool.The next <strong>EISCAT</strong> International Workshop in2011 will be held in China. China has made anambitious project proposal to <strong>EISCAT</strong>, as a possiblein-kind contribution to <strong>EISCAT</strong> in the form ofa third antenna on Svalbard. Originally the EIS-CAT Svalbard radar was proposed optimally tohave three antennas. Finally one was built andonly later another one was added as the Japanesein-kind contribution. Initial technical descriptionof the proposed third antenna is now given bythe Chinese associate CRIRP. This is similar to the50 m antenna of the Chang’e Moon project in Beijing,and indeed the idea proposed is to use theantenna for multiple purposes, including ISR andSpace Debris measurements and communicationwith the Chinese Moon projects, using both a separatetransmitter at S band and the existing ESRtransmitter at 500 MHz. The Science OversightCommittee of <strong>EISCAT</strong>, SOC, finalised a documenton the science case of the third antenna; SOC recommendsthis addition to ESR. Several delegationsfrom China visited Tromsø and Longyearbyenin order to discuss and map the case of thethird antenna. Also initial discussions were madewith a consultant who could serve in casting theproject into an action, including possible feasibilitystudy and communication with local authoritieson construction and operation permissions.The next phase would be to make a decision ontaking such initial steps towards the realisation ofthe third antenna.Another possible development on Svalbard appearedduring the Svalbard Science Forum, whereinternational research institutes who are active inSvalbard area, gathered to discuss on coordinativeactions. In fact <strong>EISCAT</strong> proposed to start collaborativework towards a similar effort as was doneduring the last International Polar Year in 2007–2008, a coordinated continuous measurement period,at least one year long, during the next solarmaximum. This would be possibly around 2013.Such an operation with ESR is a major undertaking,and demands extra funding. The IPY operationswith <strong>EISCAT</strong> were done using extreme effortby <strong>EISCAT</strong> staff, also helped by others. As learnedfrom that experience, dedicated extra engineeringstaff would be needed to be hired at the requiredlevel. Without funding coming outside of the EIS-CAT standard budget, the continuous solar maximumoperation will not be possible.Although some minor reduction in resourcesavailable to <strong>EISCAT</strong> in the nearest future may happen,I still think the current view towards future ismuch enlightened. We have the <strong>EISCAT</strong>_3D concept,which is having a political backing in Europe,and is certainly also of global science interest. Withcoordinated science-led development, both withinand beyond the <strong>EISCAT</strong> community, and appliedboth in Svalbard, where the SIOS ESFRI projectand the Chinese third antenna proposal may developfurther the traditional strengths in orderto address new science, as well as on mainland,where the Heater upgrade should bring in newdevelopments in small-scale physics, and novelapplications, such as planetary radar and spacedebris measurement capability, enhanced data accessand finally the <strong>EISCAT</strong>_3D ESFRI project, allshould develop new techniques to add new science.With this view in mind, I would like to thankthe <strong>EISCAT</strong> staff for their excellent work in 2009.Dr. Esa TurunenDirector, <strong>EISCAT</strong> Scientific Association11
The <strong>EISCAT</strong>_3D Design StudyIn 2009 the four-year <strong>EISCAT</strong>_3D Design Studywas completed. This project was supported bythe Sixth Framework Programme of the EuropeanUnion and was running from 1 May 2005 to30 April 2009.The aims of the Design Study were essentiallytwofold:• To study the feasibility of constructing a thirdgeneration<strong>incoherent</strong> <strong>scatter</strong> research radar,using cutting-edge technology throughoutand providing an order-of-magnitude improvementin temporal and spatial resolutionso that the existing, aging, <strong>EISCAT</strong> VHF andUHF systems, could be replaced.• To produce a detailed costed design for sucha system.The Design Study did not include a task todevelop the science case; this was carried outas a parallel activity by <strong>EISCAT</strong>’s Science AdvisoryCommittee (SAC), later renamed as the ScienceOversight Committee (SOC) from 1 January2007. Members of the Design Study maintainedclose links with the science case development, andmany of the ideas from SAC fed into the preparationof the <strong>EISCAT</strong>_3D Performance SpecificationDocument (PSD).Following extensive consultation with the <strong>scientific</strong>user community in 2004 and 2005, it wasdetermined that only a multi-static phased arraysystem could reach or approach the performancedemanded by present users and expected from futureusers.Accordingly, the target system specified in the<strong>EISCAT</strong>_3D Performance Specification Document(PSD) comprises a central active (transmit-receive)site (the “core”) and four receive-only sites, locatedon two approximately 250 km long baselinesoriented North-South and East-West, respectively.To achieve the desired performance, the proposedsystem design incorporates a number of innovativeground-breaking concepts such as• Direct-sampling receivers.• Digital time-delay beam-forming.• Multiple simultaneous beams from each receivingarray.• Adaptive polarisation matching and Faradayrotation compensation.• Digital arbitrary-waveform transmitter excitersystem.• Full interferometry and imaging capabilities.• Amplitude-domain data recording at fullsampling rate.During the four-year Design Study, all missioncriticaltechnical concepts were modelled, investigatedby simulations and in critical cases also byfull-scale tests, and found to be realisable. Arraysizes, transmitter power levels and receiver noiseperformance that would be required to reach thedesired time and space resolutions have also beenestablished. Based on this work, the target systemwas proposed to have the following technicalcharacteristics:The <strong>EISCAT</strong>_3D core should comprise a 120 mdiameter filled circular aperture array with about16,000 elements (see Fig. 1), laid out on an equilateraltriangular grid, and in addition a number (sixto nine) of smaller outlier receive-only arrays. Itwould then provide• Half-power beamwidth of about 0.75 ◦ whichis comparable to that of the present <strong>EISCAT</strong>UHF.• Power-aperture product exceeding100 GWm 2 which is an order of magnitudegreater than that of the present <strong>EISCAT</strong>VHF.• Grating-lobe free pattern out to 40 ◦ zenith angle.• Graceful degradation in case of single-pointequipment failure.12
Figure 1: Artist’s view of the <strong>EISCAT</strong>_3D core site as proposed in the Design Study.Each core array element shuold be made upfrom a radiator, a dual 2×300 W linear RF poweramplifier, a high performance direct-digitising receiverand support electronics. The recommendedradiator is a crossed Yagi antenna with a minimumdirectivity of about 7 dBi.Two filled 8000 element receive-only arraysshould be installed on each baseline at distancesof about 110 and 250 km from the core, respectively.Their radiating elements will be three- orfour-element X Yagis, essentially identical to thoseused in the core. The Yagis would be directed towardsthe core field-of-view and elevated to 45 ◦ .Outlier arrays for interferometry should also be installedat the receive-only sites.Advanced digital beam-forming systems wouldallow the generation of a large number of simultaneousbeams from each array, thus eliminating thetime/space ambiguity plaguing all present <strong>incoherent</strong><strong>scatter</strong> systems and realise the possibilitiesfor volumetric imaging of vector quantities for thefirst time.It was verified that a system meeting the performancerequirements put forth in the <strong>EISCAT</strong>_3DPerformance Specification Document could bebuilt today, using existing technology, if cost werenot an issue. Advances in semiconductor technology,signal processing and data storage betweennow and the time of placing a contract are expectedto reduce component and subsystem coststo the point where a full-size core would costabout 60 Me and each receive-only site 20 Me. Itis recommended that the member institutions ofthe <strong>EISCAT</strong> Scientific Association commit to fundingand constructing such a radar system accordingto the results and guidelines given in the technicalreports (<strong>EISCAT</strong>_3D Deliverables) within thenext five to seven years.As designed, the system would be highly modularand would lend itself excellently to gradualexpansion if funding should only be forthcomingin installments. In this case, it is recommendedthat in a first phase a 5000 element, 70 m diametercore array and at least two 1500 element receiversites should be constructed to replace themulti-static capabilities of the present UHF radar,which are going to be lost in 2010. This configurationwould already exceed the performance ofthe current VHF system, providing a 1.3 ◦ halfpowerbeamwidth, a power-aperture product ofabout 10 GWm 2 , and full beam steerability at thetransmitter site. There are also stages beyond theoutlined system involving multiple core elementsarrays that could then be expanded as additionalfunding became available or as part of a morecomprehensive initial build.The Design Study team notes with pleasure that,as a result of their efforts and the hard work of the<strong>EISCAT</strong> executives, <strong>EISCAT</strong>_3D was added to theEuropean Strategy for Research Infrastructure (ES-FRI) roadmap, at its last revision announced in December2008.13
Scientific highlights 2009Ionospheric studiesOn the source of the polar wind in thepolar topside ionosphere: First resultsfrom the <strong>EISCAT</strong> Svalbard radarIn this study, we present quantitative radar observationsof both hydrogen ion (H + ) and oxygenion (O + ) upflow in the topside polar ionosphere(Fig. 2) using measurements that were recentlycarried out with the <strong>EISCAT</strong> Svalbard Radar andthe Reimei satellite. H + upflow was clearly observedequatorward of the cusp above 500 kmaltitude. Within the cusp the H + density wasvery low, and the upflow was dominated by O +ions, but on closed field lines the H + became thelarger contributor to the upward flux above about550 km. The total flux seemed to be conserved,and so below 550 km altitude O + (with a small upwardvelocity of ∼50 m/s) appeared to determinethe upward flux which was then maintained byH + in the topside ionosphere. We also found thatthe H + density in the topside polar ionospherewas several times higher than current predictionsof ionospheric models like IRI2001.Y. Ogawa, et al., “On the source of the polar wind inthe polar topside ionosphere: First results from the EIS-CAT Svalbard radar”, Geophysical Research Letters 36,L24103, doi:10.1029/2009GL041501, 2009.Characteristics of polar patches in thenightside ionosphereThe characteristics of polar patches in the Europeannightside ionosphere have been investigated.These patches are the remnants of ionosphericplasma originating on the dayside and drawn antisunwardacross the polar region into the nightsideauroral region.A multi-instrument study using the ESR, theAberystwyth radio tomography experiment, andthe SuperDARN radars observed the modulationof patch separation during a magnetic substorm.Figure 2: Height profiles equatorward of the cuspof H + , O + , and total electron density (panel a), H +and O + upward velocities (panel b), and H + andO + upward number fluxes (panel c). In panel cthe thick dashed lines indicate constant flux extendedin height from the observed peaks for adipole magnetic field.During substorm expansion the patches were separatedby some 5 ◦ latitude but this was reducedto some 2 ◦ when activity had subsided. The differentpatch separations resulted from the expansionand contraction of the high-latitude plasmaconvection pattern on the nightside in response tothe substorm activity. The patches of larger separationoccurred in the anti-sunward cross-polarflow as it entered the nightside sector from the polarregion. Those of smaller separation were alsoin anti-sunward flow, but close to the equatorwardedge of the convection pattern, in the slower, divergingflow of the Harang discontinuity. A patchrepetition time of some 10 to 30 min was estimateddepending on the phase of the substorm.A second multi-instrument study investigatedthe influence of the season on the patchto-backgrounddensity ratio in the nightsideionosphere around solar maximum (1999–2001).Patch-to-background ratios of up to 9.4±2.9 wereobserved by the ESR between midwinter andequinox with values of up to 1.9±0.2 in summer.The patch-to-background ratios in summerwere less than two, so the enhancements couldnot formally be called patches, nevertheless theywere identified as significant density enhancementswithin the antisunward cross-polar flow.Modelling of the difference between winter andsummer patch-to-background ratios primarily at-14
tributed the variation to the chemical compositionof the atmosphere, which in summer both reducedthe electron densities of the plasma drawn into thepolar cap on the dayside and enhanced plasmaloss by recombination. A secondary factor was themaintenance of the background polar ionosphereby photo-ionisation in summer.A. G. Wood, S. E. Pryse, and J. Moen, “Modulation ofnightside polar patches by substorm activity”, AnnalesGeophysicae 27(10), 3923–3932, 2009.A. G. Wood, and S. E. Pryse, “Seasonal influence onpolar cap patches in the high-latitude nightside ionosphere”,Journal of Geophysical Research, in press,2010.The influence of ozone concentration onthe lower ionosphereA numerical model of D-region ion chemistry isused to study the influence of the ozone concentrationin the mesosphere on ion-composition andelectron density during solar proton events (SPE).We find a strong sensitivity in the lower part ofthe D-region, where negative ions play a majorrole in the ionisation balance. We have chosen thestrong SPE on 29–30 October 2003 when very intenseproton fluxes with a hard energetic spectrumwere observed. Deep penetration into the atmosphereby the proton fluxes and strong ionisationallows us to use measurements of electron density,made by the <strong>EISCAT</strong> 224 MHz radar, startingfrom as low as 55 km. We compare the electrondensity profiles with model results to determinewhich ozone concentration profiles are themost appropriate for mesospheric altitudes underSPE conditions (Fig. 3). We show that, duringdaytime, an ozone profile corresponding to depletionby a factor of 2 compared to minimum modelconcentrations for quiet conditions (Rodrigo et al.,1986), is needed to give model electron densityprofiles consistent with observations. Simple incorporationof minor neutral constituent profiles(NO, O and O 3 ) appropriate for SPE conditionsinto ion-chemistry models will allow more accuratemodeling of electron and ion densities duringsuch events, without the need to apply a completechemical model calculating all neutral species.A. Osepian, S. Kirkwood, and P. Dalin (2009), “The influenceof ozone concentration on the lower ionosphere— modelling and measurements during the 29-30 October2003 solar proton event”, Annales Geophysicae27(2), 577–589, 2009.Figure 3: Comparison of time series of the measuredvalues of cosmic noise absorption from theIRIS riometer at Kilpisjärvi (black curves) with absorptioncalculated on the basis of experimental(<strong>EISCAT</strong>) N e-profiles (red curves). The solid linesare on 29 October 2003, the dashed lines are on30 October 2003. Absorption is given for a frequencyof 30 MHz.Particle precipitation during NEIALevents: simultaneous ground basednighttime observations at SvalbardIn this investigation it was discovered for the firsttime that Natural Enhanced Ion Acoustic Lines(NEIALs) may occur during night time at high latitudesover Svalbard. The geophysical settings indicatethat the NEIAL events in this case studyare associated with the substorm expansion phaseon the nightside. We have also found that thegreen line may exceed the red line intensity duringNEIAL events, causing enhancement in the upshiftedshoulder in the <strong>incoherent</strong> <strong>scatter</strong> spectra.This shows that both soft and hard precipitation isessential for the generation of NEIALs; the harderprecipitation being important for the enhancementin the up-shifted ion-acoustic line. We also findthat the enhancement of the down-shifted shoulderis not strictly related to the previously foundthreshold of about 10 kR for the 630.0 nm line intensities.There seems to be a possible link betweenthe NEIAL events and the 844.6 nm lineemission intensity which probably makes this linea more suitable indicator of NEIAL activity thanthe 630.0 nm emission line. Both the 630.0 nm15
Figure 4: The optical emissions arriving from thefield aligned direction coinciding with the radarbeam. NEIAL events are marked with black arrows(and a black diamond), while the notation a,b, c and d marks emission peaks during which noNEIAL events were observed.and 844.6 nm are emitted by atomic oxygen (OI),excited by low energy precipitation, but the latterresults from a prompt emission, and shows abetter correlation with NEIALs on the short timescales involved which makes this line a good candidateas an optical signature of NEIALs. Figure 4shows the optical emissions arriving from the fieldaligned direction coinciding with the radar beam.NEIAL events are marked with black arrows (anda black diamond), while the notation a, b, c and dmarks emission peaks during which no NEIALevents were observed. The enclosed frame illustratesa case when the green line intensity exceedsthe red line. Figure 5 shows the NEIAL event withan enhanced right shoulder at the time when thegreen emission line exceeded the red line.J. Lunde, U. P. Løvhaug, and B. Gustavsson, “Particleprecipitation during NEIAL events: simultaneousground based nighttime observations at Svalbard”, AnnalesGeophysicae 27(5), 2001–2010, 2009.Omega band electrodynamicsThe study by Vanhamäki et al. (2009) presents acase study of omega band electrodynamics. Thisstudy evaluates the performance of the new regionalvariant of the traditional KRM-method developedby Vanhamäki and Amm (1997). Theregional approach uses equivalent current dataand conductance values as input and yields estimatesof ionospheric electric field and currentsas outputs. The contribution from <strong>EISCAT</strong> comesvia conductance estimates: From auroral intensitiesand riometer data the Hall and PedersenFigure 5: The NEIAL event with an enhanced rightshoulder at the time when the green emission lineexceeded the red line (the enclosed frame in Fig. 4).conductances are derived with a semi-empiricalmodel whose development <strong>EISCAT</strong> observationshave supported (Senior et al., 2008). Vanhamäkiet al. (2009) show that the electric field maps deducedwith the regional KRM method are in generalconsistent with CUTLASS electric field measurements.The spatial distribution of most intenseJoule heating regions in the omega bandstructure is also investigated and the heating isfound to be higher in the dark region than in theauroral tongue (Fig. 6). However, the two auroraltongues analysed in the study have differencesin this respect: the heating rates associated withthe first auroral tongue are larger than those of thesecond tongue and of the dark region between thetongues. On the other hand, the first tongue occurredin connection with pseudo-breakup auroras,so its higher Joule heating rates are not surprising.The lesson to learn from this study is thatthe spatial distribution of Joule heating in omegabandscannot be deduced on the basis of opticaldata alone.A. Senior, M. J. Kosch, and F. Honary, “Comparisonof methods to determine auroral ionospheric conductancesusing ground-based optical and riometer data”,Annales Geophysicae 26(12), 3831–3840, 2008.H. Vanhamäki, and O. Amm, “A new method to estimateionospheric electric fields and currents using datafrom a local ground magnetometer network”, AnnalesGeophysicae 25(5), 1141–1156, 2007.H. Vanhamäki, et al., “Electrodynamics of an omegabandas deduced from optical and magnetometer data”,Annales Geophysicae 27(9), 3367–3385, 2009.16
Figure 7: Dayside ion upflow occurrence and ionflux plotted over solar wind (SW) parameters:(a, b) SW density and (c, d) SW velocity. In panelsb and d the black lines indicate average fluxesin upflow events, while gray lines indicate averagefluxes of all data (upflow, downflow, and no-flowevents).Figure 6: The Pedersen conductance, electric field(vector field and intensity), and Joule heating ratein the vicinity of an omega band structure. The auroraltongue is located in the region of enhancedPedersen conductances and only a part of the largeomega structure is visible.Characteristics of ion upflow and downflowobserved with the European IncoherentScatter Svalbard radarIn this study, we investigated how geomagneticactivity, the solar wind (SW), and the interplanetarymagnetic field (IMF) influence the occurrenceof the F-region/topside ionospheric ion upflowand downflow. Occurrence of dayside ion upflowobserved with ESR at 75.2 ◦ magnetic latitude ishighly correlated with the SW density (Fig. 7), aswell as with the strength of the IMF B y component.We suggest that this correlation exists be-cause the region where ion upflow occurs is enlargedowing to SW density and IMF B y magnitude,but it does not move significantly in geomagneticlatitude. The occurrence frequency ofdayside ion upflow displays peaks versus the geomagneticactivity index (K p ), SW velocity, andnegative IMF B z component; that is, ion upflowis less frequently seen at the highest values ofthese parameters. Dayside ion downflow in the F-region/topside ionosphere occurs only when theK p index and/or SW velocity are high or whenIMF B z is largely negative. The results suggestthat the region of ion upflow not only becomeslarger but also moves equatorward with increasingK p , SW velocity, and negative IMF B z . TheESR can so be poleward of the upflow region andobserve ions convecting poleward and returningballistically downward.Y. Ogawa, et al., “Characteristics of ion upflow anddownflow observed with the European Incoherent ScatterSvalbard radar”, Journal of Geophysical Research114, A05305, doi:10.1029/2008JA013817, 2009.Statistics of Joule heating, electric fieldsand conductancesProperties of the Joule heating rate, electric fieldsand conductances in the high latitude ionosphere17
Figure 8: Median curves of Pedersen conductance(top panel), total electric field (middle panel) andJoule heating rate (bottom panel) for K ≥ 3.are studied by Aikio and Selkälä (2009). Theresults are based on a one-month measurementmade by the <strong>EISCAT</strong> <strong>incoherent</strong> <strong>scatter</strong> radar inTromsø (66.6 cgmlat) from 6 March to 6 April,2006. The data are thus from the same season(close to vernal equinox) and from similar sunspotconditions (about 1.5 years before the sunspotminimum) providing an excellent set of data tostudy the magnetic local time (MLT) and theK p magnetic activity index dependence of ionosphericparameters with high spatial and temporalresolution.The results indicate that the response of morningsector conductances and conductance ratios toincreased magnetic activity is stronger than thatof the evening sector. The co-location of Pedersenconductance maximum and electric field maximumin the morning sector produces the largestJoule heating rates 00–05 MLT for K ≥ 3 (Fig. 8).In the evening sector, a smaller maximum occursat 18 MLT, mainly due to an intense electric field.Minimum Joule heating rates in the nightside arestatistically observed at 23 MLT, which is the locationof the electric Harang discontinuity.Fits for the Joule heating rate as a function ofelectric field magnitude, separately for four MLTsectors and two activity levels (K p < 3 and K ≥ 3)are also performed. In addition to the squaredelectric field, the fit includes a linear term to studythe possible anticorrelation or correlation betweenelectric field and conductance. In the midday sector,positive correlation is found, as well as in themorning sector, for the high activity case. In themidnight and evening sectors, anticorrelation betweenelectric field and conductance is obtained,Figure 9: Effective conductance as a function ofelectric field in the midnight sector for K p < 3(blue) and K p ≥ 3 (red).i.e. intense electric fields are associated with lowconductances (Fig. 9). This is expected to occur inthe return current regions adjacent to auroral arcsas a result of ionosphere-magnetosphere coupling.In addition, a part of the anticorrelation may comefrom polarisation effects inside high-conductanceregions, e.g. auroral arcs. These observations emphasisethe importance of small-scale electrodynamics,which is not included in most of the globalmodels of Joule heating rate.A. T. Aikio, and A. Selkälä, “Statistical properties ofJoule heating rate, electric field and conductances athigh latitudes”, Annales Geophysicae 27(7), 2661—2673,2009.Studies in the D-regionD-region electron density and effectiverecombination coefficients during twilightand solar proton eventsAccurate measurements of electron density in thelower D-region (below 70 km altitude) are rarelymade. This applies both with regard to measurementsby ground-based facilities and by soundingrockets, and during both quiet conditions and conditionsof energetic electron precipitation. Deeppenetration into the atmosphere of high-energysolar proton fluxes (during solar proton events,SPE) produces extra ionisation in the whole D-region, including the lower altitudes, which givesfavourable conditions for accurate measurementsusing ground-based facilities. In this study we18
show that electron densities measured with twoground-based facilities at almost the same latitudebut slightly different longitudes, provide a valuabletool for validation of model computations.The two techniques used are <strong>incoherent</strong> <strong>scatter</strong> ofradio waves (by the <strong>EISCAT</strong> 224 MHz radar inTromsø, Norway, 69.6 ◦ N, 19.3 ◦ E), and partial reflectionof radio-waves (by the 2.8 MHz radar nearMurmansk, Russia, 69.0 ◦ N, 35.7 ◦ E). Both radarsgive accurate electron density values during SPE,from heights 57–60 km and upward with the EIS-CAT radar (Fig. 10) and between 55–70 km withthe partial reflection technique. Near noon, thereis little difference in the solar zenith angle betweenthe two locations and both methods give approximatelythe same values of electron density at theoverlapping heights. During twilight, when thedifference in solar zenith angles increases, electrondensity values diverge. When both radars arein night conditions (solar zenith angle >99 ◦ ) electrondensities at the overlapping altitudes againbecome equal. We use the joint measurements tovalidate model computations of the ionosphericparameters f + , λ, α eff and their variations duringsolar proton events. These parameters are importantcharacteristics of the lower ionosphere structurewhich cannot be determined by other methods.A. Osepian, et al., “D-region electron density and effectiverecombination coefficients during twilight —experimental data and modelling during solar protonevents”, Annales Geophysicae 27(10), 3713–3724, 2009.Dynamics of the precipitation regionscausing auroral radio absorptionThe analysis of D-region observations by the VHFradar in March 2008 investigated the dynamicsof the precipitation regions causing auroral radioabsorption. The motions were monitored by theimaging riometer at Kilpisjärvi. From the EIS-CAT data the height of the absorbing layer wasdetermined, and hence the energy of the precipitatingelectrons causing the absorption. Thegradient-curvature drift of electrons of these energieswould be much greater than the speeds observed.Magnetospheric circulation, as inferredfrom SuperDARN, is a more promising mechanism,though as yet unproven.Figure 10: Electron density profiles measured by<strong>EISCAT</strong> radar (red curve) and calculated for theSPE on 30 October 2003 at 09:00 UT for zenith angle86.7 ◦ (black curve) using different models of O,O 3 and NO profiles (black and red dashed curves).Auroral studiesSmall-scale auroras: Flickering andblack aurorasA study of two flickering auroral events usingthe ASK (Auroral Structure and Kinetics) multispectralimaging system in combination with theUHF radar has led to improved understanding ofthe mechanism responsible for flickering aurora(Fig. 11). Several ‘chirps’ were identified withinthe events, in which the frequency of flickering ascendedor descended over a short period of time(∼1–2 s). By observing different optical emissionlines it was found that the energy of precipitationis inversely proportional to the flickering frequencyover the duration of each chirp. This ispredicted by the theory that flickering aurora isa result of the Landau damping interaction betweenelectrons and electromagnetic ion cyclotron(EMIC) waves, and that the wave speed is the primaryfactor determining the electron energy gain.The ASK imager has also been used in conjunctionwith the UHF radar to study the dynamicsand energy characteristics of so-called ‘black aurora’.The flux reduction of high energy particlesversus low energy particles in the black regionscompared to the diffuse background havebeen investigated for different forms of black aurora.Two separate mechanisms have been suggestedto cause black aurora. The larger reductionof high energy precipitation within the fine scale19
Figure 11: UHF radar high resolution data. Theflickering aurora occurred between 18:16:30 and18:17:30 UT and corresponds to higher energy particleprecipitation causing ionisation to lower altitudes.black structures favours a magnetospheric mechanismthat blocks high energy electrons from being<strong>scatter</strong>ed into the loss cone.D. K. Whiter, et al., “Using multi-spectral optical observationsto discriminate between possible accelerationmechanisms for flickering aurora”, Journal of GeophysicalResearch, submitted, 2010.J. Archer, et al., “Dynamics and characteristics of blackaurora as observed by high resolution ground-based imagersand radar”, International Journal of Remote Sensing,submitted, 2010.Electric field enhancement in an auroralarcThe character of a change in the ionospheric electricfield when several auroral arcs crossed the regionof radar measurements has been analysed(Fig. 12). In one case the plasma conductivityand electric field normal component in an arcincreased as compared to their undisturbed values.In another case the field and conductivitychanged traditionally (in antiphase). Arcs with anincreased field were previously classified as correlatingarcs, but their existence was subsequentlyopen to question during optical observations. Theusage of the ALIS system of digital cameras madeit possible to decrease the errors introduced by opticalequipment. The measurements in the vicinityof correlating arcs were performed when thesearcs were generated, and a traditional arc was acompleted formation. In an originating arc, thefield value can depend not only on the ionosphericplasma conductivity but also on the processes inthe magnetospheric-ionospheric system resultingin the field enhancement.V. V. Safargaleev, et al., “Electric field enhancement inan auroral arc according to the simultaneous radar (EIS-Figure 12: Optical and radar measurements in thevicinity of the correlating arc.CAT) and optical (ALIS) observations”, Geomagnetismand Aeronomy 49(3), 353–367, 2009.Relations between proton auroras, intenseelectric field and ionospheric electrondensity depletionA case study with simultaneous European IncoherentScatter and optical auroral observationswas conducted in order to determine characteristicsof the magnetosphere-ionosphere couplingfrom the viewpoint of the electrodynamics in theionosphere. Particular focus was on the relationshipsbetween ionospheric electron density depletion,perpendicular electric fields, and proton auroras.Intense electron density depletion was observedin the E and F regions poleward and in thevicinity of a thin equatorward moving arc (Fig. 13).This depletion was associated with an intense,equatorward perpendicular electric field close to∼80 mV/m and most likely with a downwardfield-aligned current (FAC), but it did not accompanydetectable proton aurora. Hence the down-20
A09304FUJII ET AL.: ELECTRODYNAMICS IN THE IONOSPHEREA09304ward FA electric field in the lower magnetosphereassociated with this depletion was weak or absent.The motion of the FAC system with the depletionand the arc presumably enabled the downwardFAC to obtain enough current carriers as ionosphericelectrons were lost by the evacuation process.The evacuation process associated with thedownward FAC was, however, efficient enoughto establish the depletion. On the other hand, awidely distributed proton aurora observed immediatelyafter the depletion was associated with anintense, equatorward perpendicular electric fieldclose to 90 mV/m, enhanced electron density, andmost likely a downward FAC. No electron precipitationwas associated with this proton aurora.Thus the electron density enhancement, providingthe downward current carriers, had to be causedby the ionization of precipitating protons presumablyaccelerated by downward field-aligned electricfields in the lower magnetosphere.R. Fujii, et al., “Relations between proton auroras, intenseelectric field and ionospheric electron density depletion”,Journal of Geophysical Research 114, A09304,doi:10.1029/2009JA014319, 2009.Studies of the cusprespectively.Ion heating in high-speed flow channelwithin the duskside cell of the polar-capion convection under large IMF-B y conditionF region strong sunward ion flow embedded in theduskside cell of expanding polar cap ion convectionand coincidental increase in the ion temperaturewere observed using the European IncoherentScatter (<strong>EISCAT</strong>) radars at Tromsø, Sodankyläand Longyearbyen together with the CUTLASSHF radars. The convection map obtained by theSuperDARN HF radars showed that the highspeedflow channel elongated in 14–17 MLT wasmoving equatorward. The increase of the measuredion temperature at the common <strong>scatter</strong>ingvolume of the <strong>EISCAT</strong> radars was in good agreementwith the ion frictional heating estimated underthe assumption of the null neutral wind velocityfor about 20 min, and then it became muchlower than the estimate of the ion frictional heating.While the flow channel moved equatorward,the ion temperature increase became less evidentat higher part of latitudes within the flow channel,which means that ion frictional heating wasFigure 1. A summary plot of the time variations of several parameters between 2020 and 2220 UT on20 OctoberFigure 2006. From13: the top A summary to bottom, (a) H b plot emissions of the fromtime the proton variations aurora imager, of (b) electronauroral emissions at 427.8 and 557.7 nm from the photometer, (c) the height profile of the electrondensity along several the magnetic parameters field line, (d) thebetween ion, and (e) electron 2020temperatures and 2220 from European UT onIncoherentScatter. The event for the present study is an event around 2130 UT.20 October 2006. From the top to bottom, (a) Hβemissions from the proton aurora imager, (b) electronauroral emissions at 427.8 and 557.7 nm fromthe photometer, (c) the height profile of the electrondensity along the magnetic field line, (d) theion and (e) electron temperatures from the <strong>EISCAT</strong>radar. The interest for the present study is an eventsite (69.6°N, 19.2°E, 66.1° invariant latitude). The <strong>EISCAT</strong>data used were obtained from an experiment in the CommonProgramme One mode [Collis, 1995] where thetransmitter beam is emitted along the magnetic field lineof force. The half-power beam width of the UHF radar beamwas 0.6°. The physical parameters directly measured werethe electron density, electron/ion temperatures and the lineof sight ion drift velocity. The integration time of the<strong>EISCAT</strong> data was selected to get enough S/N ratio; 60 sin the present case. The around uncertainties 2130 of the UT. electron densityand electron/ion temperature were about 10% and 14%,[11] The proton aurora imager consisted of a digital CCDcamera and a fisheye lens with an H b interference filter witha central wavelength at 485.7 nm and a full width at halfmaximum of 2 nm. The image data were recorded every60 s with 50 s integration time. The panchromatic digitalcamera to monitor electron auroras was equipped with afisheye lens and the image data were taken every 30 s withan exposure time of 15 s. The location of each pixel of theimage was obtained by using a star fit, assuming 120 kmaltitude for the emissions. The four wavelength photometerhad a field of view of 1.2°, which was comparable to thewidth of the <strong>EISCAT</strong> UHF radar beam. The photometer iscoaligned to the radar beam.4. Observation and Results[12] Figure 1 shows a summary plot of the time variationsof several parameters between 2020 and 2220 UT on20 October 2006 from top to bottom. Figure 1a shows Hbemissions from the proton aurora imager, Figure 1b showselectron auroral emissions at 427.8 and 557.7 nm from thephotometer, Figure 1c shows altitude profile of the electrondensity along the magnetic field line, Figure 1d shows ion,and Figure 1e electron temperatures measured with the<strong>EISCAT</strong> radar.[13] One of the enhancements of the Hb emissions is seenbetween 2025 and 2120 UT (with two peaks) and anotherone is seen between 2125 and 2142 UT in Figure 1a. Thedepressed where the neutral gases had already respondedto the high-speed ions. The increase inthe ion temperature at particular geomagnetic latitudecontinued until the neutral wind was accel-3of12erated to the equivalent level of the surroundedion flow (Fig. 14).S. Maeda, et al., “Ion heating in high-speed flow channelwithin the duskside cell of the polar-cap ion convectionunder large IMF-B y condition”, Journal of GeophysicalResearch 114, A11307, doi:10.1029/2009JA014300, 2009.Cusp observations during a series of fastreversals of the interplanetary magneticfieldA comparative study of the cusp was performed,focusing on an interval in which the IMF B zcomponent underwent four reversals, remainingfor around 30 minutes in each orientation. TheCluster spacecraft were on an outbound trajectorythrough the northern hemisphere magnetosphere,whilst the VHF and ESR were operating. The seriesof IMF reversals resulted in a sequence of pole-21
Figure 14: Plots of the line-of-sight ion velocity (left) and temperature (right) as a function of geomagneticlatitude and UT. The TRO data in the latitudes lower than the common <strong>scatter</strong>ing volume (70.5 ◦ –71.0 ◦ ) iscombined with the ESR data in the latitudes higher than the volume. The positive value of the ion velocityrepresents velocity away from the Tromsø radar and towards the ESR. The enhancements of the line-of-sightion velocity and temperature appeared in the highest latitudes at 13:30 UT and propagated to the lowerlatitudes. The increase of the line-of-sight ion temperature at particular geomagnetic latitude started almostsimultaneously with the enhancements of the line-of-sight ion velocity. It continued for about 20 min andthen ceased before the end of the ion velocity enhancement.ward and equatorward motions of the cusp. ConsequentlyCluster crossed the high-altitude cusptwice before finally exiting the dayside magnetopause,both times under conditions of northwardIMF B z . The first magnetospheric cusp encounter,by all four Cluster spacecraft, showed reverseion dispersion typical of lobe reconnection.Subsequently, Cluster spacecraft 1 and 3 crossedthe cusp for a second time. During this secondcusp crossing, these two spacecraft were likely tohave been on newly closed field lines, which werefirst reconnected (opened) at low latitudes andlater reconnected again (re-closed) poleward of thenorthern cusp.H. T. Cai, et al., “Cusp observations during a seriesof fast IMF B z reversals”, Annales Geophysicae 27(7),2721–2737, 2009.Moving meso-scale plasma precipitationin the cuspOn 28 March 2001, when the interplanetary magneticfield was strongly duskward, the DMSP F12spacecraft observed an ion precipitation burst ina latitudinally narrow region near 1200 MLT. Afew minutes earlier, the Low Energy Neutral Atom(LENA) imager on the IMAGE spacecraft, whosefield of view (FOV) looks into the high-altitudecusp, detected an enhancement of energetic neutralatom signals, which are produced by the ioninjection. The LENA data suggest that the ion injectionmoved out of its FOV after approximately4 min. At this time, the ground-based magnetometersof the IMAGE chain in Svalbard, located westwardof LENA’s FOV, began to indicate perturbations.These perturbations immediately reached apeak and then ceased; the perturbations lasted 2–3 min. During this interval, there was an enhancedwestward flow over Svalbard, as observed by theSuperDARN radars. The <strong>EISCAT</strong> Svalbard radardetected an enhancement of electron density andtemperature that was concurrent with this flowenhancement, suggesting that a plasma precipitationburst accompanied with the flow. These observations,which cover a longitudinally extendingregion of the cusp, strongly suggest the existenceof moving mesoscale plasma precipitation(MMPP). The MMPP travels westward with a longitudinallyelongated form. Its leading and trailingedges should be created by the temporal effectof the cusp. The other edges, which lie along thestreamline, would originate in a spatially limitedregion along the open-closed line. The boundaryof the MMPP form is delineated by both the temporaland spatial structures of the cusp.S. Taguchi, et al., “Moving meso-scale plasma precipitationin the cusp”, Journal of Geophysical Research 114,A06211, doi:10.1029/2009JA014128, 2009.22
Studies of polar mesosphere summerechoesRadio Physics of PMSEUsing the small scale structure of electron densitycaused by charged dust particles, the followingrelation between the volume reflectivity andfrequency occurring Polar Mesosphere SummerEchoes (PMSE) was obtained(η = R 2 Θ −2 ∆Ne r e c 2 ) 21/2 L−1 =2πf 2 e − π2 ln 22 Θ −21/2 L−1 ,where ∆N e denotes the absolute step of electrondensity, r e the classical electron radius, Θ 1/2 onewayhalf-power half width, c the speed of lightand L the radar pulse width. Meanwhile, the statisticalresultη = 3.8 × 10 −5 × f −4.37was obtained.Also, by analysing the data obtained from ECT-02, one can find that the dusty plasma in polarsummer mesopause is weakly ionised and weaklycoupling. The stronger disturbance of the electrondensity corresponds to the stronger radar echoes.H. Li, et al., “One analysis on the rocket detection ofpolar mesosphere summer echoes”, Chinese Journal ofSpace Science 29(4), 397–401, 2009.H. Li, et al., “Study on the relation between the reflectivityand frequency in dusty plasma of polar summermesopause”, Plasma Science and Technology 11(3), 279–282, 2009.Frequency dependence of polar mesospheresummer echoesThe frequency dependence of polar mesospheresummer echoes (PMSE) has been observed usingsimultaneous and common volume measurements.Detailed observations using the EIS-CAT Svalbard radar (ESR, 500 MHz) and theSOUSY Svalbard radar (SSR, 53.5 MHz) locatednear Longyearbyen on Svalbard (78 ◦ N, 16 ◦ E)were presented by Li et al. (2009a,b). The campaignwas conducted during the polar summerin 2006 and the back<strong>scatter</strong>ed signal of the radarswere converted to absolute volume reflectivities(radar cross-section per unit volume) which is asystem-independent parameter. Figure 15 showsthe measured volume reflectivities obtained fromESR/SSR measurements during periods of theoccurrence of PMSE. From the experimentallyderived volume reflectivity ratios together withmodelled volume reflectivity profiles for turbulent<strong>scatter</strong> can be revealed that PMSE is indeed createdby turbulent <strong>scatter</strong> in the presence of largeSchmidt number (Li et al., 2009a). Further investigationshave been conducted and result in particlesize distributions inside the PMSE layers whichhas been recently published by Li et al. (2010).Q. Li, et al., “Frequency dependence of PMSE: Resultsfrom simultaneous and common volume measurementswith <strong>EISCAT</strong> radars”, in Proceedings containing extendedabstracts of twelfth workshop on technical and<strong>scientific</strong> aspects of MST radar, edited by W. Hocking,London, ON Canada, May 17–23, 2009a.Q. Li, et al., “Microphysical parameters of mesosphericice clouds derived from calibrated PMSE observationsat 53.5 MHz and 500 MHz”, in The 9th internationalworkshop on Layered Phenomena in the Mesopause Region,Stockholm, Sweden, July 12–15, 2009b.Q. Li, et al., “Microphysical parameters of mesosphericice clouds derived from calibrated observations of polarmesosphere summer echoes at Bragg wavelengthsof 2.8 m and 30 cm”, J. Geophys. Res. 115, D00I13,doi:10.1029/2009JD012271, 2010.The layered dust plasma structure ofPMSEThe rocket experimental data indicated that thelayered dusty plasma structure has a sharp boundaryin the summer polar mesopause. In order tocombine with the experimental results, traditionalhydrodynamic equations and charging equationis adopted to build physical models of the dustyplasma to study the physics process about thesharp boundary in the stratified structure. Thetheoretical analysis and numerical results showthat a charged dust cloud immersed in a plasmaunder the action of electric field and other force,could develop a long-time and steady structures,which can be used to explain the experimental observations,as is shown in Fig. 16.H. Li, et al., “Study on the sharp boundary of layereddust structure in the summer polar mesopause”, ChineseJournal of Polar Research 21(4), 272–278, 2009.23
Figure 15: Height-Time-Intensity plots of the radar echoes observed with the ESR at 500 MHz (upper panels)and SSR at 53.5 MHz (lower panels) on 18 June (left column) and 20 June 2006 (right column), respectively.White vertical lines in the upper panels indicate times where meteor echoes were removed.campaigns were supported by the Finland and IcelandCUTLASS HF radars. A number of importantnew results were obtained from these heatingcampaigns in 2009.Figure 16: The charged ice particle number densitydistribution profiles.Studies involving artificial ionosphericheatingHF heating campaigns by AARITwo extensive HF heating campaigns were heldby Arctic and Antarctic Research Institute in 2009.Russian <strong>EISCAT</strong>/Heating campaigns were carriedout from 3 to 12 March and from 29 October to6 November 2009. The experiments were carriedout in the day and early evening hours in a deepminimum of solar activity under quiet magneticconditions. Many hours of excellent data were obtainedfrom the <strong>EISCAT</strong> monostatic UHF radar,the spectrum analyzer for monitoring the SEE frequencyspectrum at Tromsø, and the bi-static HFradio <strong>scatter</strong> at St. Petersburg. Importantly bothHF pump-induced phenomena near the thirdelectron gyro harmonic frequency, 3f ce , using thefrequency stepping the HF heater frequency, wereanalysed in detail for a few days of March 2009.As an example, Fig. 17 illustrates the behaviourof the electron temperature T e and the back<strong>scatter</strong>edpower at different operational frequenciesfrom the CUTLASS Finland radar on 9 March 2009when the heater frequency was changed aroundthe third electron gyro harmonic frequency. Thethird electron gyro harmonic frequency 3f ce wasestimated as a frequency on which the disappearanceof the DM component in stimulated electromagneticemission (SEE) spectra occurs. Itwas found that artificial field-aligned irregularities(AFAIs) with a spatial scale across the magneticfield of 9 m, corresponding the CUTLASSoperational frequency of 17 MHz, are depressedat the third electron gyro harmonic in the lesserdegree than the AFAIs with larger scale of 13–15 m (CUTLASS operational frequency of 10 and13 MHz). The T e changes are not significant atthird electron gyro harmonic when the heater frequencyf H is below the critical frequency f oF2by 0.5–0.7 MHz. The strongest AFAIs were excitedabove the third electron gyro harmonic byfrom 20–30 to 50–70 kHz when the SEE spectraexhibit the generation of the nDM and BSS spectralcomponents. A distinctly different phenomenawere observed when the heater frequency wasnear the critical frequency, f H ≈ 3f ce ≈ f oF2 .24
Such situation was realised on 11 March 2009 duringheater-on period from 16:00–16:20 UT (f H ≈3f ce ≈ f UHR ≈ f oF2 ). Upper hybrid resonance altitudeof the pump wave was about 220–230 km.In this case extremely strong electron heating (upto 4500 K) and increases in the electron density upto 30–40% were observed. We expect that in thisevent the strong Langmuir turbulence was excitednear the reflection altitude leading the formationof cavities and acceleration of electrons. The combinedeffect of upper hybrid resonance and gyroresonance at the same altitude under f H ≈ f oF2gives rise to strong electron heating and excitationof striations, which at the magnetic zenith leadsto HF trapping and extension of HF waves to altitudeswhere they can excite Langmuir turbulence,leading to fluxes of electron accelerated to energiesthat produce the measurable ionisation.The generation of HF heater-induced ion upflowsfrom the ionosphere initiated by powerfulO-mode HF radio wave, injected towards themagnetic zenith, has been measured on 11 and12 March 2009. Note that the observed ion upflowswere weaker compared with the heaterinducedion upflows during solar activity maximum.Figure 18 illustrates data from the EIS-CAT UHF radar at Tromsø, showing effects of HFpumping on 11 March 2009. The UHF radar beampointed towards magnetic zenith. From 16:15 UTthe critical frequency f oF2 was near and then belowthe heater frequency f H =4040 kHz. It wasfound that the most intense ion upflows accompaniedby the strongest electron heating were observedwhen the HF pump frequency was near thecritical frequency of the F 2 layer. In the courseof experiment the DMSP F15 satellite was flyingabove Tromsø. The comparison between <strong>EISCAT</strong>UHF radar and DMSP satellite observations hasbeen made for heater-on period 15:20–15:40 UT on11 March 2009 (in collaboration with E. Mishin andC. Roth).Figure 19 shows variations in the vertical andhorizontal (westward) velocities and the ion densityalong with their trends obtained by averagingover 10 s sliding window. T MZ =15:26:15 UTis the time of the shortest distance, about 70 km,from the magnetic zenith of the heater. The ovalboundary is about 20 s from T MZ . F17 flew 5 ◦to the west and showed no signatures of heating.Clearly seen near MZ are the ion density enhancementand short-scale oscillations in both velocitycomponents.It is well know that artificial field-aligned irregularities(AFAIs) are excited near the reflectionFigure 17: Behaviour of electron temperature T efrom UHF radar and back<strong>scatter</strong>ed power at operationalfrequencies of about 9, 13, and 17 MHzfrom the CUTLASS Finland radar on 9 March2009 from 13 to 14:04 UT. The heater frequencywas changed by steps from 4040 to 4190 kHz.The heater frequency was very close to thethird electron gyro harmonic frequency at 13:12–13:14 UT. Heater-on periods at 13:36–13.38 and14:08–14.10 UT were aborted and cycles from 13:32,13:40 had a slow tune (more than 1 min).level of powerful HF radio wave with O-modeof polarization at the the upper-hybrid resonance(UHR) altitude. Theoretical work undertaken inthe 1970s indicated that the thermal parametric instability(Grach and Trakhtengerts, 1976) and resonanceinstability (Vas’kov and Gurevich, 1976)25
Figure 18: Data from the <strong>EISCAT</strong> UHF radar atTromsø, showing effects HF pumping on 11 March2009. The UHF radar beam pointed towards magneticzenith.plays an important role in the generation of suchirregularities. The generation of AFAIs is not possiblefor a powerful HF radio wave with X-modepolarisation. The reason is that such HF wave isreflected below from the UHR height and AFAIscan not be excited. During the October-November2009 campaign for the first time very strong AFAIswere detected with unusual features when HFpumping was produced at X-mode polarisationand the heater frequency f H significantly exceededf oF2 . A comparison between back<strong>scatter</strong>ed signalsobserved from CUTLASS radars and bi-staticHF radio <strong>scatter</strong> observations in St. Petersburg hasbeen made (in collaboration with T. Yeoman). Figures20 and 21 depict CUTLASS Hankasalmi radardata obtained on 5 and 6 November 2009.From Figs. 20 and 21 it can be seen that thechange of the HF pump wave polarisation fromO-mode to X-mode leads to the appearance ofstrong back<strong>scatter</strong>ed signals. HF pumping wasproduced at frequency of 4040 kHz. The criticalfrequency of ordinary mode from ionosonde datawas about 3.2 MHz. It is important to note thatstrong back<strong>scatter</strong>ed signals under X-mode polarisationof HF pump wave appeared when f H wascomparable with f xF2 . The signals <strong>scatter</strong>ed fromFigure 19: Variations in the vertical and horizontal(westward) velocities and the ion density alongwith their trends obtained at the DMSP F15 satelliteon 11 March 2009. Insets show the detrendedvalues. The shortest distance, about 70 km, fromthe magnetic zenith of the heater was observed atT MZ=15:26:15 UT.Figure 20: Back<strong>scatter</strong>ed power from CUTLASSHankasalmi radar at operational frequency ofabout 10 MHz in the 18 range gate (top panel) andin range gates from 13 to 23 (bottom panel) on5 November 2009.heater-induced irregularities did not disappear afterthe heater was turned off. In addition, the temporaldecay of heater-induced irregularities, seenin CUTLASS beam 5 back<strong>scatter</strong>, is unusually long26
Figure 22: The PMWE layer used in the analysis.Figure 21: Back<strong>scatter</strong>ed power from CUTLASSHankasalmi radar at operational frequency ofabout 10 MHz in the 18 range gate (top panel) andin range gates from 13 to 23 (bottom panel) on 6November 2009.and ranges up to 30 minutes. In the course of experimentsthe UHF radar was running at Tromsø.Data from the UHF radar showed some increasein electron temperatures in the comparison withO-mode heating at frequencies far above the f oF2 .The physical justification of the observed new phenomenonis not well-understood at present. Thereis a need to continue studies in this area by using avariety of techniques and methods to provide theformulation of a clear theoretical picture of highpower HF ionospheric interactions.N. F. Blagoveshchenskaya, et al., “Phenomena inducedby powerful HF pumping towards magnetic zenith witha frequency near the F-region critical frequency and thethird electron gyro harmonic frequency”, Annales Geophysicae27(1), 131–145, 2009.N. F. Blagoveshchenskaya, et al., “SPEAR-induced fieldalignedirregularities observed from bi-static HF radio<strong>scatter</strong>ing in the polar ionosphere”, Journal of Atmosphericand Solar-Terrestrial Physics 71(1), 11–20, 2009.T. D. Borisova, et al., “Peculiarities of stimulated electromagneticemission under action of higher-power HFradiowaves, emitted by the SPEAR facility, on the sporadicE layer of the polar ionosphere”, Geomagnetismand Aeronomy 49(5), 653–663, 2009. ERRATA: Geomagnetismand Aeronomy, 49(6), 822, 2009.T. D. Borisova, et al., “Splitting of the Doppler frequencyshift of bi-static back<strong>scatter</strong> signals during the Sura experiments”,Geomagnetism and Aeronomy 49(4), 510–518, 2009.A. V. Zalizovski, et al., “Self-<strong>scatter</strong>ing of a powerfulHF radio wave on stimulated ionospheric turbulence”,Radio Science 44, RS3010, doi:10.1029/2008RS004111,2009.Artificial modification of polar mesosphericwinter echoes with the <strong>EISCAT</strong>Heater and the role of charged dust particlesAn investigation of polar mesosphere winterechoes (PMWE) has been carried out withthe mesosphere-stratosphere-troposphere MobileRocket and Radar Observatory (MST MORRO)radar operating at 56 MHz. MORRO has been deployedat the European Incoherent Scatter (EIS-CAT) installation near Tromsø in northern Norway,co-located with the <strong>EISCAT</strong>’s VHF and UHFradars and RF heating facility. The main object ofthe investigation is to examine whether, and if so,how, RF heating influences PMWE. In particular,an experimental confirmation of the overshoot effectwould indicate the presence of charged dustparticles. On 11 February 2008 we measured severalweak and variable PMWE layers and we usedthe RF heater with an on period of 20 s and offperiod of 100 s to modulate the radar <strong>scatter</strong> fromthe layers. We chose one layer, which for 44 minwas the strongest and most stable layer, for furtheranalysis; see Fig. 22 where the layer in question isframed.The signal intensity variation during an averagedon/off heater period shows the expectedweakening of the signal intensity when heating isturned on, followed by a significant small recoveryof the signal during the on phase and a correspondingsmall overshoot of the signal strengthof about 13—15% over the background level whenheating is switched off, see Fig. 23. The recoveryand overshoot are attributable to charge accumulationon the dust particles due to electron heating.The overshoot characteristic curve shows thata considerable increase in the electron temperature27
Figure 24: Spectra with electric field.Figure 23: Characteristics of the signal strengthduring an on/off heater period.did take place during heating and that chargeddust particles should be present, probably with aradii of some nanometers.C. La Hoz and O. Havnes, “Artificial modificationof polar mesospheric winter echoes with an RFheater: Do charged dust particles play an activerole?”, Journal of Geophysical Research 113, D19205,doi:10.1029/2008JD010460, 2008.Polar ionospheric heatingBy analysing ISR observation data, the heating effectsin polar winter ionospheric modification experimentscarried out in January 2008 at Tromsø,Norway, were studied. A clear disturbance effectis present under the O-mode over-dense heatingconditions. The enhancement of the electrontemperature is up to 60%–120%, extending from150 km to 400 km. The disturbance of the electrondensity is not obvious, with a 12% maximumdecrease. A 1–2 kHz increase in the acoustic frequencycan be observed, an enhancement in thepeak-to-valley ratio of the ion line and sometimesits high-order harmonics can be seen as well. Thepower of the ion line and plasma line has shownovershoot effect, single-humped, double-humpedand triple-humped structures have appeared inthe power profile of plasma line, and the enhancementin power amplitude of the plasma line decreasesexponentially as the frequency increases.Additionally, with consideration of the elasticcollision between electrons and neural particlesand the excitation of rotation energy level, the effectsof ionospheric heating on the spectra are in-Figure 25: Spectra with pump frequency.vestigated. Results show that with the increasein electric field, the non-Maxwellian feature is enhancedas indicated by Fig. 24. Figure 25 showsthat the non-Maxwellian feature is weakened asthe increase in heating frequency.B. Xu, et al., “Incoherent <strong>scatter</strong> spectra due to HF heatingin the low ionosphere region, Science in China SeriesE (Technical Sciences) 52(2), 1–5, 2009.B. Xu, et al., “Observations of the heating experimentsin the polar winter ionosphere”, Chinese Journal of Geophysics52(4), 859–877, 2009.F-region electron heating by X-mode radiowavesModifications of the electron temperature in theF-region produced by powerful high frequencyradiowaves at 4.04 MHz transmitted in X-modewere observed (Fig. 26). The experiments were28
performed during quiet nighttime conditions withlow ionospheric densities so no reflections occurred.Electron temperature enhancements of theorder of 300–400 K were obtained. Numerical simulationof ohmic heating by the pump wave reproducesboth altitude profiles and temporal dependenceof the temperature modifications in theexperiments.H. Löfås, et al., “F-region electron heating by X-mode radiowavesin underdense conditions, Annales Geophysicae27(6), 2585–2592, 2009.Ionospheric modification and plasmaphysicsThe Space Plasma Exploration by Active Radar(SPEAR) facility, co-located with ESR, has beenused to study aspect sensitive phenomena whenthe ionosphere is pumped with HF radio waves.Observations of E- and F-region SPEAR-inducedspectral enhancements consistent with the actionsof both the purely growing mode and the parametricdecay instability, together with E-regionenhancements consistent with mode conversionalong sporadic E-layer vertical gradients near thecritical layer have been made (Fig. 27). Consistentenhancements from field-aligned, around verticaland also from 5 ◦ south of field-aligned werefound. Reasons for the prevalence of observationsfrom (close to) vertical include the existence ofthe Spitze region, throughout which propagatinghigh-power waves may reach their highest possiblereflection point where RF-induced instabilitiesmay be excited. In addition, observations of enhancedfield-aligned <strong>scatter</strong> may be aided by thepresence of field-aligned irregularities, which mayguide the electrostatic waves that are excited byRF-induced instabilities. However, the enhancementsfor pointing directions of ∼5–8 ◦ south offield-aligned require further investigation.The first power-stepping experiments usingSPEAR have been performed. Both CUTLASSSuperDARN radars detected back<strong>scatter</strong> fromSPEAR-induced Artificial Field-Aligned Irregularities(AFAIs) while the effective radiated power ofSPEAR was varied from 1–10 MW. It was demonstratedthat AFAI could be excited by a SPEARERP of only 1 MW and that once created the irregularitiescould be maintained for even lowerpowers. The experiment also demonstrated thatthe very high latitude ionosphere exhibits hysteresis,where the down-going part of the power cycleprovided a higher density of irregularities than forthe equivalent part of the up-going cycle. The ESRFigure 27: ESR ion and plasma line amplitudesfrom 7 December 2005. Panels (a) to (d) showthe F-region ion-line (150–250 km), E-region ionline(80–110 km), the upshifted plasma-line anddownshifted plasma-line, respectively. Panel (e)shows the 32 m dish elevation angle. ESR fieldaligned(FA) pointing is denoted by black rectangles.The red bars indicate periods of high ionor plasma line amplitude consistent with the actionof SPEAR. There are clear ion and plasma linespectral enhancements from several directions, includingfrom FA+15 ◦ , FA+10 ◦ , FA+5 ◦ , FA, FA-5 ◦and FA-15 ◦ , with notable enhancement occurringin FA. The upshifted and downshifted plasma lineenhancements occur mainly in the E-region and areclearly well correlated, both with each other andwith the ion line enhancements.failed to detect any hysteresis in the plasma parametersover Svalbard in stark contract with previousUHF measurements.SPEAR has also been employed to excite ULFwaves on local magnetic field lines. An intervalfrom February 2006, when SPEAR was transmittinga 1 Hz modulation signal with a 10 min on/offcycle was investigated. Ground magnetometerdata indicated that SPEAR modulated currents in29
Figure 26: Temporal evolution of the electron temperature for the three different days, (a) 17 October, (b) 18October and (c) 19 October. Temperatures derived from conditionally averaged raw radar data, received atthe same offset time from the nearest HF on time, are plotted vs time along with the error bars. Exponentialfits to temperature rise and fall are shown in green. Results of the time dependent modeling of collisionalohmic heating by the pump wave are shown in red.the local ionosphere at 1 Hz, and enhanced a naturalfield line resonance with a 10 min period. Overheadsignatures of the SPEAR-enhanced field lineresonance were present in the magnetic field datameasured by the magnetometer on-board Cluster2. These results were the first joint groundandspace-based detections of field line tagging bySPEAR.R. S. Dhillon, T. R. Robinson, and T. K. Yeoman, “Aspectsensitive E- and F-region SPEAR-enhanced <strong>incoherent</strong>back<strong>scatter</strong> observed by the <strong>EISCAT</strong> Svalbard radar”,Annales Geophysicae 27(1), 65–81, 2009.D. M. Wright, et al., “Excitation thresholds of fieldalignedirregularities and associated ionospheric hysteresisat very high latitudes observed using SPEARinducedHF radar back<strong>scatter</strong>”, Annales Geophysicae27(7), 2623–2631, 2009.S. V. Badman, et al., “Cluster spacecraft observationsof a ULF wave enhanced by Space Plasma Explorationby Active Radar (SPEAR)”, Annales Geophysicae 27(9),3591–3599, 2009.Studies of the thermosphereTemperature enhancements and verticalwinds in the lower thermosphere associatedwith auroral heating during theDynamics and Energetics of the LowerThermosphere in Aurora (DELTA) campaignA coordinated observation of the atmospheric responseto auroral energy input in the polar lowerthermosphere was conducted during the Dynamicsand Energetics of the Lower Thermosphere inAurora (DELTA) campaign. N 2 rotational temperaturewas measured with a rocket-borne instrumentlaunched from the Andøya Rocket Range,neutral winds were measured from auroral emissionsat 557.7 nm with a Fabry-Perot Interferometer(FPI) at Skibotn and the KEOPS, and ionosphericparameters were measured with the EuropeanIncoherent Scatter (<strong>EISCAT</strong>) UHF radar atTromsø. Altitude profiles of the passive energy depositionrate and the particle heating rate were estimatedusing data taken with the <strong>EISCAT</strong> radar.The local temperature enhancement derived fromthe difference between the observed N 2 rotationaltemperature and the MSISE-90 model neutral temperaturewere 70–140 K at 110–140 km altitude.The temperature increase rate derived from theestimated heating rates, however, cannot accountfor the temperature enhancement below 120 km,even considering the contribution of the neutraldensity to the estimated heating rate. The observedupward winds up to 40 m/s seem to respondnearly instantaneously to changes in theheating rates (see Fig. 28). Although the windspeeds cannot be explained by the estimated heatingrate and the thermal expansion hypothesis, thepresent study suggests that the generation mechanismof the large vertical winds must be responsiblefor the fast response of the vertical wind to theheating event.J. Kurihara, et al., “Temperature enhancements and verticalwinds in the lower thermosphere associated withauroral heating during the Dynamics and Energeticsof the Lower Thermosphere in Aurora (DELTA) campaign”,Journal of Geophysical Research 114, A12306,doi:10.1029/2009JA014392, 2009.30
Height-integrated Heating Rate [mW m -2 ]50403020100-4021:00 22:00 23:00 00:00 01:00 02:00 03:00Universal Time (12-13 Dec 2004)Qw403020100-10-20-30Vertical Wind Speed [m s -1 ]Figure 28: Time variations of the height-integratedheating rate derived from the data observed withthe <strong>EISCAT</strong> UHF radar at Tromsø (solid line) andvertical wind speed derived from the auroral greenline observation with the Fabry-Perot Interferometerat Skibotn (dashed line).Meso-scale thermospheric responseThe meso-scale response of the thermosphere hasbeen studied at ESR on 5 Dec 2007 in conjunctionwith the Svalbard Fabry-Perot Interferometer(FPI) and SCANning Doppler Imager (SCANDI)for a very localised heating event, in both time andspace, corresponding to the IMF B z going negativefor ∼50 minutes. Both optical instrumentsmeasure neutral wind velocity and temperature,which began to respond within 15 minutes to theonset of the disturbance. This is far more rapidthan expected. The localised winds were acceleratedby up to 100 m/s over a period of half an hourwhile the winds in the rest of the region were fairlysteady. The neutral temperature rose by ∼100 Kover a period of 40 minutes over the entire field ofview. The importance of these observations is thatsignificant meso-scale variability is present in thethermosphere and therefore needs to be incorporatedinto models in order to properly account forenergy dissipation in the thermosphere.E. M. Griffin, et al., “Upper thermospheric ion-neutralcoupling from combined optical and radar experimentsover Svalbard”, Annales Geophysicae 27(11), 4293–4303, 2009.Acceleration mechanism of high-speedneutral wind observed in the polar lowerthermosphereWe investigated the acceleration mechanism of thelower thermospheric neutral wind when the iono-Figure 29: The ion velocity at 211 km and (bottom)ion (dotted line) and neutral wind (solid line) velocitiesat 118 km observed from 0600 to 1800 UTon 16 June 2005 with ESR.spheric convection becomes enhanced. The ESRCP2 measurement on 16 June 2005 detected thatthe lower thermospheric wind accelerated to unusuallyhigh speed (∼500 m/s) (Fig. 29). Thiswind acceleration seemed to be well correspondingwith the enhanced ionospheric convection afterchanges of the solar wind parameters by theACE satellite. We evaluated the ion drag and theJoule-heating-induced pressure gradient contributionson the generation of the high-speed neutralwind. We concluded that the pressure gradientforce was the most probable force in this event.T. T. Tsuda, et al., “Acceleration mechanism of highspeedneutral wind observed in the polar lower thermosphere”,Journal of Geophysical Research 114, A04322,doi:10.1029/2008JA013867, 2009.31
DELTA-2 campaign: Study of the energeticsand the wind dynamics in the polarlower thermosphereDynamics and Energetics of the Lower Thermospherein Aurora 2 (DELTA-2) campaign was conductedunder collaboration with the rocket, the<strong>EISCAT</strong> UHF radar, Fabry-Perot interferometer(FPI), and various optical instruments in order tostudy the energetics and the wind dynamics in thepolar lower thermosphere from January 14 to 26,2009. The S-310-39 sounding rocket, which carriedtrimethyl aluminum (TMA) to conduct in-situmeasurement of the neutral wind, was launchedfrom the Andøya rocket range at 00:15 UT on26 January 2009. An auroral breakup occurredabout 10 minutes from the rocket launch. The<strong>EISCAT</strong> UHF radar was operated for 107.5 hoursduring the campaign under international collaborationswith Norway, Sweden, Finland, Germany,France, and Japan. The data set taken during thecampaign is appropriate for studying many <strong>scientific</strong>issues such as the wind dynamics, ionosphericconductivity, and current system. FPI (557.7 nm)was operated with the rocket observation, andit provided dramatic wind variations associatedwith the breakup.Studies of dust and meteoritesMeasurements of meteor smoke particlesduring the ECOMA-2006 campaignThe <strong>EISCAT</strong> (European Incoherent SCATter)radars did support the ECOMA (Existence andCharge state Of Meteoric smoke particles in themiddle Atmosphere) campaign conducted at Andenes(Andøya Island, Norway, 69 ◦ N, 16 ◦ E) in2006. Instrumented rockets were launched to investigatemeteoric smoke particles. These particlesplay an important role in atmospheric processessuch as in the nucleation of noctilucent clouds(NLC) and polar stratospheric clouds (PSC). Theexperimental quantification of these meteor smokeparticles is a highly challenging and ongoing <strong>scientific</strong>project using in-situ rocket and groundbasedradar observations. A new rocket-borneparticle detector which is a combination betweena classical Faraday cup and a Xenon flashlampfor active photoionisation of meteoric dust particlesand their subsequent detection of correspondingphotoelectrons was introduced by Rappand Strelnikova (2009). The first rocket duringthe ECOMA-2006 campaign was further equippedwith instruments to measure several plasma parametersduring the flight at mesospheric altitudes.A detailed analysis of the results of theECOMA-01 rocket launch was published by Strelnikovaet al. (2009) which clearly describes the instrumentationof the rocket payload and the <strong>scientific</strong>results.In the following, one experiment on ECOMA-01 will be presented in more detail. Onboard theECOMA payload an radio wave propagation experimentwas launched to measure electron densitiesusing the differential absorption of radiowaves. The neutral and ionised background atmospherewas simultaneously observed by the EIS-CAT radars located near Tromsø, Norway. Duringthe night of the rocket launch the <strong>EISCAT</strong>radars detected an enhanced ionization in theD-region created after an energetic partical precipitationstarting at 21:58 UT on Sep. 8, 2006.Shortly after this time a sporadic E-layer (E s ) developedwith maximum electron number densitiesof ∼10 5 cm −3 at an altitude of 94.5 km. Thelayer was quite stable for about an hour and settleddown until it disappeared around 0:00 UT.The electron densities were observed with both<strong>EISCAT</strong> radars on the mainland (VHF and UHF).Fig. 30 shows the electron density measurementsobtained from the <strong>EISCAT</strong> UHF radar around thelaunch time of the rocket which is indicated bythe vertical line. The ionospheric conditions weremoderate to quiet which was also confirmed byriometer measurements. The right hand panelshows the electron densities obtained from both,UHF and VHF, radars and the radio wave propagationexperiment. Between 93 and 96 km an increaseof electron number densities was observedwhere the red line shows the results from the Faradayrotation experiment. Note that the altitudedifference of the sporadic E-layer might be dueto the horizontal distance between the radar sitesand the rocket location (∼130 km). Comparingground-based and in-situ experimental results ofelectron number density measurements leads toqualitatively and quantitatively similar results.Simultaneously, temperatures measurementswere obtained from the colocated Na-lidar and theRMR-lidar as well as from the rocket-borne neutralair density measurements. These measurementsshow temperatures in large excess of the frostpoint of water indicating that ice particles couldnot be formed at mesospheric altitudes at the timeof the in-situ rocket measurements (Strelnikova etal., 2009). On the other hand, the ECOMA detectorregistered particle signatures in both data chan-32
Figure 30: Left panel: Electron number densities measured with the <strong>EISCAT</strong> UHF-radar on 8 September2006. The red vertical line indicates the time of the ECOMA-01 start. Right panel: Electron number densityprofile from the <strong>EISCAT</strong> UHF and VHF radars (black and blue lines) from the time of the ECOMA-01 launchcompared to the in situ results from the Faraday rotation experiment (red line) and the current to the positivelybiased front grid of the ECOMA particle detector (green line, normalized to the Faraday rotation experimentat 110 km altitude). Note that the difference in altitude of the sporadic layer seen in the radar and rocketmeasurementsis likely due to the horizontal distance between the different observations (∼130 km).nels, the directly impacted particles on the detectorelectrode and the photoelectrons generated byphotoionisation or photodetachment of particles.These photoelectron measurements showed thatparticles exist in the entire altitude range between60 and 90 km. The measured currents were convertedto meteor smoke particle number densitieswhich are in qualitatively agreement with modelpredictions.M. Rapp, and I. Strelnikova, “Measurements of meteorsmoke particles during the ECOMA-2006 campaign:1. Particle detection by active photoionization”, Journalof Atmospheric and Solar-Terrestrial Physics 71(3–4), 477–485, doi:10.1016/j.jastp.2008.07.011, 2009.I. Strelnikova, et al., “Measurements of meteorsmoke particles during the ECOMA-2006campaign: 2. Results”, Journal of Atmosphericand Solar-Terrestrial Physics 71(3–4), 486–496,doi:10.1016/j.jastp.2008.07.011, 2009.High statistics radar meteor studies at<strong>EISCAT</strong>An experiment was conducted with the EuropeanIncoherent Scatter (<strong>EISCAT</strong>) radars during three 8-hour runs on consecutive nights in December 2008aiming to detect and study the high-altitude meteorpopulation along with the meteors detected atclassical ∼100 km altitudes. The experiment usedcoaxial ultrahigh-frequency (UHF) and very highfrequency(VHF) radar beams pointed verticallyto the zenith of Ramfjordmoen near Tromsø (Norway),and remote UHF receivers at Kiruna (Sweden)and Sodankylä (Finland) for tristatic observationsof a very limited volume at an altitude of170 km above the transmitter site.The <strong>EISCAT</strong> VHF radar detected during the 24-hour period 22,698 echoes identified as meteors.The number of UHF echoes in the same periodwas 2138, most detected also at VHF. Among theVHF meteors, 11 were detected at altitudes higherthan 150 km. Of these, the record highest meteorwas at 246.9 km. No high-altitude UHF echoeswere detected, none was tristatic, and no echoeswith a Doppler velocity above ∼60 km/s wereidentified. Given the large number of echoes,which argues in favour of a highly significant characterizationof the meteoroid population, we discussthe statistical properties of the detections andtheir possible physical nature.The average detection rate of VHF radar meteorswas about 16 min −1 . Comparing this high ratewith that of the faintest optically detected meteorsindicates that the radar detections originate froma meteoroid population that could be as opticallyfaint as 13–14 mag. We did not observe a markedenhancement of the rates at the peak of the Gem-33
ack<strong>scatter</strong> due to the occurrence of polar mesospheresummer echoes (PMSE) rather than electrondensities. The interpretation of the radarback<strong>scatter</strong> for altitudes below 90 km is based onthe physics of PMSE.M. Friedrich, et al., “Signatures of mesospheric particlesin ionospheric data”, Annales Geophysicae 27(2), 823–829, 2009.Solar wind studiesFigure 31: Altitude–Doppler-intensity plot for onemeteor track. The deceleration is evident since theDoppler velocity is smaller at lower altitudes. Thevisible curvature of this plot implies that the decelerationwas not constant; the meteoroid deceleratedfaster at lower altitudes.inid shower, confirming once again the proposalthat most faint meteors, be these radar or optical,belong to the sporadic population and not to a specificshower.For a few meteors, our data show definite decelerationand possible fragmentation (Fig. 31). Asimple calculation indicates that one of the detectedmeteoroids was a submillimetre body thatfragmented when the ram pressure reached about0.5 Pa. This is much lower than the pressure thatfragments brighter cometary meteors, which is atleast two orders of magnitude higher.N. Brosch, et al., “Unusual features in high statisticsradar meteor studies at <strong>EISCAT</strong>”, Monthly Notices ofthe Royal Astronomical Society 401(2), 1069–1079, 2010.Signatures of mesospheric particles inionospheric dataDuring a ECOMA/MASS campaign in 2007, threesounding rockets were launched from Andøya,Norway. This campaign was supported by severalground-based observations including the EIS-CAT UHF and VHF radars near Tromsø. Theelectron density measurements from the <strong>EISCAT</strong>UHF radar were considered in the discussion byFriedrich et al. (2009). In the ionospheric E-regionthe agreement between the <strong>EISCAT</strong> UHF and thein-situ probing of electron densities is remarkablygood. It is well known that below 90 kmthe ground-based radar data reflect the coherentInteraction a between medium-scaletransient in the solar wind and a streaminteraction regionWe have combined Inter-Planetary Scintillation(IPS) measurements from <strong>EISCAT</strong> with whitelightobservations from the STEREO spacecraftHI instrument to study the interaction a betweenmedium-scale transient in the solar wind and astream interaction region, showing the transientstarted within the slow wind and was subsequentlycaptured by the star interaction region.We have also observed smaller scale transients inthe slow wind, associated with significant fieldrotations. It is not yet clear whether these featuresare ubiquitous in the slow wind or associatedwith Coronal Mass Ejection (CME) wakes, butthey might be the same class of structures as thepixel-scale features seen in LASCO spacecraft observationsof the slow wind. An associated studycombined <strong>EISCAT</strong> and STEREO HI solar wind observationswith in-situ measurements from VenusExpress ASPERA-4 instrument to study the impactof stream interaction regions and solar wind transientson the Venus environment.The large-scale structure in the solar wind hasbeen investigated using IPS. <strong>EISCAT</strong> data playeda key role in improving understanding of the evolutionof the large CME of May 2005. A programmeof comparing <strong>EISCAT</strong> IPS and STEREOwhite-light results with the predicted signaturesderived from a multi-scale numerical model is underway,simulating IPS and white-light <strong>scatter</strong>ingby a CME, interacting CMEs or CME/streaminteraction region structures as they propagatethrough the background solar wind. This developmentwill significantly improve our ability to determineprecisely which region of a CME the EIS-CAT observations correspond to.G. D. Dorrian, et al., “Transient structures and streaminteraction regions in the solar wind: Results from EIS-CAT interplanetary scintillation, STEREO HI and Venus34
Express ASPERA-4 observations”, Solar Physics, submitted,2010.I. C. Whittaker, et al., “In-situ observations of a corotatinginteraction region at Venus identified by IPSand STEREO”, Solar Physics, in press, 2010.M. M. Bisi, et al., “Three-dimensional reconstructions of<strong>EISCAT</strong> IPS velocity data during the declining phase ofsolar cycle 23”, Solar Physics, in press, 2010.M. M. Bisi, et al., “From the Sun to the Earth: the 13 May2005 Coronal Mass Ejection”, Solar Physics, submitted,2010.M. Xiong, et al., “Forward modelling to determine theobservational signatures of white-light imaging and interplanetaryscintillation for the propagation of an interplanetaryshock in the ecliptic plane”, Journal of Atmosphericand Solar Terrestrial Physics, submitted, 2010.Theoretical studies of <strong>incoherent</strong><strong>scatter</strong>ing spectra20-moment approximation for ion velocitydistribution and its application in calculationsof <strong>incoherent</strong> <strong>scatter</strong> spectraAccording to Grad’s theory, the ion velocity distributionfunction is expanded about a 20-momentapproximation based on Maxwellian distribution.The effects of the stress tensor and the heat flowvector on the ion velocity distributions are discussed.When the electric field is weak, it is reasonableto neglect the heat flow vector and thestress tensor parallel to E × B and E, respectively.The ion temperature anisotropy and asymmetry inthe distribution function are caused by the stresstensor and the heat flow term. The <strong>incoherent</strong><strong>scatter</strong> spectra calculated by the 13-moment approximationand the 20-moment approximationare compared. When the electric field is weak,the 13-moment is nearly consistent with the 20-moment approximation. However it is unreasonableto neglect the heat flow tensor, and the temperatureanisotropy is distinct in case of strongelectric field as is seen in Fig. 32). It is reasonableto use the 20-moment approximation to describethe non-Maxwellian plasma characterized by thetemperature anisotropy.In addition, a sixteen moment approximationbased on a bi-Maxwellian that contains the stresstensor and the heat flow vector is applied to describethe ion velocity distribution which is suitablefor the non-Maxwellian plasma characterisedFigure 32: The 20-moment approximation for the<strong>incoherent</strong> <strong>scatter</strong>ing spectra parallel to E × B fordifferent electric field E.by the large temperature anisotropy. A discussionis made about the effects on the <strong>incoherent</strong> <strong>scatter</strong>spectra caused by different values of the normalizedperpendicular drift velocity D, aspect angleφ between the magnetic field and the line-ofsightdirection, and the ratio α of the ion-neutralcollision to ion cyclotron frequency. Numerical resultsshow that the shifting and asymmetry of <strong>incoherent</strong><strong>scatter</strong> spectra appear parallel to E × Band E as the normalised perpendicular drift velocityD increases due to the ion drift velocity,the stress tensor and the heat flow vector respectively.However, the spectrum is always typicallydouble-humped Maxwellian parallel to B. Theion velocity distribution is more distorted from theMaxwellian as the aspect angle φ increases from0 ◦ to 90 ◦ , and consequently the <strong>incoherent</strong> <strong>scatter</strong>spectra is no longer typically double-humpedMaxwellian. As α increases, the ion velocity distributionbecomes Maxwellian and the <strong>incoherent</strong><strong>scatter</strong> spectra become typically double-humpedMaxwellian even with a large value of the normalisedperpendicular drift velocity D.K. Xue, et al., “20-moment approximation for ion velocitydistribution and its application in calculations of<strong>incoherent</strong> <strong>scatter</strong>ing spectra”, Chinese Journal of Geophysics52(2), 342–351, 2009.K. Xue, et al., “16-moment approximation for ion velocitydistribution and its application in calculations of <strong>incoherent</strong><strong>scatter</strong>ing spectra”, Plasma Science and Technology11(2), 152–158, 2009.K. Xue, et al., “The ion distribution function fromMaxwell molecule collision model and calculations of<strong>incoherent</strong> <strong>scatter</strong> spectra”, Chinese Journal of SpaceScience 29(3), 287–295, 2009.Incoherent <strong>scatter</strong> spectra of collisionalplasmaIncoherent <strong>scatter</strong> spectra of a collisional plasmawith an arbitrary velocity distribution function is35
Figure 33: Variation of the power spectrum withdifferent collision frequency.presented. Two integrals with complex singularpoints have been solved in order to obtain the results.The <strong>incoherent</strong> <strong>scatter</strong> spectra during HFheating in low ionosphere region are computed. Asuper-Gaussian function is adopted in the calculationwith a non-Maxwellian factor m. The effect ofcollision frequency, non-Maxwellian factor, electrondensity, electron temperature and ion temperatureon power spectra is discussed (Fig. 33).Under the action of collision frequency and non-Maxwellian factor, the original relationship betweenionospheric parameters and the characteristicsof spectra shape is invalid, which will bringa large error in the inversion of ionosphere parameters,thus the original theoretical model must becorrected.B. Xu, et al., “Incoherent <strong>scatter</strong> spectra of a collisionalplasma”, Acta Physica Sinica 58(7), 736–742, 2009.36
List of publications 2009Aikio, A.T., and A. Selkälä, Statistical properties of Jouleheating rate, electric field and conductances at high latitudes,Ann. Geophys., 27, 2661-2673, 2009.Blagoveshchenskaya, N.F., H.C. Carlson, V.A. Kornienko,T.D. Borisova, M.T. Rietveld, T.K. Yeoman, andA. Brekke, Phenomena induced by powerful HF pumpingtowards magnetic zenith with a frequency near theF-region critical frequency and the third electron gyroharmonic frequency, Ann. Geophys., 27, 131-145, 2009.Cai, H.T., McCrea I.W., Dunlop M.W., Davies J.A., BogdanovaY.V., Pitout F., Milan S.E., Lockwood M. and MaS.Y., Cusp observations during a series of fast IMF Bzreversals., Ann. Geophys., 27, 2721-2737, 2009.Cai H.T., Ma S.Y., McCrea I.W., et al., Polar ionosphericresponses to 4-times rapid turnings of the IMF B-zcomponent-<strong>EISCAT</strong>/ESR radar observations, Chinese J.Geophys. (in Chinese), 52(7): 1685-1692, 2009.Dhillon, R.S., T.R. Robinson, and T.K. Yeoman, Aspectsensitive E- and F-region SPEAR-enhanced <strong>incoherent</strong>back<strong>scatter</strong> observed by the <strong>EISCAT</strong> Svalbard radar,Ann. Geophys., 27, 65-81, 2009.Friedrich, M., K.M. Torkar, W. Singer, I. Strelnikova, M.Rapp, and S. Robertson, Signatures of mesospheric particlesin ionospheric data, Ann. Geophys., 27, 823-829,2009.Fujii, R., Y. Iwata, S. Oyama, S. Nozawa, and Y. Ogawa,Relations between proton auroras, intense electric field,and ionospheric electron density depletion, J. Geophys.Res., 114, A09304, doi:10.1029/2009JA014319, 2009.Griffin, E.M., Aruliah, A.L., McWhirter, I., Yiu, H.-C.I., and Charalambous, A.: Upper thermospheric ionneutralcoupling from combined optical and radar experimentsover Svalbard, Ann. Geophys., 27, 4293-4303,2009.Hartquist, T., O. Havnes and M. Kassa, Exploring polarmesospheric summer echoes, Astronomy & Geophysics,50, 1, 1.08 - 1.14, 2009.Havnes, O., and M. Kassa, On the sizes and observableeffects of dust particles in polar mesosphericwinter echoes, J. Geophys. Res., 114, D09209,doi:10.1029/2008JD011276, 2009.Havnes, O., M. Kassa, G.E. Morfill and C. La Hoz, Onthe sizes, charges and effects of dust particles in polarmesospheric winter echoes, Proceedings of the 19thESA Symposium on European rocket and Balloon Programmesand Related Research, 7-11 June 2009, Bad Reichenhall,Germany, Esa publication, 2009.Havnes, O., C. La Hoz, M.T. Rietveld, M. Kassa, G. Baroniand A. Biebricher, Observation and analysis of olarmesospheric winter echoes modulated by artificial electronheating, Proceedings of the 19th ESA Symposiumon European rocket and Balloon Programmes and RelatedResearch, 7-11 June 2009, Bad Reichenhall, Germany,Esa publication, 2009.Kalogerakis, K.S., T.G. Slanger, E.A. Kendall, T.R. Pedersen,M.J. Kosch, B. Gustavsson, and M.T. Rietveld,Remote Oxygen Sensing by Ionospheric Excitation(ROSIE), Ann. Geophys., 27, 2183-2189, 2009.Kozlovsky, A., T. Turunen, and S. Massetti, Fieldalignedcurrents of postnoon auroral arcs, J. Geophys.Res., 114, A03301, doi:10.1029/2008JA013666, 2009.Kurihara, J., Oyama, S. Nozawa, S., Tsuda, T.T., Fujii,R., Ogawa, Y., Miyaoka, H., Iwagami, N., Abe, T.,Oyama, K.-I., Kosch, M., Aruliah, A., Griffin, E. , andK. Kauristie, K., Temperature enhancements and verticalwinds in the lower thermosphere associated with auroralheating during the Dynamics and Energetics of theLower thermosphere in Aurora (DELTA) campaign, J.Geophys. Res., 114, A12306, doi:10.1029/2009JA014392,2009.Lanchester, B.S., M. Ashrafi, N. Ivchenko, Simultaneousimaging of aurora on small scale in OI (777.4 nm) andN21P to estimate energy and flux of precipitation, AnnalesGeophysicae 27(7), 2881–2891, 2009.Leyser, T.B., and E. Nordblad, Self-focused radio frequencyL wave pumping of localized upper hybrid oscillationsin high-latitude ionospheric plasma, Geophys.Res. Lett., 36, L24105, doi:10.1029/2009GL041438, 2009.Leyser, T.B., and A.Y. Wong, Powerful electromagneticwaves for active environmental research in geospace,Rev. Geophys., 47, RG1001, doi:10.1029/2007RG000235,2009.37
Li, Hailong, Study on the echo characteristics of PolarMesosphere Summer Echoes, PhD thesis, Xidian University,China, 2009.Li Hailong, Wu Jian, Huang Jiying, Wang Maoyan, Oneanalysis on the rocket detection of polar mesospheresummer echoes, Chin. J. Space Sci., 29(4): 397-401,2009a.Li Hailong, Wu Jian , Huang Jiying , WANG Maoyan,Study on the relation between the reflectivity and frequencyin dusty plasma of polar summer mesopause,Plasma Science and Technology, 11(3): 279-282, 2009b.Li Hui Wu Jian Wu Jun Che Hai-Qing, Study on theSharp Boundary of Layered Dust Structure in the SummerPolar Mesopause, Chinese journal of polar research,21(4): 272-278, 2009.Lofas, H., N. Ivchenko, B. Gustavsson, T.B. Leyser, andM.T. Rietveld, F-region electron heating by X-mode radiowavesin underdense conditions, Ann. Geophysicae,27, 2585-2592, 2009.Lunde, J., Particle Precipitation: Effects on SelectedIonospheric Phenomena, Ph.D thesis, University ofTromsø, Norway, 2009.Lunde, J., U. P. Løvhaug, and B. Gustavsson, Particleprecipitation during NEIAL events: simultaneousground based nighttime observations at Svalbard, Ann.Geophys., 27, 2001-2010, 2009.Maeda, S., Y. Ogawa, K. Hosokawa, S. Nozawa, S.Oyama, T. Tsuda, and A. Brekke, Ion heating in highspeedflow channel within the duskside cell of the polarcapion convection under large IMF-By condition, J.Geophys. Res., 114, A11307, doi:10.1029/2009JA014300,2009.Ogawa, Y., S. C. Buchert, R. Fujii, S. Nozawa, andA. P. van Eyken, Characteristics of ion upflow anddownflow observed with the European Incoherent ScatterSvalbard radar, J. Geophys. Res., 114, A05305,doi:10.1029/2008JA013817, 2009.Ogawa, Y., I. Haggstrom, S. C. Buchert, K. Oksavik,S. Nozawa, M. Hirahara, A. P. van Eyken, T. Aso,and R. Fujii, On the source of the polar wind in thepolar topside ionosphere: First results from the EIS-CAT Svalbard radar, Geophys. Res. Lett., 36, L24103,doi:10.1029/2009GL041501, 2009.Osepian, A., S. Kirkwood, P. Dalin, and V. Tereschenko,D-region electron density and effective recombinationcoefficients during twilight - experimental data andmodelling during solar proton events, Ann. Geophys.,27, 3713-3724, 2009.Pitkänen, T., A.T. Aikio, A. Kozlovsky, and O. Amm,Reconnection electric field estimates and dynamics ofhigh-latitude boundaries during a substorm, Ann. Geophys.,27, 2157-2171, 2009.Rapp, M., I. Strelnikova, B. Strelnikov, R. Latteck, G.Baumgarten, Q. Li, L. Megner, J. Gumbel, M. Friedrich,U.-P. Hoppe, and S. Robertson, First in situ measurementof the vertical distribution of ice volume in a mesosphericice cloud during the ECOMA/MASS rocketcampaign,Ann. Geophys., 27, 755-766, 2009.Rentz, Stefanie, The Upper Atmospheric Fountain Effectin the Polar Cusp Region, PhD thesis, Fakultät für Elektrotechnik,Informationstechnik, Physik der TechnischenUniversität Carolo-Wilhelmina zu Braunschweig,Germany, 2009.Safargaleev, V.V., T.I. Sergienko, A.E. Kozlovsky, I. Sandahl,U. Brändström and D.N. Shibaeva, Electric fieldenhancement in an auroral arc according to the simultaneousradar (<strong>EISCAT</strong>) and optical (ALIS) observations,Geomagnetism and Aeronomy, 49, 3, 353-367, 2009.Sojka, J.J., R.L. McPherron, A.P. van Eyken, M.J. Nicolls,C.J. Heinselman, and J.D. Kelly, Observations of ionosphericheating during the passage of solar coronalhole fast streams, Geophys. Res. Lett., 36, L19105,doi:10.1029/2009GL039064 , 2009.Strelnikova, I., Mesospheric aerosol particles: Evidencefrom rocket and radar techniques, Ph.D. Thesis,Mathematisch-Naturwissenschaflichen Fakultat derUniversitat Rostock, Germany, 2009.Strelnikova, I., M. Rapp, B. Strelnikov, G. Baumgarten,A. Brattli, K. Svenes, U.-P. Hoppe, M. Friedrich, J. Gumbel,B.P. Williams, Measurements of meteor smoke particlesduring the ECOMA-2006 campaign: 2. Results, J.Atmos. Sol.-Terr. Phys., 71, 3-4, 486-496, 2009.Taguchi, S., S. Suzuki, K. Hosokawa, Y. Ogawa, A.S.Yukimatu, N. Sato, M.R. Collier, and T.E. Moore,Moving mesoscale plasma precipitation in the cusp,J.Geophys. Res., 114, A06211, doi:10.1029/2009JA014128,2009.Tsuda, T. T., S. Nozawa, S. Oyama, T. Motoba, Y.Ogawa, H. Shinagawa, N. Nishitani, K. Hosokawa,N. Sato, M. Lester, and R. Fujii, Acceleration mechanismof high-speed neutral wind observed in the polarlower thermosphere, J. Geophys. Res., 114, A04322,doi:10.1029/2008JA013867, 2009.Vierinen, V., et al., Measuring space debris with phasecoded aperiodic transmission sequences, Proceedings ofthe 5th European Conference on Space Debris, 2009.38
Vierinen, V., and M. S. Lehtinen, 32-cm wavelengthradar mapping of the moon, Proceedings of the 6th EuropeanRadar Conference, 2009.Vierinen, J., J. Markkanen, and H. Krag, High powerlarge aperture radar observations of the Iridium-Cosmos collision, Proceedings of the 10th AdvancedMaui Optical and Space Surveillance Technologies Conference,2009.Virtanen, I., Multi-purpose Methods for IonosphericRadar Measurements, Ph.D. Thesis, Department ofPhysics, University of Oulu, Finland, Report No. 59, ReportSeries in Physical Sciences, ISBN 978-951-42-9283-5,ISSN 1239-4327, Oulu University Press, Oulu 2009.Virtanen, I.I., J. Vierinen, and M. S. Lehtinen, Phasecodedpulse aperiodic transmitter coding, Ann. Geophys.,27, 2799-2811, 2009.Wood, A.G., S. E. Pryse, and J. Moen, Modulation ofnightside polar patches by substorm activity, Ann. Geophys.,27, 3923-3932, 2009.Xu, Bin, Study on the <strong>incoherent</strong> <strong>scatter</strong> spectra and itsapplication in the ionospheric heating, PhD thesis, XidianUniversity, China, 2009.Xu Bin, Wu Jian, Wu Zhensen and Xue Kun, IncoherentScatter Spectra due to HF Heating in the Low IonosphereRegion, Sci China Ser E-Tech Sci , 52 (2): 1-5,2009b.Xu Bin, Wu Jun, Wu Jian, Wu Zhensen, Che Haiqin,Xu Zhengwen, Xue Kun, Yan Yubo, Observations ofthe heating experiments in the polar winter ionosphere,Chinese Journal of Geophysics, 52(4): 859-877, 2009c.Xue, Kun, Theoretical and Experimental Study on theIncoherent Scatter Spectrum of High Latitude AuroralIonosphere, PhD thesis, Xidian University, China, 2009.Zalizovski, A.V., S.B. Kashcheyev, Y.M. Yampolski, V.G.Galushko, V. Belyey, B. Isham, M.T. Rietveld, C. LaHoz, A. Brekke, N.F. Blagoveshchenskaya, and V.A. Kornienko,Self-<strong>scatter</strong>ing of a powerful HF radio waveon stimulated ionospheric turbulence, Radio Sci., 44,RS3010, doi:10.1029/2008RS004111., 2009.39
<strong>EISCAT</strong> Operations 2009The <strong>EISCAT</strong> radars operate in two basic modes,using approximately half the available observingtime for each. In the Special Programme mode,users conduct individual experiments dedicatedto specific experiments and objectives. The resultingdata are reserved for the exclusive use of theexperimenters for one year from the date of collection.Special programmes often make use ofthe well developed pulse schemes and observingmodes of the Common Programme. <strong>EISCAT</strong> CommonProgrammes are conducted for the benefit ofthe entire user community and the resulting dataare immediately available to all. The common Programmemodes are developed and maintained by<strong>EISCAT</strong> staff, and the overall programme is monitoredby the Scientific Advisory Committee. CommonProgramme operations are often conductedas part of the coordinated World Day programmeorganised by the International Union of Radio Scientists(URSI) Incoherent Scatter Working Group(ISWG).Common Programme One, CP-1, uses a fixedtransmitting antenna, pointing along the geomagneticfield direction. The three-dimensional velocityand anisotropy in other parameters are measuredby means of the receiving stations at Kirunaand Sodankylä (see map, inside front cover). CP-1is capable of providing results with very good timeresolution and is suitable for the study of substormphenomena, particularly auroral processes whereconditions might change rapidly. The basic timeresolution is 5 s. Continuous electric field measurementsare derived from the tri-static F-regiondata. On longer time scales, CP-1 measurementssupport studies of diurnal changes, such as atmospherictides, as well as seasonal and solar-cyclevariations. The observation scheme uses alternatingcodes for spectral measurements.Common Programme Two, CP-2, is designed tomake measurements from a small, rapid transmitterantenna scan. One aim is to identify wave-likephenomena with length and time scales comparablewith, or larger than, the scan (a few tens ofkilometers and about ten minutes). The presentversion consists of a four-position scan which iscompleted in six minutes. The first three positionsform a triangle with vertical, south, and south-eastpositions, while the fourth is aligned with the geomagneticfield. The remote site antennas providethree-dimensional velocity measurements in the F-region. The pulse scheme is identical with that ofCP-1.Common Programme Three, CP-3, covers a 10 ◦latitudinal range in the F-region with a 17-positionscan up to 74 ◦ N in a 30 minute cycle. The observationsare made in a plane defined by the magneticmeridian through Tromsø, with the remotesite antennas making continuous measurements at275 km altitude. The coding scheme uses alternatingcodes. The principle aim of CP-3 is the mappingof ionospheric and electrodynamic parametersover a broad latitude range.Common Programmes One, Two, and Three arerun on the UHF radar. Three further programmesare designed for use with the VHF system. TheUHF and VHF radars are often operated simultaneouslyduring the CP experiments. Such observationsoffer comprehensive data sets for atmospheric,ionospheric, and magnetospheric studies.Common Programme Four, CP-4, covers geographiclatitudes up to almost 80 ◦ N (77 ◦ N invariantlatitude) using a low elevation, split-beam configuration.CP-4 is particularly suitable for studiesof high latitude plasma convection and polar capphenomena.Common Programme Six, CP-6, is designed forlow altitude studies, providing spectral measurementsat mesospheric heights. Velocity and electrondensity are derived from the measurementsand the spectra contain information on the aeronomyof the mesosphere. Vertical antenna pointingis normally used.Common Programme Seven, CP-7, probes highaltitudes and is particularly aimed at polar windstudies. The present version uses both of the VHFklystrons and is designed to cover altitudes up to2500 km vertically above Ramfjordmoen.Equivalent Common Programme modes areavailable for the <strong>EISCAT</strong> Svalbard Radar. CP-1is directed along the geomagnetic field (81.6 ◦ in-40
clination). CP-2 uses a four position scan. CP-3 is a 15 position elevation scan with southerlybeam swinging positions. CP4 combines observationsin the F-region viewing area with fieldalignedand vertical measurements. Alternatingcode pulse schemes have been used extensivelyfor each mode to cover ranges of approximately80 to 1200 km with integral clutter removal below150 km.The tables on the next pages summarise the accountedhours on the various facilities for eachmonth and for each Common Programme mode(CP) or Associate (SP).41
2009KST COMMON PROGRAMMES2009 Jan Feb Mar Apr May Jun Jul Aug Sept Oct Nov Dec Total % Target%CP1 7.5 5 3 102.5 118 13 16CP2 87.5 352.5 440 47 16CP3 80.5 135 215.5 23 12CP4 0 0 10CP6 32.5 87.5 11 131 14 20CP7 0 0 18UP1 24.5 24.5 3UP2 0 0UP3 0 0Total 87.5 64.5 85.5 3 102.5 87.5 11 0 352.5 0 0 135 929 100% 9 7 9 0 11 9 1 0 38 0 0 15 100KST SPECIAL PROGRAMMES2009 Jan Feb Mar Apr May Jun Jul Aug Sept Oct Nov Dec Total Incl AA TargetCN 132 132 135 51FI 15 31 36 87 169 174 86GE 13.5 14.5 16 15 16 75 78 50NI 32.5 6 11 46 95.5 101 102NO 33 12.5 72.5 6 10 100 234 245 196SW 21 35.5 154.5 211 219 141UK 6.5 47.5 21 24.5 2 101.5 109 132AA 27 16 43Total 121.5 0 107.5 0 31 37 112 140 16 46.5 246.5 203 1061 1061 758% 11 0 10 0 3 3 11 13 2 4 23 19 100EI CN FI GE NI NO SW UKTarget 6.7 11.4 6.56 13.41 25.91 18.6 17.43 %KST OTHER PROGRAMMES2009 Jan Feb Mar Apr May Jun Jul Aug Sept Oct Nov Dec Total Target3P 8 18.5 1 27.5 15EI 0.5 8 8.5 31TNA 35 85 67.5 101 288.5 120TB 11.5 63.5 25 54.5 48.5 203 203Total 19.5 0 63.5 0 0 35 18.5 1 85 25 122.5 157.5 527.5 369KST CUMULATIVE TOTALS2009 Jan Feb Mar Apr May Jun Jul Aug Sept Oct Nov Dec Total TargetCP 87.5 64.5 85.5 3 102.5 87.5 11 0 352.5 0 0 135 929 980SP 121.5 0 107.5 0 31 37 112 140 16 46.5 246.5 203 1061 758OP 19.5 0 63.5 0 0 35 18.5 1 85 25 122.5 157.5 527.5 369Total 228.5 64.5 256.5 3 133.5 159.5 141.5 141 453.5 71.5 369 495.5 2517.5 2107USAGE BREAKDOWN2009 Jan Feb Mar Apr May Jun Jul Aug Sept Oct Nov Dec Total TargetUHF 179 29.5 131.5 3 75.5 108 42 60 278.5 44.5 215.5 257 1424 856VHF 14 32.5 49.5 8 70 28 16 40 128 386 363Heating 46 30 50.5 19 12.5 26.5 13.5 198 285Passive UHF 142 11 119 133 177.5 9.5 560 58.5 346.5 374.5 1931.5 2414ESR 126.5 120 98.5 11.5 82 108 0 33.5 267.5 21 0 287.5 1156 1342Passive ESR 58 5842Page 1
2009ESR COMMON PROGRAMMES2009 Jan Feb Mar Apr May Jun Jul Aug Sept Oct Nov Dec Total % Target%CP1 3 82.5 0.5 54 1.5 141.5 21 54CP2 30.5 49 254.5 334 50 16CP3 103 103 15 12CP4 0 0 10CP6 2.5 1.5 83.5 87.5 13CP7 1.5 1.5 0UP1 0 0UP2 0 0UP3 0 0Total 33.5 85 50.5 2 54 83.5 0 0 256 0 0 103 667.5 100% 5 13 8 0 8 13 0 0 38 0 0 15 100ESR SPECIAL PROGRAMMES2009 Jan Feb Mar Apr May Jun Jul Aug Sept Oct Nov Dec Total Incl AA TargetCN 0 4 34FI 4 22.5 26.5 33 58GE 15 15 19 33NI 33.5 21 7 61.5 69 68NO 8 10 9.5 28 9.5 29.5 94.5 110 132SW 14.5 30 44.5 56 95UK 57.5 13 12 14.5 97 107 89AA 22 26 11.5 59.5Total 84 35 48 9.5 28 39 0 33.5 11.5 21 0 89 398.5 399 509% 21 9 12 2 7 10 0 8 3 5 0 22 100ESR OTHER PROGRAMMES2009 Jan Feb Mar Apr May Jun Jul Aug Sept Oct Nov Dec Total Target3P 9 9 12EI 0 25TNA 0TB 95.5 95.5 96Total 9 0 0 0 0 0 0 0 0 0 0 95.5 104.5 133ESR CUMULATIVE TOTALS2009 Jan Feb Mar Apr May Jun Jul Aug Sept Oct Nov Dec Total TargetCP 33.5 85 50.5 2 54 83.5 0 0 256 0 0 103 667.5 700SP 84 35 48 9.5 28 39 0 33.5 11.5 21 0 89 398.5 509OP 9 0 0 0 0 0 0 0 0 0 0 95.5 104.5 133Total 126.5 120 98.5 11.5 82 122.5 0 33.5 267.5 21 0 287.5 1170.5 134243Page 2
Beynon medals5th Prof. Nobuo Matuura 2007 Awarded by theCouncil of the <strong>EISCAT</strong> Scientific Associationto Professor Nobuo Matuura. In recognitionof his contributions to the successful establishmentof the <strong>EISCAT</strong> Svalbard Radar atLongyearbyen and to the expansion of the<strong>EISCAT</strong> Scientific Association to include non-European membersThe <strong>EISCAT</strong> Council awards distinguished personsthe Sir Granville Beynon medal.Recipients1st Prof. Tor Hagfors 2002 Awarded to ProfessorTor Hagfors on 4th February 2002 for his outstandingservices to the <strong>EISCAT</strong> Scientific Associationand to Ionospheric Physics6th Prof. Markku Lehtinen 2008 Awarded by theCouncil of the <strong>EISCAT</strong> Scientific Associationto Professor Markku Lehtinen. In recognitionof his seminal contributions to the developmentof advanced modulation techniquesfor <strong>incoherent</strong> <strong>scatter</strong> radars and to the mathematicalfoundations and implementation ofeffective <strong>incoherent</strong> <strong>scatter</strong> radar data analysissystems7th Dr. Gudmund Wannberg 2009 Awarded bythe Council of the <strong>EISCAT</strong> Scientific Associationto Doctor Gudmund Wannberg. Inrecognition of his persistent work for thetechnical development of <strong>EISCAT</strong> radars andhis invaluable contribution to the EU DesignStudy project for the <strong>EISCAT</strong>_3D radars.2nd Prof. Tauno Turunen 2003 In recognition ofimportant contributions to the techniques ofIncoherent Scatter Radar and outstanding servicesto the <strong>EISCAT</strong> Scientific Association3rd Prof. Jürgen Röttger 2004 In recognition ofoutstanding services to the <strong>EISCAT</strong> ScientificAssociation including the establishmentof the <strong>EISCAT</strong> Svalbard Radar at Longyearbyen4th Prof. Henry Rishbeth 2006 Awarded by theCouncil of the <strong>EISCAT</strong> Scientific Associationto Professor Henry Risbeth. In recognition ofoutstanding contributions to the <strong>scientific</strong> exploitationof <strong>incoherent</strong> <strong>scatter</strong> in Europe includingthe UK PUSCAT and MISCAT radarsand the radars of the <strong>EISCAT</strong> Scientific Association44
CRIRPChina ResearchInstitute ofRadiowavePropagationChinaSASuomen AkatemiaFinlandDFGDeutscheForschungsgemeinschaftGermanySTELSolar TerrestrialEnvironmentLaboratory, NagoyaJapanNIPRNational Institute ofPolar ResearchJapanNFRNorgesforskningsrådNorwayVRVetenskapsrådetSwedenSTFCScience andTechnologyFacilities CouncilUnited KingdomSOCScience OversightCommittee<strong>EISCAT</strong> CouncilHeadquartersManagementCommittee/Council Advisory GroupSodankylä Kiruna Tromsø LongyearbyenUHF Heating VHF ESRDynasondeUniversity of Oulu/SGO IRF Kiruna University of Tromsø<strong>EISCAT</strong> SCIENTIFIC ASSOCIATIONFundingAgenciesCouncil andCommitteesHeadquartersActiveSitesInstrumentsHosts<strong>EISCAT</strong> organisational diagram, December 2009.45
<strong>EISCAT</strong> Scientific AssociationDecember 2009CouncilThe Council consists of a Delegation of each Associatewith a maximum of three persons from each Associate.FinlandDr. K. KauristieProf. T. NygrénDr. K. SulonenGermanyDr. H. BoosProf. J. RöttgerJapanProf. R. FujiiDr. H. MiyaokaNorwayProf. A. BrekkeDr. B. JacobsenDr. L. LønnumSwedenDr. T. AnderssonProf. D. MurtaghP. R. of ChinaProf. Q. DongProf. J. WuUnited KingdomDr. I. McCreaMs. R. YoungChairpersonDelegateDelegateDelegateDelegateDelegateVice-Chairperson, DelegateDelegateDelegateDirectorDr. E. TurunenCouncil Advisory GroupTowards the end of the year the previous ManagementCommittee was reformed into the Council AdvisoryGroup. Its members were not yet finalised in December2009, the list here is of the acting members.Mr. H. AnderssonDr. T. AnderssonProf. A. BrekkeDr. K. KauristieDr. E. TurunenExecutivesSenior ManagementMr. H. AnderssonDr. E. TurunenSite LeadersStation ManagersHead of AdministrationCouncil Vice-ChairpersonCouncil MemberCouncil ChairpersonDirectorHead of Adm., Deputy Dir.DirectorScientific Oversight CommitteeUnder the guidance of the Council, the <strong>EISCAT</strong> <strong>scientific</strong>community organises a Scientific Oversight Committee.Mr. H. BoholmMr. R. JacobsenMr. M. J. PostilaDr. M. T. RietveldMr. L.-G. Vanhainen<strong>EISCAT</strong> Svalbard RadarTromsø RadarSodankylä SiteTromsø HeatingKiruna SiteDr. A. AikioDr. N. BlagoveshchenskayaDr. S. BuchertDr. J. ChauDr. M. KoschProf. C. La HozProf. R. LiuProf. S. NozawaProf. J. RöttgerFinlandExternal memberSwedenExternal memberUnited KingdomNorwayChairperson, P. R. of ChinaJapanGermany46
<strong>EISCAT</strong> staff at the Annual Review Meeting, 11–13 February 2009, at Pallastunturi, Finland.
Appendix:<strong>EISCAT</strong> Scientific AssociationAnnual Report, 200949
<strong>EISCAT</strong> Scientific Association Annual Report 2009<strong>EISCAT</strong> Scientific AssociationRegistered as a Swedish non-profit organisationOrganisation number: 897300-2549Annual report for the financial year 2009-01-01 – 2009-12-31The <strong>EISCAT</strong> Council and the Director for the Association herewith submits the annual reportfor 2009.ContentPageAdministration report 1Profit and loss accounts 5Balance sheet 6Statement of cash flows 7Notes 850
<strong>EISCAT</strong> Scientific Association Annual Report 2009ADMINISTRATION REPORTOwnership, organisation and objectiveThe <strong>EISCAT</strong> Scientific Association was established in 1975 through an agreement between sixEuropean organisations. Japan joined in 1996 and the Peoples Republic of China in 2007.The <strong>EISCAT</strong> Associates at 2009-12-31 are: China Research Institute of Radiowave Propagation(Peoples Republic of China), Deutsche Forschungsgemeinschaft (Germany), NationalInstitute of Polar Research (Japan), Norges forskningsråd (Norway), Science and TechnologyFacilities Council (United Kingdom of Great Britain and Northern Ireland), Solar-TerrestrialEnvironment Laboratory, Nagoya University (Japan), Suomen Akatemia (Finland), andVetenskapsrådet (Sweden).A new <strong>EISCAT</strong> Agreement came into force 2007-01-01, with all Associates making long termfunding commitments to the Association. The Association has its formal seat in Kiruna,Sweden, and is registered as a non-profit organisation.The aim of the Association is to make significant progress in the understanding of physicalprocesses in the high latitude atmosphere by means of experimental programmes generallyconducted using the <strong>incoherent</strong> <strong>scatter</strong> radar technique, which may be carried out as part ofwider international projects. For this purpose, the Association has developed, constructed,and now operates, a number of radar facilities at high latitudes. At present, these comprise asystem of stations at Tromsø (Norway), Kiruna (Sweden), Sodankylä (Finland), andLongyearbyen (Svalbard).The Association is fully funded by the Associates but additional operations may also befunded by short term additional contributions from both Associate and non-Associatebodies. Depending on the available funding, <strong>scientific</strong> priorities and operational targets areadjusted on an annual basis.The <strong>EISCAT</strong> Council is charged with the overall administration and supervision of theAssociation's activities. The Council appoints a Director, who is responsible for the dailymanagement and operation of the facilities of the Association.Operation and <strong>scientific</strong> developmentThe <strong>EISCAT</strong> Radars delivered a full programme of operations for the user community andoperated reliably throughout the year with only minor interruptions due to equipment oroperational problems.The various <strong>EISCAT</strong> radars operated for a total of 3 688 accounted hours (5 209 hours in2008).Common Programmes amounted to 43% (34%) of the operations. Special Programmesamounted to 40% (34%) and other operations, such as the TNA project runs, amounted to17% (32%) of the total run hours.- 2 -51
<strong>EISCAT</strong> Scientific Association Annual Report 2009Both contracts under the European Union’s Sixth Framework Programme initiative, the<strong>EISCAT</strong>_3D design study and the Transnational Access project ended during the year.Both projects were completed in a proper manner. The <strong>EISCAT</strong>_3D project planningcontinues and a bid for the European Union’s Seventh Framework Programme, ESFRIprojects preparatory phase, was submitted in December.The Transnational Access project funded six user campaigns and 195 hours (92 hours) ofoperation during the final period of the four year project.Scientists from France, Ukraine and Russia paid for the use of the facilities. Totally298.5 hours (211.5 hours) were run on behalf of these affiliated countries.The annual staff review meeting was held in Pallastunturi, Finland, mid February. <strong>EISCAT</strong>scientists attended several international conferences during the year. The <strong>EISCAT</strong>_3Dcontinued work, including setting up the new consortium that submitted the preparatoryproject bid, and promotion trips also meant frequent travel. The number of travel daysincreased by about 50% in 2009.Future operation and <strong>scientific</strong> developmentDuring the coming year, <strong>EISCAT</strong> will continue to support the wide range of existing and newprogrammes proposed by the various Associates’ <strong>scientific</strong> communities, including thehosting of user-supplied equipment.It is though expected that UHF tristatic runs will no longer be possible beyond July 2010since the required disturbance free frequency slots in Finland and Sweden will be taken inuse by mobile phone operators. In Sweden, the operators will have access to the frequencyspectrum 1 March 2010 and in Finland 1 January 2010, though it has been stated that theFinnish operator will only start using it near the Finnish site 1 July 2010 and the Swedish oneperhaps not at all in 2010.Ways of continuing tristatic capabilities are considered. The primary option is the planned<strong>EISCAT</strong>_3D system which will give full three-dimensional capabilities. Since the <strong>EISCAT</strong>_3Dproject is still years from build, intermediate steps are evaluated which could fill some<strong>scientific</strong> requirements, like meteor studies, while waiting for the new system.The three other radar systems, UHF in monostatic mode, VHF and the Svalbard Radarcontinues undisturbed. The Heating facility has recently been modernised and its extendedcapabilities allows for new experimental modes.The work of the Council and its committeesThe Council had two ordinary and one extraordinary meeting under the leadership of theChairperson, Dr. Kirsti Kauristie: in June, Berlin, Germany and in October, Lillehammer,Norway. An extraordinary telephone conference meeting was held as in December.- 3 -52
<strong>EISCAT</strong> Scientific Association Annual Report 2009The management committee had two meetings: in May, Longyearbyen, Svalbard and inSeptember, Sodankylä, Finland.The Scientific Oversight Committee had two meetings during the year: March, Kühlungsborn,Germany and in September, Arecibo, Puerto Rico.Council considered mainly regular business matters. The transfer of Associateship from UK’sScience and Technology Facilities Council (STFC) to the Natural Environment ResearchCouncil (NERC) resulted in the extraordinary meeting. The addressed issue, the length of theUK commitment at the time of transfer, is now resolved.Council decided also to change the remit of the management committee such that itbecomes an advisory group for Council. The new Council Advisory Group is headed by theCouncil Chairperson and will provide guidance and advice to Council.Budget development during the yearThe 2009 operations ended very close to the operating target set for the year. Both EUsupported projects ended during the year. Both were four year projects and both ended asenvisaged though bit below the initial budget total.French and Ukrainian scientists took advantage, against payment, of the systems. It isanticipated that both countries, and Russia, will continue to make use of the systems also inthe coming years.Most of the regular Associates, Finland, Japan, Norway, P. R. of China, Sweden and UnitedKingdom agreed to add an inflationary compensation to their annual contributions in 2009.In addition, since the contributions are in local currencies, the income side benefited fromthe relatively weak SEK-currency. Due to low global interest levels, the budgeted bankinterest on own funds did not meet the target.The continued <strong>EISCAT</strong>_3D work resulted in a bid for a preparatory phase, under the EUFramework Programme 7 initiative. The application was submitted in December 2009 andthe first evaluation results look promising.The long-term budget planThe long-term budget plan is becoming challenging due to the current known fundingshortage from 2012 onwards. For 2010 and 2011, we do not anticipate any issues other thanthe reported tristatic problem and the overall operating target for these years can bemaintained.The result for 2009 and the deficit handlingThe year was balanced by transferring the surplus, relative to the budget, of 3 415 kSEK, tothe investment fund.- 4 -53
<strong>EISCAT</strong> Scientific Association Annual Report 2009PROFIT AND LOSS ACCOUNTSin thousands of Swedish CrownsNote 1 2009 2008Associate contributions Note 2 26 586 23 611Other operating income 6 180 8 59232 766 32 203Operation costs ‐5 257 ‐6 361Administration costs ‐4 517 ‐4 253Personnel costs Note 3 ‐17 706 ‐23 956Depreciation of fixed assets ‐2 198 ‐5 026‐29 677 ‐39 596Operating profit/loss 3 089 ‐7 393Interest income 85 866Other financial income and cost ‐622 351Own reserves and funds Note 4 ‐1 335 ‐145‐1 871 1 072Profit/loss after financial items 1 217 ‐6 321Appropriations Note 5 ‐3 415 1 295Transfer from funds invested Note 6 2 198 5 026‐1 217 6 321Net profit/loss for the year 0 0‐ 5 ‐54
<strong>EISCAT</strong> Scientific Association Annual Report 2009BALANCE SHEETin thousands of Swedish CrownsASSETS2009 2008Fixed assetsTangible fixed assets Note 7Buildings 3 843 3 995Radar systems 821 2 041Equipment and tools 2 099 1 6436 764 7 679Current assetsReceivables 3 871 1 723Prepayments and accrued income Note 8 640 610Cash at bank and in hand Note 9 19 222 20 37023 733 22 703Total assets 30 496 30 383CAPITAL AND LIABILITIESCapitalFunds invested Note 10 6 764 7 108Funds held on reserve Note 11 18 763 16 05325 526 23 161Long term liabilitiesLong term liabilities Note 12 0 509Current liabilitiesLiabilities, trade Note 13 4 469 4 768Provisions Note 14 155 37Other liabilities 345 1 9084 970 6 713Total capital and liabilities 30 496 30 383Pledged assets 0 509Contingent liabilities none none‐ 6 ‐55
<strong>EISCAT</strong> Scientific Association Annual Report 2009STATEMENT OF CASH FLOWSin thousands of Swedish Crowns2009 2008Operating activitiesOperating result before financial items 3 089 ‐7 393Transfer from funds invested 2 198 5 026Interest received 85 866Currency exchange rate changes ‐658 314Extra ordinary income and cost 36 37Increase/decrease of receivables ‐2 148 878Increase/decrease of prepayments and accrued income ‐30 5Increase/decrease of creditors and liabilities ‐2 252 ‐11 364Cash flow from operations 321 ‐11 631Investment activitiesInvestments in tangible assets ‐1 469 ‐908Cash flow from investment activities ‐1 469 ‐908Cash flow for the year ‐1 148 ‐12 539Liquid assets at the beginning of the year 20 370 32 909Liquid assets at the end of the year 19 222 20 370‐ 7 ‐56
<strong>EISCAT</strong> Scientific Association Annual Report 2009NOTES 2009 2008Note 1 Accounting principlesThe accounting and valuation principles applied are consistent with theprovisions of the Swedish Annual Accounts Act and generally acceptedaccounting principles (bokföringsnämnden allmänna råd ochvägledningar).All amounts are in thousands of Swedish kronor (SEK) unless otherwisestated.ReceivablesReceivables are stated at the amounts estimated to be received, basedon individual assessment.Personnel costs in totalSalaries and emoluments paid to the Directors1 240 6 583Other personnel, employed and providedvia site contracts 11 031 11 472Social security contributions amounted to 3 944 4 717of which for pension costs 1 992 3 170The new Director, Dr. Esa Turunen, started his employment 2009‐01‐01.His employment contract with Council is for three years.Receivables and payables in foreign currenciesReceivables and payables in foreign currencies are valued at the closingday rate. Where hedging measures have been used, such as forwardingcontracts, the agreed exchange rate is applied. Gains and losses relatingto operations are accounted for under other financial income and cost.Bank accounts in foreign currenciesBank balances in foreign currencies are valued at the closing day rate.Fixed assetsTangible fixed assets are stated at their original acquisition values afterdeduction of depreciation according to plan. Assets are depreciatedsystematically over their estimated useful lives. The following periods ofdepreciation are applied: Buildings 5 ‐ 50 years, Radar systems 3 ‐ 20years and Equipment and tools 1 ‐ 5 years.FinlandSalaries and emoluments 1 528 1 767Note 2 Associate contributions Average number of staff ‐ men and women 3 + 0 4 + 0The Associates contributed to the operation during the year inaccordance with the agreement. The commitments are in localcurrencies. The received contributions have been accounted in SEK.Norway (including Svalbard)Salaries and emoluments 5 370 12 0332009 Average number of staff ‐ men and women 9 + 0 10 + 1CRIRP (P. R. of China) 3 129DFG (Germany) 1 964 SwedenNIPR (Japan) 1 820 Salaries and emoluments 5 372 4 255RCN (Norway) 6 010 Average number of staff ‐ men and women 8 + 1 6 + 1SA (Finland) 3 996STFC (United Kingdom) 4 039VR (Sweden) 5 62826 586Accumulated contributions status as of 2009‐12‐31Of the pension costs, 320 kSEK (previous directors 1 660 kSEK) relates tothe Director. He and all other directly employed staff are included in ITPlike occupational pension plans. For the personnel provided via sitecontracts, the pension plans are handled by their respective employer.The members of the board (<strong>EISCAT</strong> Council) and members ofcommittees, who represents Associates, do not receive remunerationsfrom the Association. Travel expenses in connection with Council andcommittee meetings are normally covered by the Associates. For theCouncil Advisory Group (earlier named Management Committee), theAssociation cover meeting and travel costs.Salaries and emoluments and average number of staff per countryMembers of the board and Directors at year‐end ‐ men and womenThe board consist of delegations from every Associate country eachhaving a Delegate (formal member) and up to two Representatives.1976 ‐ 2009 Board members (<strong>EISCAT</strong> Council) 12 + 4 12 + 4Previous Associates 190 074 Directors 1 + 0 2 + 0CRIRP (P. R. of China) 10 609DFG (Germany) 188 749 Note 4 Own reserves and fundsNIPR (Japan) 66 904 Transactions involving own reserves and funds.RCN (Norway) 134 376SA (Finland) 58 817 Capital Operating reserveSTFC (United Kingdom) 214 391 Budgeted transfer to the reserve ‐1 614 ‐396VR (Sweden) 108 029 Transfer from the reserve 1 469 908971 948 Investments made ‐2 040 ‐942Note 3 Personnel costs and average number of employeesThe Association employs directly the Headquarters staff, currently aboutsix positions, including the Director. The Headquarters is located inKiruna, Sweden. The personnel working at the Kiruna (Sweden),Sodankylä (Finland), Svalbard and Tromsö (Norway) sites are notemployed by the Association. Instead, the personnel are provided viasite contracts by the Swedish Institute of Space Physics (Kiruna sitestaff), Oulu University (Sodankylä staff) and Tromsö University (Tromsöand Svalbard staff). The Association refunds all expenses related to theprovided staff, as well as an additional overhead.External projects reserveDesign study project complete,contingency released 1 504 ‐675Restructuring reserveBudgeted restructuring costs 1 500 1 355Spare parts reserveBudgeted transfer to the reserve ‐28 ‐27Transfer from the reserve 9 9‐ 8 ‐57
<strong>EISCAT</strong> Scientific Association Annual Report 2009Investment fundBudgeted transfer to the fund ‐2 000 02009 2008 2009 2008Note 8 Prepayments and accrued incomeSurplus fundBudgeted transfer from the fund 4 062 3 685 Prepaid rents 91 92Budgeted transfer to the fund ‐4 196 ‐4 062 Prepaid insurances 460 492Other items 89 26Sum own reserves and funds ‐1 335 ‐145 640 610Note 5 AppropriationsThe outcome for this year became a surplus relative to the budgetamounting to 3 415 kSEK. The amount has been transferred to theInvestment fund. The 2008 outcome was a loss (‐1 295 kSEK) which wascovered by funds from the Restructuring reserve.Note 9 Bank balances statusNordea 19 220 20 369Cash in hand 2 119 222 20 370Note 10 Funds invested statusNote 6 Transfer from funds invested Buildings 3 843 3 424The depreciation cost is covered by funds from Capital ‐ funds invested Radar Systems 821 2 041Equipment and Tools 2 099 1 643Note 7 Tangible fixed assets 6 764 7 108Changes in tangible fixed assets during 2009.Note 11 Funds held on reserveBuildingsOpening acquisition value 42 237 42 237Acquisitions during the year 137 0Disposals during the year 0 0Closing acquisition value 42 374 42 237Opening accumulated depreciation ‐38 242 ‐37 956Depreciations during the year ‐289 ‐286 Capital operating reserve 1 369 1 223Disposals during the year 0 0 Equipment repair fund 754 754Closing accumulated depreciation ‐38 531 ‐38 242 External projects reserve 0 1504Investment fund 7 971 2 556Closing residual value 3 843 3 995 Restructuring reserve 4 101 5 601Spare parts reserve 371 353Radar systems Surplus fund 4 196 4 062Opening acquisition value 244 381 244 381 18 763 16 053Acquisitions during the year 103 0Disposals during the year 0 0 Note 12 Long term liabilitiesClosing acquisition value 244 484 244 381Opening accumulated depreciation ‐242 340 ‐238 389Depreciations during the year ‐1 323 ‐3 951 Note 13 Liabilities, tradeOpening accumulated depreciation ‐30 283 ‐29 442Depreciations during the year ‐586 ‐789Disposals during the year ‐89 ‐52 Council cost 0 37Closing accumulated depreciation ‐30 958 ‐30 283 Electricity cost 155 0155 37Closing residual value 2 099 1 643Sum tangible fixed assets 6 764 7 679The main buildings and systems insurance for 2009 was paid inDecember.Investments were made a bit below the budgeted expectation. Lessspare parts than budgeted were acquired. Since the <strong>EISCAT</strong>_3D designstudy ended close to the planned target, the External project reserve didnot need to be used and the funds were released. The positive outcomeof this year (3 415 kSEK) has been put into the Investment fund. Theother transfers were as budgeted.Husbanken Norway loan concerning the owned flat on Svalbard waspaid‐off during the year. In 2008 the loan was amortized (34 kSEK).Disposals during the year 0 0 Both EU‐contracts, the <strong>EISCAT</strong>_3D Design Study and theClosing accumulated depreciation ‐243 662 ‐242 340 <strong>EISCAT</strong>_USERS_1 Transnational access project ended during the year. In2008, non released funds were accounted as liabilities.Closing residual value 821 2 041Liabilities EU, <strong>EISCAT</strong>_3D pre‐financing 0 0Equipment and tools Liabilities EU, USERS_1 pre‐financing 0 913Opening acquisition value 31 925 31 078 Other liabilities, trade 4 469 3 855Acquisitions during the year 1 229 908 4 469 4 768Disposals during the year ‐98 ‐61Closing acquisition value 33 057 31 925 Note 14 ProvisionsThe electricity provider on Svalbard did an errorounus cost debit Q12009. It is assumed that it will be corrected when settling the year.‐ 9 ‐58
<strong>EISCAT</strong> Scientific Association Annual Report 2009Tokyo 2010-06-03Dr. Tomas AnderssonProf. Ryoich i FujiiDr. Michael SchultzDr. Kati SulonenProf. Jian Wuk~~Dr. Karin ZacL-z=---Dr. Esa TurunenDirectorOur audit report was issued on 2010-0b- 11iJLrs. Annika WedinAuthorised Public Accountant- 10 -59
OhrlingsAudit reportTo the council of <strong>EISCAT</strong> Scientific AssociationCorporate identity number 897300-2549[ have audited the annual accounts, the accounting records and the administration of the counciland the director of E[SCAT Scientific Association for the year 2009. These accounts and theadministration of the <strong>association</strong> and the application of the Annual Accounts Act when preparingthe annual accounts are the responsibility of the council and the director. My responsibility is toexpress an opinion on the annual accounts and the administration based on my audit.[ conducted my audit in accordance with generally accepted auditing standards in Sweden. Thosestandards require that [ plan and perform the audit to obtain reasonable assurance that the annualaccounts are free of material misstatement. An audit includes examining, on a test basis, evidencesupporting the amounts and disclosures in the accounts. An audit also includes assessing theaccounting principles used and their application by the council and the director and significantestimates made by the counci l and the director when preparing the annual accounts as well asevaluating the overall presentation of information in the annual accounts. As a basis for my opinionconcerning discharge from liability, I examined significant decisions, actions taken andcircumstances of the <strong>association</strong> in order to be able to determine the liability, if any, to the councilor the director. I also examined whether any council member or the director has, in any other way,acted in contravention of the Annual Accounts Act or the statutes. I believe that my audit providesa reasonable basis for my opinion set out below.The annual accounts have been prepared in accordance with the Annual Accounts Act and give atrue and fair view of the <strong>association</strong>'s financial position and results of operations in accordancewith generally accepted accounting principles in Sweden.The statutory administration report is consistent with the other parts of the annual accounts.The council and the director have not acted in contravention of the statutes.Gavle, 14 June 2010Annika WedinAuthorized Public Accountant60
Report 2009 of the <strong>EISCAT</strong> Scientific Associationc○<strong>EISCAT</strong> Scientific Association<strong>EISCAT</strong> HeadquartersBox 812, SE-981 28 Kiruna, SwedenScientific contributions: <strong>EISCAT</strong> Associates and staff62
<strong>EISCAT</strong> SCIENTIFIC ASSOCIATIONThe <strong>EISCAT</strong> AssociatesDecember 2009CRIRPChina Research Institute of Radiowave PropagationChinawww.crirp.ac.cnSASuomen AkatemiaFinlandwww.aka.fiDFGDeutsche ForschungsgemeinschaftGermanywww.dfg.deSTELSolar Terrestrial Environment Laboratory, NagoyaJapanwww.stelab.nagoya-u.ac.jpNIPRNational Institute of Polar ResearchJapanwww.nipr.ac.jpNFRNorges forskningsrådNorwaywww.forskningsradet.noVRVetenskapsrådetSwedenwww.vr.seSTFCScience and Technology Facilities CouncilUnited Kingdomwww.scitech.ac.uk
<strong>EISCAT</strong> Scientific AssociationHeadquarters<strong>EISCAT</strong> Scientific AssociationBox 812SE-981 28 Kiruna, SwedenPhone: +46 980 79150Fax: +46 980 79159www.eiscat.seSitesKiruna<strong>EISCAT</strong> Kiruna SiteBox 812SE-981 28 Kiruna, SwedenPhone: +46 980 79136Fax: +46 980 29276Sodankylä<strong>EISCAT</strong> Sodankylä SiteTähteläntie 54BFIN-99600 Sodankylä, FinlandPhone: +358 16 619880Fax: +358 16 610375Tromsø<strong>EISCAT</strong> Tromsø SiteRamfjordmoenN-9027 Ramfjordbotn, NorwayPhone: +47 776 20730Fax: +47 776 20740Longyearbyen<strong>EISCAT</strong> Svalbard RadarPostboks 432N-9171 Longyearbyen, SvalbardPhone: +47 790 21236Fax: +47 790 21751