SOIL IMPROVEMENT WITH JET-GROUT COLUMNS: A CASE ...
SOIL IMPROVEMENT WITH JET-GROUT COLUMNS: A CASE ...
SOIL IMPROVEMENT WITH JET-GROUT COLUMNS: A CASE ...

Create successful ePaper yourself
Turn your PDF publications into a flip-book with our unique Google optimized e-Paper software.
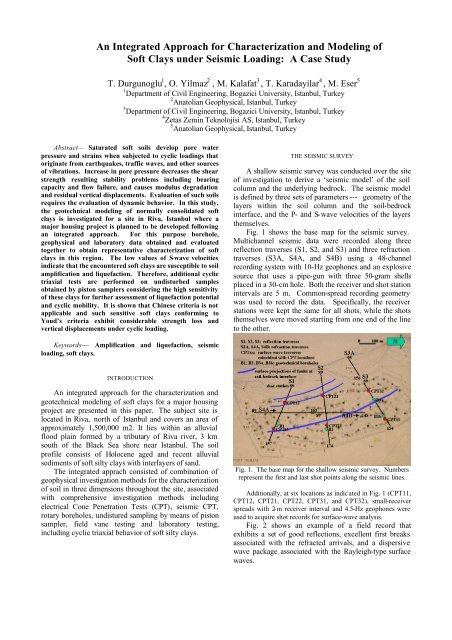
An Integrated Approach for Characterization and Modeling ofSoft Clays under Seismic Loading: A Case StudyT. Durgunoglu 1 , O. Yilmaz 2 , M. Kalafat 3 , T. Karadayilar 4 , M. Eser 51 Department of Civil Engineering, Bogazici University, Istanbul, Turkey2 Anatolian Geophysical, Istanbul, Turkey3 Department of Civil Engineering, Bogazici University, Istanbul, Turkey4 Zetas Zemin Teknolojisi AS, Istanbul, Turkey5 Anatolian Geophysical, Istanbul, TurkeyAbstract— Saturated soft soils develop pore waterpressure and strains when subjected to cyclic loadings thatoriginate from earthquakes, traffic waves, and other sourcesof vibrations. Increase in pore pressure decreases the shearstrength resulting stability problems including bearingcapacity and flow failure, and causes modulus degradationand residual vertical displacements. Evaluation of such soilsrequires the evaluation of dynamic behavior. In this study,the geotechnical modeling of normally consolidated softclays is investigated for a site in Riva, Istanbul where amajor housing project is planned to be developed followingan integrated approach. For this purpose borehole,geophysical and laboratory data obtained and evaluatedtogether to obtain representative characterization of softclays in this region. The low values of S-wave velocitiesindicate that the encountered soft clays are susceptible to soilamplification and liquefaction. Therefore, additional cyclictriaxial tests are performed on undisturbed samplesobtained by piston samplers considering the high sensitivityof these clays for further assessment of liquefaction potentialand cyclic mobility. It is shown that Chinese criteria is notapplicable and such sensitive soft clays conforming toYoud’s criteria exhibit considerable strength loss andvertical displacements under cyclic loading.THE SEISMIC SURVEYA shallow seismic survey was conducted over the siteof investigation to derive a ‘seismic model’ of the soilcolumn and the underlying bedrock. The seismic modelis defined by three sets of parameters --- geometry of thelayers within the soil column and the soil-bedrockinterface, and the P- and S-wave velocities of the layersthemselves.Fig. 1 shows the base map for the seismic survey.Multichannel seismic data were recorded along threereflection traverses (S1, S2, and S3) and three refractiontraverses (S3A, S4A, and S4B) using a 48-channelrecording system with 10-Hz geophones and an explosivesource that uses a pipe-gun with three 50-gram shellsplaced in a 30-cm hole. Both the receiver and shot stationintervals are 5 m. Common-spread recording geometrywas used to record the data. Specifically, the receiverstations were kept the same for all shots, while the shotsthemselves were moved starting from one end of the lineto the other.Keywords— Amplification and liquefaction, seismicloading, soft clays.INTRODUCTIONAn integrated approach for the characterization andgeotechnical modeling of soft clays for a major housingproject are presented in this paper. The subject site islocated in Riva, north of Istanbul and covers an area ofapproximately 1,500,000 m2. It lies within an alluvialflood plain formed by a tributary of Riva river, 3 kmsouth of the Black Sea shore near Istanbul. The soilprofile consists of Holocene aged and recent alluvialsediments of soft silty clays with interlayers of sand.The integrated apprach consisted of combination ofgeophysical investigation methods for the characterizationof soil in three dimensions throughout the site, associatedwith comprehensive investigation methods includingelectrical Cone Penetration Tests (CPT), seismic CPT,rotary boreholes, undistured sampling by means of pistonsampler, field vane testing and laboratory testing,including cyclic triaxial behavior of soft silty clays.Fig. 1. The base map for the shallow seismic survey. Numbersrepresent the first and last shot points along the seismic lines.Additionally, at six locations as indic ated in Fig. 1 (CPT11,CPT12, CPT21, CPT22, CPT31, and CPT32), small-receiverspreads with 2-m receiver interval and 4.5-Hz geophones wereused to acquire shot records for surface-wave analysis.Fig. 2 shows an example of a field record thatexhibits a set of good reflections, excellent first breaksassociated with the refracted arrivals, and a dispersivewave package associated with the Rayleigh-type surfacewaves.
Analysis of surface waves includes isolating thedispersive wave package on the shot record by muting,plane-wave decomposition by transforming the data fromoffset domain to ray-parameter domain, computing theamplitude spectrum of each of the plane-wavecomponents, interpreting the resulting spectra for thephase-velocity curve for the fundamental mode ofRayleigh waves, and finally, inverting it to estimate an S-wave velocity-depth profile [4]. Fig. 8, 9, and 10 showthe S-wave velocity-depth profiles estimated at six CPTlocations on Lines S1, S2, and S3.the velocities, we have assigned average P-wavevelocities for each of the layers as denoted in Fig. 3b,4b, 5b, 6, and 7. Average P-wave velocities forlayers 1, 2, 3, and 4 are 600, 800, 1,200, and 2,200m/s, while the metamorphosed volcanic bedrockvelocity is 3,000 m/s.Fig. 8. Combined interpretation of the S-wave velocity-depthprofiles (top) and the P-wave velocity-depth model (Fig. 4b) toderive an S-wave velocity-depth model for Line S1.Fig. 6. Combined interpretation of the P-wave velocity-depthmodels for Lines S3A and S3.Fig. 9. Combined interpretation of the S-wave velocity-depthprofiles (top) and the P-wave velocity-depth model (Fig. 5b) toderive an S-wave velocity-depth model for Line S2.Fig. 7. Combined interpretation of the P-wave velocity-depthmodels for Lines S4A and S4B.SEISMIC INTERPRETATIONWe now combine the results of the analysis ofreflected, refracted, and surface waves to derive theseismic model for the soil column and the bedrock.(1) The interpretation of the reflection seismic sections(Fig. 3a, 4a, and 5a) combined with the P-wavevelocity-depth models (Fig. 3b, 4b, and 5b) suggests asoil column with four layers with significant velocitycontrast. For the alluvial basin that underlies thesurvey site we have similarly interpreted the P-wavevelocity-depth models associated with the refractiontraverses (Fig. 6 and 7). By using the color bar forFig. 10. Combined interpretation of the S-wave velocity-depthprofiles (top) and the P-wave velocity-depth model (Fig. 5b) toderive an S-wave velocity-depth model for Line S3.
In this study, cyclic stress ratio for specimens tested intriaxial test setup (CSR tx ) is defined as the ratio of cyclicshear stress on the sample (σ d-cyc /2) to effective meanconsolidation stress (σ′ m ). Since all of the samples areisotropically consolidated (no initial shear stress on thesample), CSR tx becomes:σd−cycCSRtx=2 ⋅σ′3cwhere σ′3c is effective lateral consolidation pressure. Dueto differences in the stress path and the nature oflaboratory testing procedures, cyclic stress ratio arecorrected as CSR field = 0.9⋅c r ⋅CSR triaxial , where the averagevalue of the correction factor c r is 0.7 for various normallyconsolidated fine grained soils [7].The triggering of liquefaction is represented in termsof number of uniform, constant amplitude cycles requiredto reach one of the following conditions during the test:3% single amplitude axial strain, 5% double amplitudeaxial strain or zero effective lateral stress.The variation of cyclic strength (N f , number of cyclesto failure) with respect to CSRtx is shown in Figure 13.N f is selected as the minimum of number of cyclesrequired to produce cyclic liquefaction. It could be seenfrom this figure that the cyclic liquefaction condition wasreached in all tests except one sample with high plasticityvalues (i.e. LL=72, PI=38).CSRtx0.70.60.5PI: 21-25PI: 26-30PI: 31-35PI: 36-400.40.31 10 100N f , Number of cycles to failureFig. 13. Number of cycles required to reach failure conditionFig. 12. Sample output of a cyclic triaxial testA total of eight cyclic undrained triaxial tests wereperformed on silty clays obtained from seven differentsample tubes. Plasticity, water content, sieve analysis,and hydrometer tests were performed for each sample.Index properties of the samples and in situ test results aresummarized in Table 1.Table 1. Properties of the test samplesDevelopment of residual pore water pressure isplotted in Figure 14. The amount of developed pore waterpressure increases with increasing number of cycles andamplitude of loading. The relation between ∆u N andlog(N) is approximately linear. However, it is known thatpore pressure measurements are difficult in cyclic testingof materials with low permeability [8]. It is also generallyobserved during the testing that the cyclic strain increasessignificantly before the excess pore water pressurereaches the initial confining stress level.0.8USCS : Unified soil classification systemLL, PL : Liquid limit, Plastic limitω n : Natural water contentFC : Fines content
IMPLICATIONS AND CONCLUDING REMARKSSeed and Idriss [9] developed a criteria called asChinese criteria for clayey soils subjected to liquefactionbased on the data obtained from the earthquakes in China.According to these criteria a clayey soil can liquefy underseismic loading if all of the following conditions aresatisfied :• Particles finer than 5µm < 15%• LL < 35%• ωn / LL > 0.9According to the results of the performed cyclictriaxial tests, Riva clay under study did not conform withthe Chinese criteria as could be seen from the Figure 15.Youd [10] stated that the Chinese criteria are reliable forpredicting liquefaction of fine grained sediments but aregenerally conservative. However, the criteria do notwork for sensitive soils. Thus, the plastic and clayeysoils are also susceptible to liquefaction or cyclic mobilitydevelops associated with a strength degradation if they aresensitive and may develop excess deformations and loosestrength during the earthquakes. Youd [10] proposed thecriteria as shown in the second column of the Table 2 fordetecting the sensitivity for seismically induced strengthloss. As could be seen from the third column on the sameTable, Riva clay conforms with these criteria.Table 2. Youd (1998)’s Criteria for sensitive clayssubjected to excessive deformation and strength lossduring/after seismic excitationSancio et al. [11] have found based on a large numberof cyclic triaxial tests performed on “undisturbed”specimens of Adapazari that the soils with PI>12, whichgenerally have LL>35 can generate significant strains in asmall number of cycles when a high CSR is applied on thecontrary of the Chinese criteria. It is noted that thelaboratory testing is essential for the soft silty clays withhigh plasticity to assess the cyclic liquefactionsusceptibility.Consquently, it should also be noted that for softclays with shear wave velocities as low as Vs