

r - part - usaid
r - part - usaid
r - part - usaid

You also want an ePaper? Increase the reach of your titles
YUMPU automatically turns print PDFs into web optimized ePapers that Google loves.
---------------------------------------------------------------<br />
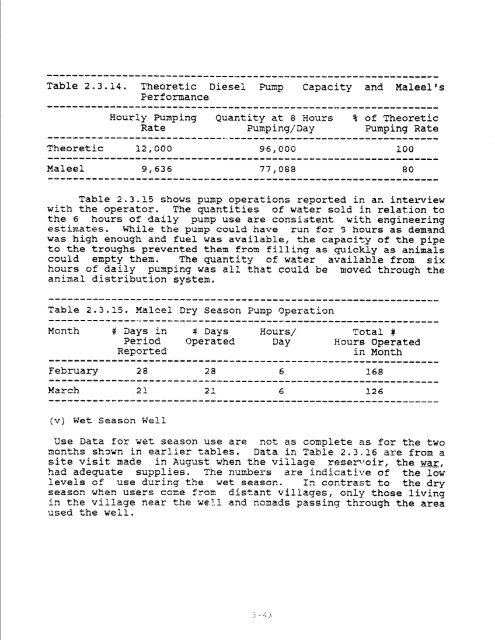
Table 2.3-14. Theoretic DieseX Pump Capacity and Maleel's<br />
Perf omatrice<br />
---------------------------------------------------------------<br />
Hourly Pumping Quantity at 8 Hours % of Theoretic<br />
Rate Pumping/'Day Pumping Rate<br />
---------------------------*--*---------------------------------<br />
Thearet ic 12,000 96,000 If 0<br />
-I-------*----b--CICI---"--------------------*--------------------<br />
Maleel 9,636 37,088 80<br />
**----------------*----*---*--*---*----------------------------<br />
Table 2.3.25 shows pump operations reported in an interview<br />
with the operator. The quantities of water sold in relation to<br />
the 6 hours of daily pump use are consistent witin e~gineering<br />
estimates. While the pump could have run for 3 hours as demand<br />
was high enough and fuel was available, the capacity of the pipe<br />
to the troughs prevented them from filling as quickly as animals<br />
could empty then. The quantity of water available from. six<br />
hours of daily pumping was a13 that could be maveC through the<br />
animal distribution system.<br />
--llllll---------C-_1---------1111------------------------------------<br />
Tzbis 2.3.15- Malcel Dry Season Pump operation<br />
...............................................................<br />
Month If Days in 4 Days Hours/ Total #<br />
Period Operated Day Hours Operated<br />
Re<strong>part</strong>ed in Month<br />
---l--lFl----l*--t---------------------------------------------<br />
February 28 28 6 168<br />
-IPll-lF------*-------------l-----------------------<br />
#arch 21 21 6 3.26<br />
(v) wet Season Well<br />
Use Data for wet season use are not as complete as for the two<br />
months sbwn in earlier tables. Data in Table 2.3.16 are from a<br />
rite visit made in A u ~ s when t the village resensir, the war,<br />
had adequate supplies. The numbers are indicative of the low<br />
levels cf use during the wet season. I3 contrast to the dry<br />
season when users co~e from distant villages, only those living<br />
in the village near the well and nomads passing through the area<br />
used the well.


